U.S. Department of Transportation
Federal Highway Administration
1200 New Jersey Avenue, SE
Washington, DC 20590
202-366-4000
Federal Highway Administration Research and Technology
Coordinating, Developing, and Delivering Highway Transportation Innovations
 |
| This report is an archived publication and may contain dated technical, contact, and link information |
|
Publication Number: FHWA-HRT-04-136
Date: December 2005 |
|||||||||||||||||||||||||||||||||||||||||||||||||||||||||||||||||||||||||||||||||||||||||||||||||||||||||||||||||||||||||||||||||||||||||||||||||||||||||||||||||||||||||||||||||||||||||||||||||||||||||||||||||||||||||||||||||||||||||||||||||||||||||||||||||||||||||||||||||||||||||||||||||||||||
Enhanced Night Visibility, Volume V: Phase II—Study 3: Visual Performance During Nighttime Driving in SnowPDF Version (1.03 MB)
PDF files can be viewed with the Acrobat® Reader® CHAPTER 4–DISCUSSION AND CONCLUSIONSDETECTION AND RECOGNITION DISTANCESWhile there were some significant differences in the detection and recognition distances among different VESs during nighttime driving in snow, these differences would result in minimal improvements to driver reaction times for the objects tested. The HLB supplemented with UV–A allowed drivers to detect objects farther away than with the HLB system alone by as much as 6.7 m (22 ft), as shown in table 16, representing an 11 percent increase. On average, the HID configuration provided the lowest detection and recognition distances. When compared to the HLB, the HID headlamps resulted in object detection distances that were 8.2 m (27 ft) closer to the object of interest, a 14 percent decrease in distance. Visibility for all the VESs was severely decreased by the snow, approximately 5.1 cm/h (2 inches/h) to 12.7 cm/h (5 inches/h), when compared to the clear weather condition, a decrease ranging from 65 to 68 percent depending on the VES (table 17). These results were comparable to the decrease in visibility seen in the rain condition study (ENV Volume IV). It is important to note that all VES configurations used in this study appear to have been affected equally by the low visibility, with a range of only 3 percent separating the percentile reductions in detection distances for the four configurations when compared to the results from the clear weather condition study (ENV Volume III).
These differences in distance can be translated to gains or losses in reaction time (table 18). Reaction time has been used in the past to evaluate time margins for crash avoidance behavior when encountering obstacles in the driving path.(19) As mentioned previously, significant differences between the HLB and the other VESs were less than 8.2 m (27 ft), which translates to less than one second of additional reaction time, even at relatively low speeds (table 18).
While these distances and reaction times provide an indication of the advantages of one system over another, they fail to completely describe any potential safety benefits or concerns based on VES use; however, with a limited number of assumptions, the VES-specific detection distances in snow conditions can be compared against various speed-dependent stopping distances. Collision-avoidance research dealing with different aspects of visibility suggests that time-to-collision is an important parameter in the enhancement of driving safety.(20) For consistency, time-to-collision will be presented as distance-to-collision, or stopping distance, for direct comparisons to detection distances from this study. Stopping distance is the sum of two components: (1) the distance needed for the braking reaction time (BRT) and (2) braking distance (table 19). Braking distance is the distance that a vehicle travels while slowing to a complete stop.(21) For a vehicle that uniformly decelerates to a stop, the braking distance (dBD) is dependent upon initial velocity (V), gravitational acceleration (g), coefficient of friction (f) between the vehicle tires and the pavement, and the gradient (G) of the road surface, with the gradient measured as a percent of slope. The equation in figure 11 provides the calculation of the braking distance (dBD) under these conditions: Figure 11. Equation. Braking distance. The total stopping distance (d) is the sum of the braking distance (dBD) and the distance traveled during the brake reaction time. The results from driver braking performance studies suggest that the 95th percentile BRT to an unexpected object scenario in open road conditions is about 2.5 s. (See references 22, 23, 24, and 25.) For a vehicle traveling at a uniform velocity, the distance traveled during BRT is the product of the reaction time and the velocity. Assuming a straight, level road with a gradient of zero percent (G = 0), the equation for the total stopping distance is as shown in figure 12: Figure 12. Equation. Total stopping distance for brake The equation in figure 12 may be used with either metric or English units, with distance (d) in meters or feet, velocity (V) in m/s or ft/s, and a value for the acceleration due to gravity (g) of 9.8 m/s2 or 32.2 ft/s2. The American Association of State Highway and Transportation Officials (AASHTO) provides separate equations for stopping distance with metric and English units, in which the acceleration due to gravity (g) and the coefficient of friction (f) are combined into a deceleration rate, and the velocity (V) is in units of km/h or mi/h, respectively.(22) The equation in figure 12 was used in this report because it does not require conversion factors and allows for a more direct comparison of the effect of varying the coefficient of friction (f). To calculate total stopping distance, this study used AASHTO's suggested deceleration rate (a) of 11.2 ft/s2 (3.4 m/s2), resulting in a friction coefficient for wet pavement of 0.35 as seen in the equation Figure 13. Equation. AASHTO calculation of coefficient of Stopping distances in snow conditions increase over dry-pavement distances because of the reduced coefficient of friction between the tires and the pavement. Using the equations and variables, stopping distances were calculated as shown in table 19.
The calculations in table 19 represent a simple condition, but they allow for some visualization of the VESs' capabilities. Based on these calculations, the average detection distances shown in table 16 for each VES tested in the snow condition (i.e., precipitation rate of approximately 5.1 cm/h (2 inches/h) to 12.7 cm/h (5 inches/h) with windshield wiper on high speed) are long enough to provide sufficient time to react to pedestrians dressed in white clothing and brake, as long as the speed is less than or equal to 40 km/h (25 mi/h), or less than 56 km/h (35 mi/h) with the five UV–A + HLB configuration (table 20 through table 23 in which an “X” means stopping distance might be compromised); however, some caveats do apply. First, these distances were obtained while drivers were moving at approximately 16 km/h (10 mi/h) or less, and their ability to detect objects will not necessarily remain the same as speed increases. Second, VESs that provide detection distances close to the stopping distance or that need a larger stopping distance might quickly become less effective when conditions such as worn tires or downhill slope worsen. As seen in the clear condition study (ENV Volume III) and rain condition study (ENV Volume IV), detection and recognition distances in the snow condition are deeply affected by the characteristics of the object, but this effect is modulated by the type of VES. The HID provided the shortest detection distance for low-contrast objects; the HLB supplemented by UV–A allowed drivers to detect the pedestrians dressed in white clothing farther away. These observations are even more apparent when described in terms of stopping distances. As shown in table 20 through table 23, it is important that only the five UV–A + HLB configuration appears to allow for an uncompromised stopping distance from a traveling speed of 56.35 km/h (35 mi/h) when the object is a pedestrian wearing white clothing.
As discussed in ENV Volume III, the literature review suggested that new VES technologies including HID and configurations supplemented by UV–A headlamps would outperform HLB in the experimental conditions for this study. The HID configuration did not reach that expectation. Although the HLB supplemented by UV–A did outperform HLB alone, the improvements (< 0.6 s), while statistically significant, do not represent a meaningful improvement in reaction time. In general, HID systems followed the same trend discussed during the clear and rain weather conditions (ENV Volumes III and IV), where they were outperformed by the rest of the systems. The same issues that were suggested then may have negatively affected the performance of this technology in the snow condition. It is possible that the HID system tested here differs significantly from the HID systems tested in other investigations in terms of cutoff and intensity; the characteristics of these systems vary considerably among manufacturers of the headlamps. While unpublished data generated by this investigation (refer to ENV Volume XVII, Characterization of Experimental Vision Enhancement Systems) agrees with Jost that an HID system provides more luminous flux than regular tungsten-halogen headlamps, there appear to be some shortcomings with how that luminous flux is used.(26) The large amount of visible light generated by HID systems requires a dramatic cutoff angle to comply with glare standards. While this provides more foreground luminance, less illumination is actually provided by the HID VES as the distance from the vehicle increases when compared to the other VESs such as halogen. The increased foreground luminance of the HID might have an adverse effect on a driver's performance by increasing the driver's light adaptation, thus decreasing the driver's capability to detect objects in dark environments; however, this hypothesis was not reflected in the subjective ratings, where the HID VES received better though not statistically different ratings than the HLB for six out of the seven statements. These results do correspond with the rain condition (ENV Volume IV). It is possible that the increased foreground luminance deceives drivers into believing that they can see farther, when in fact the results of this study show that they cannot. It is interesting that the subjective ratings for ability to detect and recognize objects (statements 1 and 2) matched the objective measurement rankings except for the order of HID and HLB even though the HLB, on average, provided detection and recognition distances that were approximately 8.2 m (27 ft) and 7.9 m (26 ft) longer, respectively. UV–A headlamps improved detection and recognition of various objects when five UV–A headlamps were used together with HLB, especially for pedestrians with white clothing; however, the improvement suggested by this study were not of the magnitude of the ones reported by Mahach et al.(27) and Nitzburg et al.(28) In addition, this extra 6.7 m (22 ft), which resulted in an improvement of 10 percent, is statistically significant but not a meaningful improvement for implementation purposes. One item of interest with respect to the five UV–A + HLB configuration is the larger distance between the points of detection and recognition compared to the other configurations (table 24). On average, for the
AGE EFFECTS ON DETECTION AND RECOGNITION DISTANCESIn the snow condition, in contrast to the clear condition but similar to the rain condition, age does not significantly affect drivers' detection and recognition distances. During the snow condition, visibility is severely restricted across both age groups, and overall no significant difference between age groups is observed in terms of detection and recognition distances; however, some trends did exist. Younger participants detected and recognized the pedestrians wearing white clothing slightly better than the middle-aged participants (longer detection distance of 4.3 m (14 ft) for perpendicular, 1.8 m (6 ft) for parallel), but the distances for the low-contrast (black clothing) pedestrian were essentially the same. As mentioned in ENV Volumes III and IV, visual acuity and contrast sensitivity decline with age. The same-age dependent trends of decreased visual acuity and contrast sensitivity mentioned in ENV Volume III are evident for this group of participants, as illustrated in figure 14 through figure 19. 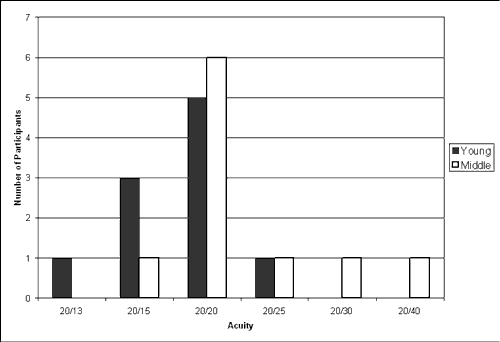 Figure 14. Bar graph. Participants' visual acuity divided by age group. 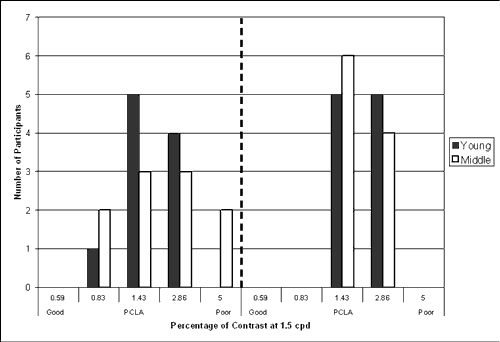 Figure 15. Bar graph. Participants' contrast sensitivity at 1.5 cycles per degree (cpd) 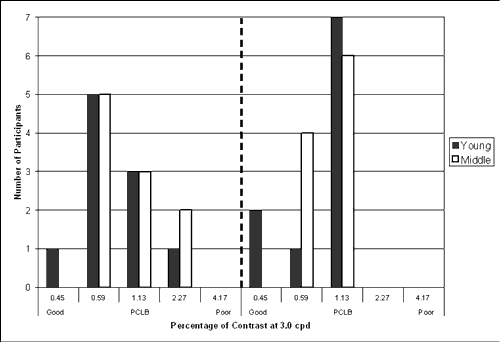 Figure 16. Bar graph. Participants' contrast sensitivity at 3.0 cpd divided by age group. 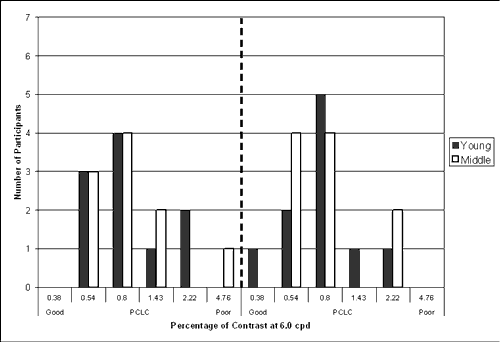 Figure 17. Bar graph. Participants' contrast sensitivity at 6.0 cpd divided by age group. 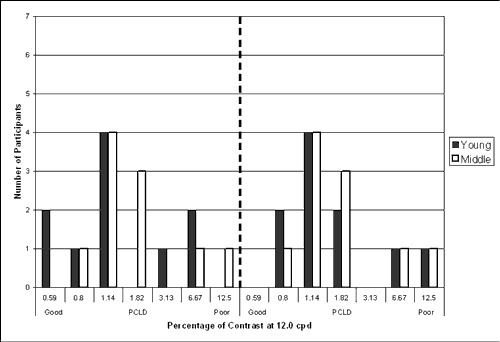 Figure 18. Bar graph. Participants' contrast sensitivity at 12.0 cpd divided by age group. 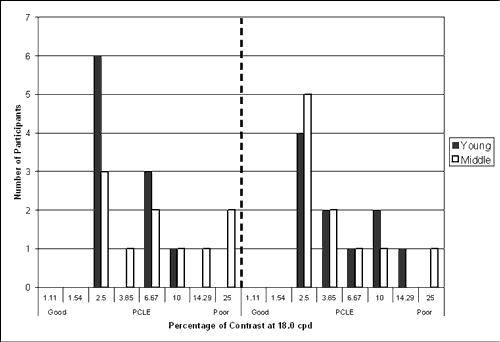 Figure 19. Bar graph. Participants' contrast sensitivity at 18.0 cpd divided by age group. SUMMARYIn summary, during the snow condition the HLB configuration alone and HLB configurations supplemented with UV–A were consistently the best in facilitating long detection and recognition distances; however, the overall improvement of UV–A does not seem to be meaningful. The following conclusions can be reached regarding the VESs tested during the snow conditions for Phase II–Study 3:
|

