U.S. Department of Transportation
Federal Highway Administration
1200 New Jersey Avenue, SE
Washington, DC 20590
202-366-4000
Federal Highway Administration Research and Technology
Coordinating, Developing, and Delivering Highway Transportation Innovations
 |
| This report is an archived publication and may contain dated technical, contact, and link information |
|
Publication Number: FHWA-HRT-04-139
Date: December 2005 |
|||||||||||||||||||||||||||||||||||||||||||||||||||||||||||||||||||||||||||||||||||||||||||||||||||||||||||||||||||||||
Enhanced Night Visibility Series, Volume VIII: Phase II—Study 6: Detection of Pavement Markings During Nighttime Driving in Clear WeatherPDF Version (554 KB)
PDF files can be viewed with the Acrobat® Reader® CHAPTER 2—METHODSEXPERIMENTAL DESIGNThis study was a mixed-factor design with three independent variables: VES (11 levels), pavement marking (3 levels), and age (3 levels). The VES configurations and pavement markings were the within-subjects factors; age was the between-subjects factor. Table 1 shows the experimental variables used for this study.
INDEPENDENT VARIABLESVES ConfigurationThe 11 VESs tested in this study were selected based on several considerations. HLB headlamps are the most common for vehicles in the United States and Europe, and they provide a baseline against which other systems can be measured. The use of HIDs is increasing. An earlier study indicated that UV–A headlamps would provide a number of potential improvements in nighttime driving.(6) Ultraviolet radiation, which is outside the visible light spectrum, has the potential benefit of reducing discomfort and disability glare caused by oncoming vehicles compared to other types of headlamps.(8) As a result of these findings, both an HLB and an HID headlamp were tested alone and in combination with three different configurations of UV–A. An HOH, HHB, and a low-profile HLB on a sedan (HLB–LP) comprised the remaining VESs. The HLB–LP was the only VES not tested on an SUV or pickup. Note, the term "HLB configurations" means all of the VESs using the HLB: HLB, hybrid UV–A + HLB, three UV–A + HLB, and five UV–A + HLB. The term "HLB with UV–A" indicates the hybrid UV–A + HLB, three UV–A + HLB, and five UV–A + HLB VESs. The same concept can be used to discuss the various VESs using HID systems. Table 2 lists the VESs used in the present study with their headlamp description, beam pattern, and vehicle/headlamp profile (high versus low). ENV Volume XVII, Characterization of Experimental Vision Enhancement Systems, contains details on the various VESs.
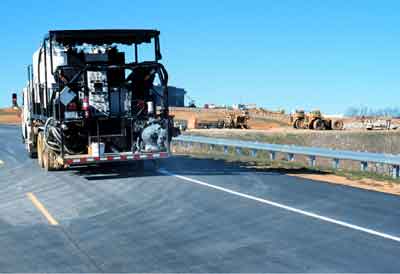
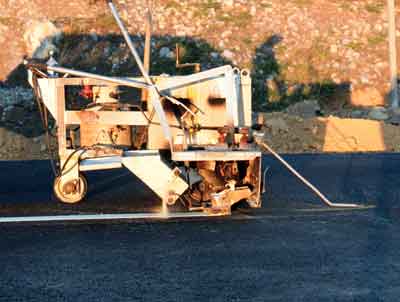
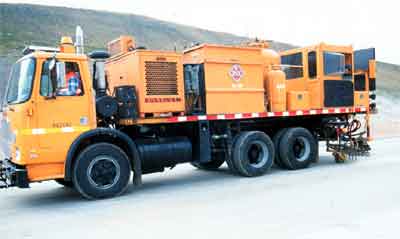
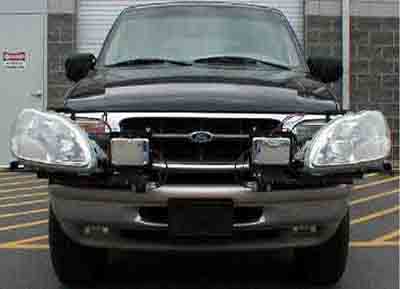
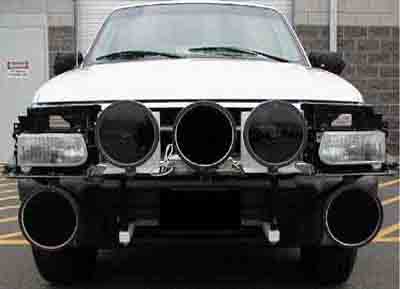
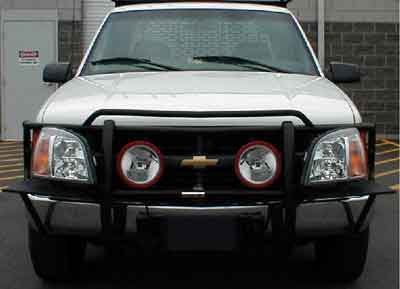
Pavement MarkingsThree pavement marking materials were used in this study: a two-component liquid system, fluorescent thermoplastic, and fluorescent paint. The two-component liquid system had not been investigated previously. The fluorescent paint and fluorescent thermoplastic both contain phosphorescent materials, but they were applied differently. The fluorescent paint was sprayed on, similar to standard acrylic pavement marking paint, whereas the fluorescent thermoplastic was applied as a ribbon of molten material that was then allowed to cool. For each material, both the yellow dashed centerline and the white edgeline were installed. The beginning and the end of the sections of white and yellow lines were coincident. Liquid SystemThe liquid system was selected for application because it exhibited nearly twice the retroreflectivity of conventional patterned tape markings. The liquid system was applied on an asphalt section of the roadway. The material uses a polyurea binder to allow for installation and quick drying. The equipment used for installation consisted of a mobile truck-mounted, self-contained pavement marking machine specifically designed to apply the two-component liquid material (figure 2). The liquid system was applied over a 2-day period. Retroreflection was provided by both glass beads and proprietary ceramic retroreflective elements. Application was performed at a speed ranging from 10 to 13 km/h (6 to 8 mi/h) using a vehicle specifically designed for this material. Fluorescent ThermoplasticThe fluorescent thermoplastic was installed on a section of road with an all-asphalt surface. The pavement marking material, both yellow and white, was manufactured using a hydrocarbon resin base with a 40 percent clear glass bead intermix. The material was applied using a handcart (gravity extrusion) for each color (figure 3). The thermoplastic was applied at a 90-mm (0.39-inch) thickness followed by drop-on beads at a rate of approximately Fluorescent PaintThe final section of roadway, which consisted of tined hydraulic cement concrete, had the fluorescent paint applied to it. Both colors were a waterborne, flat acrylic-based fluorescent road-marking paint. Fluorescent white and yellow glass beads, as appropriate, were used with the paint. Before the application of the yellow centerlines, the concrete surface, which was fully cured and more than 30 days old, was swept with a broom tractor. Test strips were used to verify correct line width AgeThe age variable had three levels: young drivers (18 to 25 years old), middle-aged drivers (40 to 50 years old), and older drivers (60 years or older). Age is an important factor when considering the risks of nighttime driving. These age groupings are based on common age ranges that have increased crash risk or represent a substantial portion of the driving population. For example, young drivers are often overrepresented in fatal collisions. Middle-aged drivers represent the largest portion of the driving population.(17) Older drivers have difficulty detecting low-contrast objects and report discomfort glare as a major problem with nighttime driving.(12,18) Older drivers exhibit different nighttime driving performance than the other age groups in part because vision degradation has a significant effect on driving performance.(12) Research has shown that enhanced visibility potentially could reduce the number of deaths each year.(14) DEPENDENT VARIABLESDetection distances of the beginning and end of the pavement markings were used as two dependent variables. During each session, participants were asked to indicate when they first saw the pavement marking ("beginning detection distance") and when they detected the end of the pavement marking ("ending detection distance"). The pavement marking detection distances determined which of the three pavement marking materials and which of the 11 VESs provided the greatest pavement marking visibility for drivers at night. Because the center and edgelines used the same pavement marking technology within each section and the covering of the center and edgelines was coincident, the participants were not instructed to look at one line or the other. Consequently, beginning and ending distances refer to both lines. PARTICIPANTSThe 30 participants in the study were divided into the three different age categories: 10 participants were between the ages of 18 and 25 (young drivers), 10 were between the ages of 40 and 50 (middle-aged drivers), and 10 were aged 60 and over (older drivers). Gender was balanced in each age group—five male and five female participants. Candidates were screened using a preliminary screening questionnaire. They were considered eligible if the selection conditions were fulfilled (appendix A). Before participation in the study, candidates were required to sign an informed consent form (appendix B), present a valid driver's license, pass the visual acuity test (appendix C) with a score of 20/40 or better (as required by Virginia State law), and have no health conditions that made operating the research vehicles a risk. After candidates met the eligibility requirements, they were scheduled to participate in the study for two consecutive nights. Participants were informed about their right to freely withdraw at any time and told they would be remunerated at a rate of 20 dollars per hour for the time they participated. APPARATUS AND MATERIALSVehiclesFour vehicles were used for the onroad study (figure 5 through figure 8). Three of the vehicles were high profile (two sport utility vehicles and one pickup).
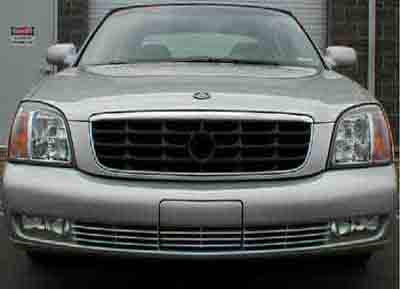
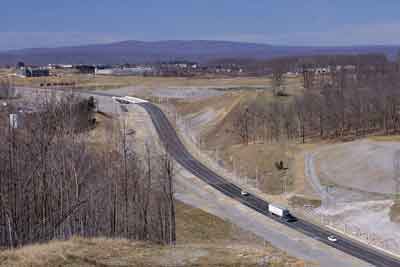
SUV 1 was equipped with two hybrid UV–A headlamps and was configured to interchange the HLB and HID VESs. The HID and the HLB headlamps were mounted on a light bar so the VESs could be positioned directly in front of the factory headlamps. The hybrid UV–A headlamps were permanently mounted on a bar in the front grill of the vehicle. The HLB and the HID headlamps were exchanged between data collection sessions so that each VES was paired with the hybrid UV–A headlamps. SUV 2 was similar to SUV 1. It was equipped with five UV–A headlamps and was configured to interchange the HLB and HID VESs. Five UV–A headlamps were mounted on the light bar in front of the vehicle grill. The configuration with the three UV–A headlamps used the top three UV–A spotlights (figure 6). The configuration with the five UV–A headlamps used the bottom two spotlights in combination with the top three spotlights. Between data collection sessions, the HLB and the HID VESs were exchanged so that both were paired with the three and five UV–A headlamps. The pickup was equipped with HOH and HHB lamps located in the same housing; the HOH lamp replaced the standard low-beam lamp. The sedan was equipped with halogen headlamps that were original equipment for this model vehicle. Because this vehicle was a sedan and had a lower profile than the other vehicles used, the headlamps were categorized as halogen low beam—low profile (HLB–LP). Headlamp AimingThe headlamps used for the HLB, HID, HOH, HHB, and UV–A configurations were located on external light bars. To accommodate changes from one configuration to another, the HLB and HID headlamps were moved onto, off of, and between vehicles. Each light assembly movement required a re-aiming process before the experiment session each night. An aiming protocol was developed with the help of experts in the field. (See references 19, 20, 21, and 22.) During the photometric characterization of the headlamps, it was discovered that the position of the maximum intensity location of the HLB, HOH, and HHB configurations was aimed higher and more toward the left than typically specified. This aiming deviation likely increased detection distances for the HLB and HOH configurations and likely decreased the detection distances for the HHB configuration. Details about the aiming procedure and the maximum intensity location appear in ENV Volume XVII, Characterization of Experimental Vision Enhancement Systems. In-Vehicle Data Collection SystemAll vehicles were equipped with an electronic odometer or distance measuring instrument (DMI), a laptop computer, and a hand-held pushbutton wand. The DMI unit and the pushbutton were connected to the laptop computer through serial ports, which allowed data input from both the in-vehicle experimenter and the participant. During the data collection, the participant pressed the pushbutton when he or she saw the beginning and ending pavement marking in each section. When the vehicle reached the end of the each pavement section, the in-vehicle experimenter pressed the space bar to provide a reference point for the detection distance. In each pavement marking section, three measurements were recorded: two button presses, which represented when the participant saw the beginning and the ending pavement marking in each section, and one space bar press, which represented when the vehicle passed the last pavement marking in each section. Every time the participant pressed the button or the in-vehicle experimenter pressed the spacebar on the laptop computer, the laptop recorded the corresponding distance from the DMI. These three measurements provided a complete set of distance data. The software, created specifically by the contractor for the ENV research project to allow such data extraction, enabled the in-vehicle experimenter to enter information such as participant number, age, gender, VES, and data collection night (first or second). Test FacilityThe Virginia Smart Road (figure 9) provided a closed-course segment to maximize safety for the participants and experimenters. The secluded roadway allowed customization of the road for the study; overhead lighting was turned off, and ambient lighting was adequately controlled to decrease the variability of the data. Appendix G gives more information on the Smart Road. A confound arose in study, however, because the different pavement types—concrete and asphalt—on the Smart Road created variations in contrast between the different pavement marking materials. The fluorescent paint was on concrete pavement; the fluorescent thermoplastic and liquid system pavement markings were on asphalt pavement. Concrete pavement is much lighter, so it had less contrast with the pavement marking. This paving material confound, which is discussed later, was taken into consideration when interpreting the data. The sections of different pavement marking materials were defined by hiding pavement markings with black masking tape before and after each section, making gaps where no pavement markings were visible 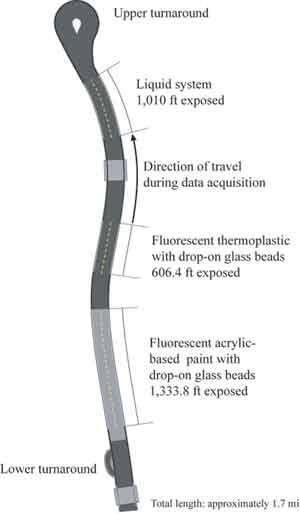 Figure 10. Diagram. Pavement marking material setup.
EXPERIMENTAL PROCEDUREAll participants drove at night and in clear weather. If rain, snow, or fog was present, the sessions that night were rescheduled. Clear weather was imperative because precipitation would have altered the retroreflectivity of pavement markings, thus altering the study's results. In addition, moisture in the air can affect the transmissivity of the atmosphere, which also can alter visibility and glare.(1) Two in-vehicle experimenters and two onroad experimenters were required for each data collection session. The in-vehicle experimenters conducted vision tests, helped familiarize participants to the Smart Road and the study, recorded data, and answered questions from participants throughout the study (appendix D). The in-vehicle experimenters were with the participants at all times. The onroad experimenters prepared the road and vehicles and oriented participants to the vehicles (appendix E). Each evening, two participant vehicles were run through the pavement marking visibility testing. Two experimental sessions per participant were required for each participant to experience all the VESs and pavement markings. VES CounterbalancingThe VESs presented in the same night were grouped together based on the placement of the HLB and HID headlamps on either the vehicle with hybrid UV–A headlamps or the vehicle with the five UV–A headlamps. Table 3 shows the two VES configuration groups. To evaluate the other headlamps, the HOH and the HHB were included in group A, and the HLB–LP was included in group B.
The VES groupings remained constant throughout the evaluation; however, the night (first or second) they were presented alternated. In other words, on the first night, half of the participants were presented with the group A VESs while the other half was presented with the group B VESs. On the second night, the order was switched. Within each group, the VESs were counterbalanced to avoid order effects (appendix F and appendix H). Thirty different presentation orders, one for each participant, were selected from a list of randomized orders; thus, each participant was exposed to the VES configurations in a unique order. Because of the VES vehicle setup, two participants could not run the same VESs at the same time. To avoid this conflict, compatible orders were conducted together. Participant ScreeningCandidates were screened initially over the telephone (appendix A). Candidates who met the eligibility criteria were scheduled to come in for two separate sessions on two separate evenings. Two candidates were scheduled for each session. When the candidates arrived, the experimenters reviewed the informed consent form (appendix B) and asked each candidate to present a valid driver's license. After candidates completed the informed consent form, the experimenters administered a series of three vision tests (appendix C). The vision tests included an informal test for acuity using a Snellen chart, a contrast sensitivity test, and a color vision test. The acuity test was performed to ensure that all participants had at least 20/40 vision, corrected or uncorrected, as required by Virginia State law. Results for the contrast sensitivity test and color vision test were recorded, but the results were not used to determine eligibility for participation in the study. A detailed experimenter protocol for the vision testing appears in appendix D. Familiarization and PracticeBecause four different vehicles were used during the study, the onroad experimenters oriented the participants to the different vehicles as encountered on the order sheets. At the upper Smart Road turnaround (see figure 10), an onroad experimenter escorted a participant to the experimental vehicle according to the predetermined order sheet for that participant. The participant was asked to adjust the seat, steering wheel, and climate controls for his or her comfort. Then the in-vehicle experimenter reviewed the experiment procedures. The experimenter explained the pavement marking detection task, showed the participant the handheld button, and used a diagram of the Smart Road to show the separation of the pavement marking sections. After all the participant's questions were answered, the in-vehicle experimenter instructed the participant to drive down the road at Practice RunThe experimental task was performed in only one direction on the road; participants began the task at the lower turnaround shown in figure 10. The first drive up the road was a practice run. The in-vehicle experimenter gave the participant the handheld button and instructed him or her to proceed up the road at 40 km/h (25 mi/h). The experimenter instructed the participant to press the pushbutton when he or she detected the beginning of the pavement marking and press it again when he or she detected the end of the pavement marking in a section. Anomalies in the vertical curvature of the pavement caused the pavement markings in a 3.3-m (11-ft) section of road to temporarily disappear from the driver's view. A white cone was placed to mark this area, and the in-vehicle experimenter pointed this out to the participant during the practice run. After the practice run was complete and all the participant's questions were answered, data collection began. General Procedure for Data CollectionThe two onroad experimenters met the two participants for that run when they arrived at the upper turnaround. The onroad experimenters escorted each participant to the appropriate experimental vehicle. While the onroad experimenter oriented the participant to the vehicle, the in-vehicle experimenter turned on the appropriate VES. The participant then drove the vehicle with the in-vehicle experimenter in the front passenger seat down the road to prepare for the detection task. At the lower turnaround, the participant was instructed to drive up the road in the right-hand lane at 40 km/h (25 mi/h) and press the button when he or she was able to detect the beginning or end of the pavement marking in each of three road sections. The participants were not instructed as to which line to watch (edge or center). To provide a reference point to calculate the detection distances from the participant's button press, the in-vehicle experimenter pressed the space bar when the vehicle was even with the end of the pavement marking in each section. If the participant said he or she did not accurately indicate either the beginning or end of the pavement marking, the lap was taken again. Each participant completed the pavement marking detection task for all 11 VES configurations in all three pavement marking sections. At no time during the pavement marking detection task did the participant vehicles directly face each other. Furthermore, all mirrors on the vehicles were covered to reduce the effect of glare from the other vehicle's headlamps. The participant repeated the procedure for either five or six VESs on the first night (see table 3), and then he or she returned a second night to complete the procedure for the remaining VESs. Before the data collection began on the second night, the in-vehicle experimenter reviewed the protocol with the participant and answered any questions. DATA ANALYSESAll data collected for the 30 participants were merged into a single database. An analysis of variance (ANOVA) was performed using a general linear model (GLM) procedure in SAS®. An alpha level of 0.05 was selected to indicate significance. A post hoc Student-Neuman-Keuls (SNK) test was conducted on significant main effects to determine the levels of the independent variables that were significantly different. The ANOVA evaluated whether there were significant differences among the 3 pavement markings (designated "Pvt. Mrkg"), 11 VES configurations (designated "VES"), and 3 age groups (designated "Age") with respect to both beginning and ending detection distances. A VES by Pavement Marking by Age mixed model was used with age as the between-subjects factor (table 4). The results of these analyses were used to answer the following research questions:
|