U.S. Department of Transportation
Federal Highway Administration
1200 New Jersey Avenue, SE
Washington, DC 20590
202-366-4000
Federal Highway Administration Research and Technology
Coordinating, Developing, and Delivering Highway Transportation Innovations
 |
| This report is an archived publication and may contain dated technical, contact, and link information |
|
Publication Number: FHWA-HRT-04-144
Date: December 2005 |
||||||||||||||||||||||||||||||||||||||||||||||||||||||||||||||||||||||||||||||||||||||||||||||||||||||||||||||||||||||||||||||||||||||||||||||||||||||||||||||||||||||||||||||||||||||||||||||||||||||||||
Enhanced Night Visibility Series, Volume XIII: Phase III—Study 1: Comparison of Near Infrared, Far Infrared, High Intensity Discharge, and Halogen Headlamps on Object Detection in Nighttime Clear WeatherPDF Version (1.01 MB)
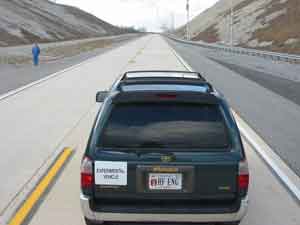
PDF files can be viewed with the Acrobat® Reader® CHAPTER 2—METHODSPARTICIPANTSEighteen individuals participated in this study. The participants were divided into three different age categories: six participants were between the ages of 18 and 25 years (younger category of drivers), six were between the ages of 40 and 50 years (middle category of drivers), and six were over the age of 65 years (older category of drivers). There were three males and three females in each age category. Participation was allowed after a screening questionnaire was completed and only if the selection conditions were fulfilled (appendix A). Participants were required to sign an informed consent form (appendix B), present a valid driver’s license, pass the visual acuity test (appendix C) with a score of 20/40 or better (as required by Virginia State law), and have no health conditions that made operating the research vehicles a risk. Each participant was instructed about his or her right to freely withdraw from the research program at any time without penalty. Each participant was told that no one would try to make him or her participate if he or she chose at any time not to continue and that he or she would be paid for the amount of time of actual participation. All data gathered as part of this experiment were treated with complete anonymity. Participants received 20 dollars per hour for their participation. Each participant drove with six different VESs during two or three driving sessions (nights). Three of the participants drove in two separate experimental sessions that lasted approximately 4.5 h. Fifteen of the participants drove in three separate experimental sessions that lasted approximately 3 h. The first session included training, during which the study was described and the forms and questionnaires were completed (appendixes B, C, and D). Participants also completed a practice lap for each of the six VESs to familiarize themselves with the Smart Road and the experimental detection and recognition methods. EXPERIMENTAL DESIGNThe study was a 6 by 3 by 17 mixed-factors design. There were three independent variables: (1) VES configuration, (2) age, and (3) type of object (including location). The between-subjects factor of the experiment was age, which had three levels (18 to 25 years, 40 to 50, and 65 and older). VES and object were within-subjects factors. There were six types of VESs tested: three were headlamp types, and three were IR-based systems with high head down (HHD) displays. There were 17 objects, including 12 pedestrians in various location scenarios, three retroreflective objects, and two obstacles. The VESs, age, and objects are described in more detail in the Independent Variables section. For counterbalancing, six possible orders of object presentation were developed. These orders included all the test objects but differed in when the objects were presented, the required turnarounds, and confederate vehicle interactions. The confederate vehicle was an additional vehicle driven by an experimenter who executed planned scenarios near the participant, making the participant drive as if in the presence of other traffic. The participant was not informed that the confederate vehicle was involved in the study. This facilitated more real-world driving during object detection and recognition. Specific attention was paid to ensuring that the orders did not cause participants to expect or predict an upcoming object. The six orders were then treated as a block variable and held constant with order 1 always being presented first, order 2 presented second, and so on until all six orders were presented. The six VESs were counterbalanced using a balanced Latin square for each age group; therefore, each participant from an age group was assigned a unique VES presentation order, but all participants received the object presentation order sequentially from order 1 through order 6. Counterbalancing in this fashion reduced any systematic order biases that could have occurred for the VESs and age groups. An example is shown in table 1, where the first column, Order, indicates both the order in which the participant experienced the VES configurations and the object order that was presented for a given configuration; the objects tested are described in the Independent Variables section. The second column, VES, is the configuration that was tested. The third column, Vehicle, describes the vehicle that served as the platform for the VES.
INDEPENDENT VARIABLESVES configuration, age, and type of object were the independent variables used in the experiment. The age variable had three levels: younger participants (18 to 25 years), middle-aged participants (40 to 50 years), and older participants (65 years or older). These age groups were created based on literature review findings (ENV Volume II) that suggest changes in vision during certain ages. (See references 1, 2, 3, 4, and 5.) Each age group was made up of three males and three females. Gender was matched across age groups. Vision Enhancement SystemsThree IR VESs, two HID VESs, and one halogen VES were included in this study. The study used three types of SUVs because some VES systems were provided only on specific SUVs; the type of SUV never varied for a specific VES. Throughout this document, where an abbreviation is used to describe a VES (e.g., FIR), it refers to the system as well as the SUV type on which the system was tested. Note that there was an SUV 1 with an FIR system and SUV 1 with an NIR 2 system. These SUVs were not the same vehicle, but they were the same make, model, and year. The VES configurations (i.e., systems and vehicle types) for this study were defined as follows:
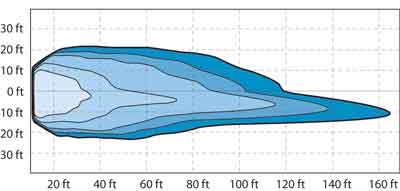
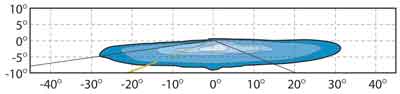
Participant eye positions for each VES can be found in appendix H. The following paragraphs further describe both the VESs and the vehicle platforms on which they were tested. FIR—Prototype Far Infrared Vision System on SUV 1A prototype FIR system was tested on SUV 1. The system display used a directly reflected virtual image with an 11.7° horizontal by 4° vertical field of view (FOV). The reflective mirror was located in an HHD position on centerline with the driver, directly on the instrument panel surface above the instrument cluster. The reported magnification at the eye was approximately 1:1. The headlamps used were the production halogen headlamps for this vehicle. NIR 1—Prototype Near Infrared Vision System 1 on SUV 2A prototype NIR system that used a laser IR emitter was tested on a second SUV (SUV 2). The system used a curved mirror display with an 18° horizontal by ~6° vertical FOV. The mirror was located in an HHD position on centerline with the driver, directly on the instrument panel surface above the instrument cluster. The reported minification was ~2:3 at the eye. The headlamps used were the production halogen headlamps for this vehicle. NIR 2—Prototype Near Infrared Vision System 2 on SUV 1A prototype NIR system that used halogen IR emitters was tested on SUV 1 (i.e., the same type of vehicle as the vehicle used for the FIR vehicle). The system display used a direct reflect virtual image with an 11.7° horizontal by 4° vertical FOV. The reflective mirror was located in an HHD position on centerline with the driver, directly on the instrument panel surface above the instrument cluster. The reported magnification at the eye was approximately 1:1. The headlamps used were the production halogen headlamps for this vehicle. HID 1—High Intensity Discharge 1 on SUV 3These HID headlamps were tested on a third type of SUV (SUV 3) using a light rack as described in the Apparatus and Materials section of this report. The headlamp beam profile (figure 1 and figure 2) was narrower than the beam profile of the other HID headlamp (i.e., HID 2) tested in the study. Figure 1. Diagram. Bird’s-eye view of beam pattern of HID 1.
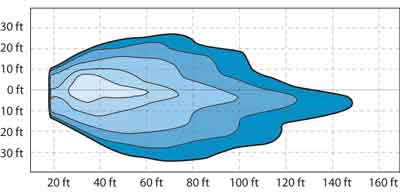
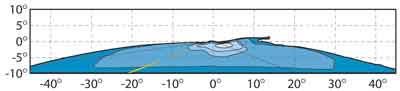
HID 2—High Intensity Discharge 2 on SUV 3A second type of HID headlamp was also tested on SUV 3 using a light rack as described in the Apparatus and Materials section of this report. These headlamps have a wider lighting footprint than the previously discussed HID 1. Figure 3 and figure 4 illustrate the beam pattern of HID 2. Figure 3. Diagram. Bird’s-eye view of beam pattern of HID 2.
HLB—Halogen Low Beam on SUV 3Halogen (i.e., tungsten-halogen) headlamps were tested on SUV 3 using a headlamp rack as described in the Apparatus and Materials section of this report. These headlamps were tested to provide a benchmark of headlamp performance and to provide a comparison point to previous studies. VES SummaryTable 2 shows the different VESs; the vehicles on which the VESs were tested; the headlamps on the vehicle; and where applicable, the display method, FOV, and image size. Specification of displays, display FOVs, and image sizes were provided by the system engineers responsible for the systems. ENV Volume XVII provides a more indepth look at the technical specifications of each VES.
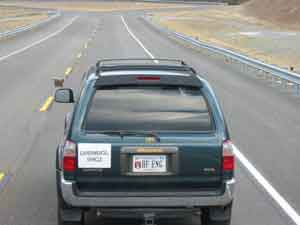
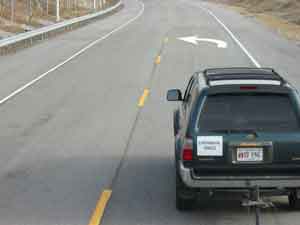
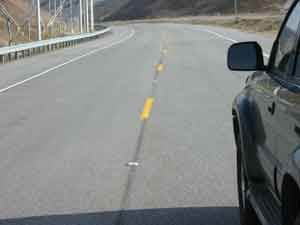
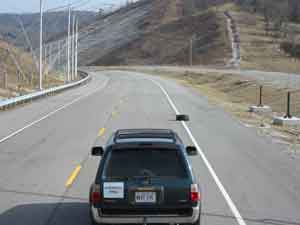
HLB headlamps are the most commonly available production VES; therefore, throughout this document, it is important to compare the results of other VESs to the results obtained for the HLB, thus making the HLB a baseline or benchmark measure. ObjectsUsing the six VESs, detection and recognition distances of 17 different objects were measured. The objects selected for this study were static pedestrians (whose scenarios included appearing on the right side, the left side, or in the center of the road, appearing in turns, appearing off axis, and appearing in bloom scenarios), retroreflective signs, pavement markers and pavement markings, and static objects (see table 3). They can be grouped into three sets: (1) pedestrians, (2) retroreflective objects, and (3) obstacles. Each of the objects is discussed in the following paragraphs. Additional details about the objects are provided in table 4, along with photographs of the objects (figure 5 through figure 21).
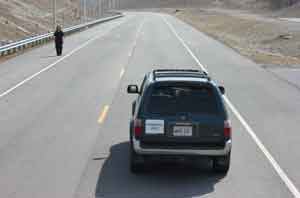
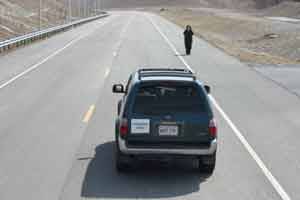
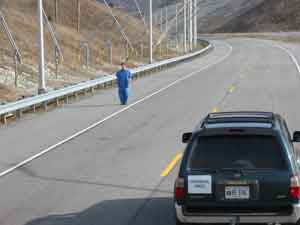
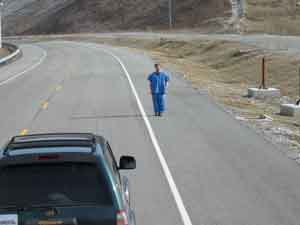
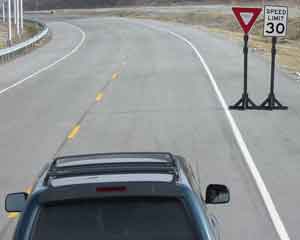
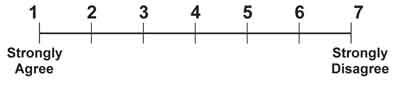
The main reason for including the pedestrians was because of the high crash fatality rates for these nonmotorists.(6,7) Although pedestrian mockups have been used in previous research of this type, actual pedestrians were used here to permit performance measurement of the FIR VES, which functions based on temperature characteristics of the object of interest.(8) Pedestrians were presented in several different positions in relation to the direction of the participant’s approach. Pedestrians were presented to the drivers at two different contrast levels: (1) with black clothing and (2) with blue denim clothing. Pedestrians in black clothing and denim clothing were presented on the straight segment of the road to permit this comparison. All other pedestrian scenarios used pedestrians dressed in denim. All the pedestrians were static and faced oncoming traffic. Their possible positions included the left and right shoulders of the road (relative to the driver), straight sections of the road, left and right curves of 1,250-m radius, and positions 9.5 m (31 ft) to the left and right (i.e., approximately 2.5 lane widths) of the centerline of the driver’s lane. The selected obstacles represented low contrast objects common in public roadways. A small stuffed dog was used to measure the VESs’ ability to provide earlier detection of animals present in the roadway. This improved capability potentially would facilitate an appropriate response from the driver to this situation. Resistive electrical elements were used inside the body of the dog to simulate the warm-bodied characteristics of animals. The tire tread was selected because of its potential for very low detection distances, which often lead to last minute object-avoidance maneuvers. Because it was used in previous research, the tire tread also provided a point of comparison to preceding research (ENV Volumes III and IV). Retroreflective devices were selected to duplicate those present on public roadways. Road signs, RRPMs, and a retroreflective pavement marking turn arrow were included in this study to provide a measure of the impact of the VESs on driver detection and recognition of these critical components of the nighttime driving scene. Performances of NIR in the presence of retroreflective materials, as well as the comparison of NIR to FIR systems with respect to retroreflective materials, were of particular interest to IR system designers, highway designers, and end users. An additional issue of interest was the interaction between emitted NIR, conventional retroreflective materials, NIR image processing, and the user. Two sign configurations were used during the study. In one configuration, a stop sign was presented next to a speed limit sign. In another configuration, a yield sign was presented next to a speed limit sign. By using these different sign configurations, it was possible to measure both when the signs could first be detected and when the different types and significance of the signs were recognized. The final object configuration of interest was the bloom scenario. This scenario was included to evaluate the possible improvements of new technologies over traditional technologies in the situation where a pedestrian has exited a vehicle with headlamps on (e.g., to change a tire). When viewed using traditional headlamp technology, the bloom scenario presents a pedestrian who is potentially veiled in the glare of the parked vehicle’s headlamps while the participant vehicle approaches. FIR and NIR vision systems could reveal pedestrians to the driver in these situations. Because of its reception of light in the visible spectrum and the design variables involved, performance of NIR systems in this scenario is particularly informative. Table 4, accompanied by figure 5 through figure 21, describes the objects used for the study as well as their locations; photographs in figures 5 through 21 were taken during daylight hours to demonstrate more clearly the appearance and position of the objects. Detailed descriptions of the objects appear in ENV Volume XVI. OBJECTIVE DEPENDENT VARIABLESTwo objective performance measures were collected for the VESs: (1) the distance at which a participant could first detect something in the road ahead and (2) the distance at which the participant could correctly recognize the object ahead. The participant was provided with a definition of detection: “Detection is when you can just tell that something is ahead of you. You cannot tell what the object is, but you know something is there.” Each participant was also given the definition of recognition: “Recognition is when you not only know something is there, but you also know what it is.” The method for determining detection and recognition distance measurements is described in the Apparatus and Materials section. SUBJECTIVE RATINGSParticipants were asked to indicate their agreement or disagreement with a series of eight statements for each VES, using a seven-point Likert-type scale. The two anchor points of the scale were 1 (indicating “Strongly Agree”) and 7 (indicating “Strongly Disagree”). The scale shown below (figure 22) was located on the instrument panel for the participant to refer to while responding to the statements. The statements were intended to address each participant’s perception of improved vision, safety, and comfort after experiencing a particular VES. Participants were asked to compare each VES to their regular headlights (i.e., the headlights on their own vehicles). The assumption was made that the participants’ own vehicles represented what they knew best and, therefore, were most comfortable using. The statements used for the questionnaire included the following (note that while the word “headlamp” is used throughout the ENV series, the subjective questionnaires posed to the participants used the synonymous word “headlight,” as reflected below):
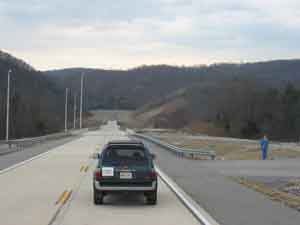
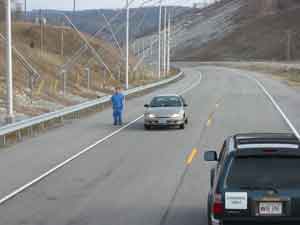
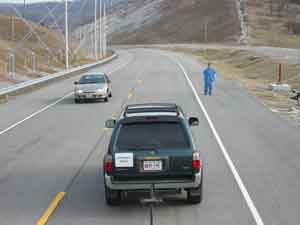
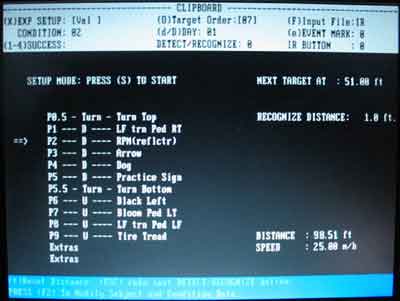
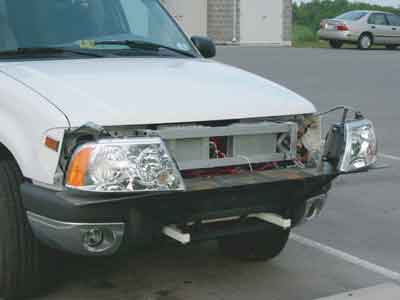
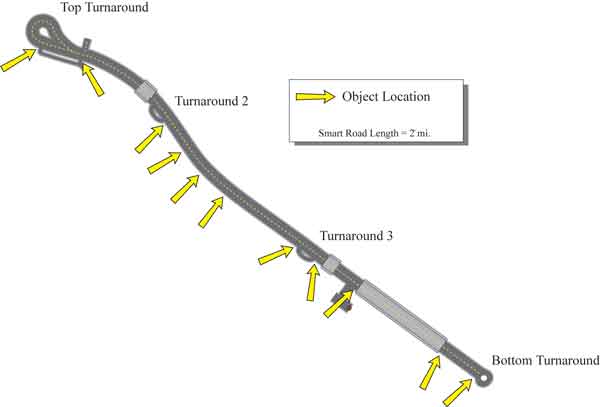
SAFETY PROCEDURESSafety procedures were implemented as part of the instrumented vehicle system. These procedures were employed to minimize possible risks to participants during the experiment. The safety measures required that: (1) all data collection equipment had to be mounted such that, to the greatest extent possible, it did not pose a hazard to the driver in any foreseeable instance; (2) participants had to wear the seatbelt restraint system anytime the car was on the road; (3) none of the data collection equipment could interfere with any part of the driver’s normal FOV; (4) a trained in-vehicle experimenter had to be in the vehicle at all times; and (5) an emergency protocol had to be established prior to testing. The participant was required to maintain 40 km/h (25 mi/h) during the drive. Two-way communications were maintained between the onroad crew and the in-vehicle experimenter to ensure that the onroad objects were ready and that the vehicle followed the expected path. Onroad pedestrians also visually monitored the approach of the participant vehicle and moved away from the lane boundary approximately 1.5 s before the vehicle reached them. APPARATUS AND MATERIALSOnroad driving was conducted using three types of SUVs. The vehicles were instrumented to collect distance information on a laptop computer using software specifically developed for this study. The software logged information such as the participant’s age, gender, and assigned identification number. In addition, it prompted the experimenter with the appropriate object order for each participant and VES trial. The software was also the basis for detection and recognition distance collection. Figure 23 shows the screen used by the experimenters to provide turnaround guidance, to monitor object presentation orders, and to collect data. Measurements of object detection and recognition distances were collected using two methods. When a participant detected an object, he or she would say the word “something.” Then, when the participant could recognize the object, he or she would provide a verbal recognition. At each of these utterances, the in-vehicle experimenter would press a button to flag the data. The in-vehicle experimenter also pressed a button when the front bumper of the vehicle passed the object. The data flags generated by these button presses provided one method for collecting the distance measures. In addition, as the participant vehicle passed an object, the onroad crew transmitted the number of the object over the radio. This transmission was also synchronized with the data stream. A video and audio recording of the participant verbally stating his or her detection and recognition, combined with the onroad crew’s transmission of the vehicle passing the object, provided a second method for identifying the distance measurements in the data stream. The participant was not able to hear the radio transmissions from onroad staff. The HID 1 headlamps, the HID 2 headlamps, and the HLB headlamps were mounted on a testing rack on the front of SUV 3 during testing as shown in figure 24 below. Smart RoadThe Virginia Smart Road was used for the onroad study. This roadway was designed according to United States Department of Transportation specifications for a two-lane undivided highway with a 104.7-km/h Figure 25. Diagram. Smart Road layout with object locations.
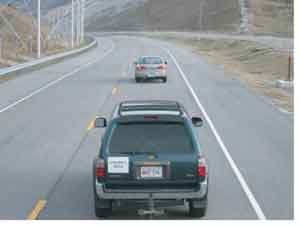
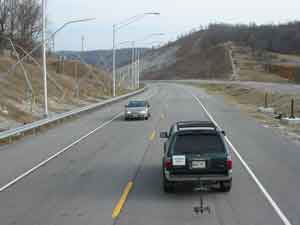
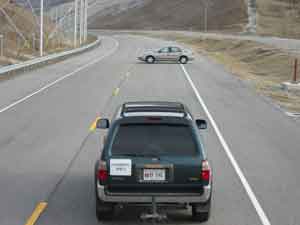
The participants started each drive from an intersection entering the Smart Road. One in-vehicle experimenter was assigned to each participant; this experimenter was responsible for driving the participant to the first vehicle, showing the participant the location of the different controls, and verifying that the right VES configuration was being tested. Five onroad experimenters were present to position objects, stand as pedestrians, drive confederate vehicles, and shuttle other onroad experimenters to different object locations during the session. A sixth onroad experimenter was responsible for presenting certain objects, preparing the next vehicle for the participant, and making measurements of the participant’s eye position and dimmer settings. Four paved turnaround areas on the road were used (top turnaround, turnaround 2, turnaround 3, and bottom turnaround) to vary the sequence in which a participant traversed the different segments of the road during the drive. Of the 33 possible locations, a subset of 17 was used for each vehicle. Object presentation is discussed in the General Onroad Procedure section of the Experimental Procedure. Headlamp and IR System AimingThe headlamps used for the HLB, HID 1, and HID 2 configurations were mounted on a testing rack that was external to the experimental vehicle. This mounting allowed the three different headlamps to be swapped on a single vehicle for each night of testing. An aiming procedure was developed to ensure that the headlamp condition was the same after every swap. The procedure was the same for all of the ENV testing and was developed at the beginning of the ENV project. In this investigation, the HLB headlamps were aimed as they were in the Phase II studies. During the photometric characterization of the headlamps, it was discovered that the position of the maximum intensity location of the HLB was aimed higher and more towards the left than typically specified. This aiming deviation likely increased detection and recognition distances for the HLB configuration. Details about the aiming procedure and the maximum intensity location are discussed in ENV Volume XVII, Characterization of Experimental Vision Enhancement Systems. The HID 1 and HID 2 headlamps were visually optically aligned (VOA) systems. For these, the aiming points were selected based on the SAE requirements according to the height of the headlamps as mounted on the testing rack. For more information on the aiming of these headlamps refer to ENV Volume XVII, Characterization of Experimental Vision Enhancement Systems. It should be noted that the headlamp height and approximate eye height were kept constant across the HLB, HID 1, and HID 2 VESs. Headlamp mounting height and driver seating position would be different in production for HID 1 and HID 2 since these VESs would be on a sedan, not an SUV. However, the testing method held constant (within intra-participant variability) the headlamp-to-eye angle and eye height for all three headlamp VESs. Each light assembly transfer required a re-aiming process. The headlamps on the FIR vehicle, NIR 2 vehicle, and the NIR 1 vehicle were production headlamps. These headlamps were aimed prior to the study and did not require further aiming during the study. The IR systems on these vehicles were checked for aiming of cameras and IR emitters according to the procedures provided by the system manufacturers. When necessary, the aiming was further confirmed by comparing IR system images collected at the start of the study to new system images. The NIR 2 vehicle was the only IR system that required re-aiming during testing because adhesive tape used on the provided prototype system became unfastened between experimental sessions. EXPERIMENTAL PROCEDUREParticipant ScreeningParticipants were initially screened over the telephone (appendix A), and if a participant qualified for the study, a time was scheduled for testing. Participants were instructed to meet the experimenter at the testing facility in Blacksburg, VA. After arriving, an overview of the study was presented to each participant. Subsequently, each participant was asked to complete the informed consent form (appendix B) and to take an informal vision test for acuity using a Snellen chart and a contrast sensitivity test (appendix C). The vision tests were performed to ensure that all participants had at least 20/40 vision as well as to identify any type of vision disparity that might have influenced the results. After these steps were completed and if no problems were identified, the participant was taken through a set of measurements and predrive questionnaires. Participants were tested for color blindness using pseudo isochromatic plates, but they were not excluded based on the results (appendix C). The participant’s standing height was also measured. The participant then completed a predrive questionnaire (appendix D) that documented frequency of night driving, any difficulties with overhead or oncoming vehicle lighting and weather, and any other concerns. The participant’s own vehicle and eyewear used for night driving were also recorded. Once these steps were completed, the participant began the training portion of the session. TrainingOn the first night, each participant was given an overview of the study and trained on how each of the sessions would be conducted. The participant was provided with a definition of detection: “Detection is when you can just tell that something is ahead of you. You cannot tell what the object is, but you know something is there.” The participant was also given the definition of recognition: “Recognition is when you not only know something is there, but you also know what it is.” The participant was instructed to say the word “something” when able to detect an object and to say what it was when able to recognize it. Daytime photographs, similar to those in table 4, were shown of each of the objects the participant would be exposed to during the drive. The participant was then shown the questionnaire that would be administered after each vehicle was driven. The in-vehicle questionnaire included the eight 7-point Likert-type scale statements described previously, which investigated the participants’ perception of the VES’s performance as compared to their normal headlamps. Each statement was read aloud, and the scale was reviewed. Two open-ended questions were also reviewed. If there were no questions from the participant, the training was completed. Vehicle FamiliarizationNext, the experimenter drove the participant to the Smart Road, where the first test vehicle was waiting. For each vehicle, the experimenter helped the participant adjust the seat, steering wheel, and instrument panel lighting. Where an in-vehicle display was present, the experimenter assisted the participant in achieving a clear view of the image and showed how to adjust the brightness of the display. The participant was permitted to adjust the instrument panel and display brightness three times: once before driving, once halfway through the practice drive, and once at the end of the practice drive. The brightness settings were then kept the same for the remainder of the drive. The interested reader may refer to appendix E for a brief analysis of these brightness settings. When ready, the participant’s eye position was measured in relation to landmarks on the door (appendix H). The participant was then asked to look at various locations in and around the vehicle while saying the location aloud. Where a display was present in the vehicle, the participant was told: “This system is not intended to be used alone. Instead, it is supposed to accompany your normal driving. Be sure to view the road as you normally do while also using the display.” Driving and Practice LapThe participant was then asked to drive a practice lap to familiarize him or her with the vehicle, the objects, the road, and the procedure for calling out objects. This practice lap was performed at the start of the driving portion for each vehicle. The in-vehicle experimenter rode in the second-row, passenger-side seat of the vehicle. The participants were reminded of the procedure and were instructed not to drive faster than 40 km/h (25 mi/h) during the study. To help the participant learn the test objects during the practice drive, the experimenter indicated to the participant what the next practice object would be. The experimenter also pointed out objects on the road that would not be necessary to recognize (e.g., guardrails, cement blocks, reflector). At the end of the practice drive, the experimenter reviewed the questionnaire with the participant and gave a final opportunity to adjust the IR display’s brightness settings. Once this practice was completed, the participant began the test drive. During the test drive, the in-vehicle experimenter configured and monitored the data collection system, recorded when the participant detected and recognized objects, gave guidance on where to turn around, checked speed, and advised the participant to maintain the 40 km/h (25 mi/h) speed limit, if necessary. Driving time in each vehicle was approximately 1 h. General Onroad ProcedureWhile the participant drove on the practice drive and the test drive, an onroad crew was responsible for presenting objects at different locations along the Smart Road according to the object order assigned to the participant for the VES being driven. An onroad experimenter also transmitted the object number as the front bumper of the participant vehicle passed the object. Different turnarounds on the road were used to reverse direction, and different object locations were used on the road to produce six different object and route orders. Within this variation, object locations were frequently passed by the participant without an object being present. The participant had a different object order for each of the six vehicles driven. Four confederate vehicle events occurred during each of the six VES drives. These events were included in the object orders to ensure consistent and balanced exposure, which was unpredictable to the participant. Table 5 provides descriptions and illustrations of the four confederate vehicle events. These events were included to encourage the participant to expect other vehicles on the road, to allow the participant to observe other vehicles with the VES, and to add credibility to the bloom scenario. DATA ANALYSISBecause of the large number of objects tested, the first analysis combined the tested objects into three groups: pedestrians, retroreflective objects, and obstacles. The first group consisted of all the pedestrians, including the bloom scenarios, both black-clothed and denim-clothed pedestrians, pedestrians in turns, and far off axis pedestrians. The retroreflective object group included the turn arrow, the RRPMs, and the signs. The third object group included the dog and the tire tread. These two objects were both smaller, low contrast objects that extended into the lane of the participant vehicle. Table 6 identifies the grouping of the objects for this analysis.
This grouping generated a statistical model for this analysis that was a 6 (VES) by 3 (Object Group) by 3 (Age) mixed factorial design. Where significance was found for an object group, which occurred for all three groups, subsequent statistical models were used to identify the specific objects and VESs creating the differences within each group. This analysis required statistical models for each object group, as listed below:
By analyzing the data with these groupings, more detailed information about the independent variables could be determined. For example, the first analysis for the object group identified what general type of object a VES did well with. The second analysis determined if there were differences within an object group for the VESs. For example, did a VES do better with some pedestrian locations than others? In each of these models where main effects were found, Student-Newman-Keuls (SNK) tests were used to identify differences between VESs or age groups. The Likert-type scale ratings from the post-drive questionnaires were analyzed using two-way ANOVAs to test the effects of VES and age as well as their interaction. Where main effects were found, SNK tests were also used to identify statistical differences between the VESs for each of the objects. Responses to open-ended questions were reviewed and tallied to identify emergent themes in the responses. For the Bloom Left, Blue Left, and Blue Right objects, the available sight distance may have restricted the maximum achievable measured detection distance for the FIR vehicle. Investigation of the measured detection distance values indicated that the effect of this possible restriction on the system’s mean values would be minimal, so values were maintained as measured. In fact, the FIR statistically outperformed the other VESs for these objects even with the possible limitation.
|