U.S. Department of Transportation
Federal Highway Administration
1200 New Jersey Avenue, SE
Washington, DC 20590
202-366-4000
Federal Highway Administration Research and Technology
Coordinating, Developing, and Delivering Highway Transportation Innovations
 |
| This report is an archived publication and may contain dated technical, contact, and link information |
|
Publication Number: FHWA-HRT-04-147
Date: December 2005 |
|||||||||||||||||||||||||||||||||||||||||||||||||||||||||||||||||||||||||||||||||||||||||||||||||||||||||||||||||||||||||||||||||||||||||||||||||||||||||||||||||||||||||||||||||||||||||||||||||||||||||||||||||||||||||||||||||||||||||||||
Enhanced Night Visibility Series, Volume XVI: Phase III—Characterization of Experimental ObjectsPDF Version (1.07 MB)
PDF files can be viewed with the Acrobat® Reader® CHAPTER 3—RESULTSThe results of this object characterization activity include several data comparisons that address visibility and photometric data acquired at the detection and recognition distances for all objects under all VES types. It is important to note again that the IR systems cannot be analyzed photometrically because their results are not directly visually based, but instead they are perceived in an electronic imaging system; however, the photometric data can indicate use of the system for object detection. The results are presented in terms of luminance, background luminance, contrast, and visibility level for the visible conditions followed by an assessment of the IR system usage. Finally, the age analysis is presented. VISIBLE SYSTEMS SUMMARY OF IR CLEAR RESULTSTable 6 summarizes the VIS system results from the IR Clear study.
In general, the HLB headlamps provided the longest detection and recognition distances, and the HID 2 headlamps provided the shortest distances of the three VIS systems tested. PHOTOMETRIC ANALYSISThe photometric data from the visible-light sources (i.e., HID 1, HID 2, and HLB headlamps) are presented in terms of the pedestrian, retroreflective, and obstacle object types. The first consideration was the comparison of the data for the detection and recognition distances. This was followed by a consideration of each of the data types. It should be noted that in the visibility level analysis, only the modeled results for the older drivers from the IR Clear study were presented because the relationships between each VES performance would be similar regardless of the age of the observer. Comparison of Detection and Recognition ValuesDuring the IR Clear study, the participants were asked to identify when they first detected the object and then when they recognized it. The photometry of the objects was performed at the mean distance for both of these conditions. During the experiment, several participants reported simultaneous detection and recognition. To investigate this, a comparison of the photometric data for both the detection and recognition characterizations was performed. This allowed for the quantification of the difference between the lighting requirements for detection and recognition. To identify this difference, a Pearson r-correlation analysis was performed between the data for detection and the data for recognition. This comparison was performed for each of the object types and data types. Table 7 shows the results of this comparison. It can be seen that a relatively high correlation exists between the data values for detection and recognition.
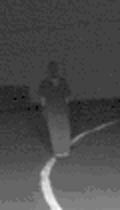
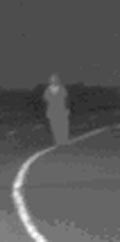
The comparison of the luminance of the pedestrian objects is shown in figure 34. It can be seen that with a few exceptions, the values for detection and recognition are very similar. A comparison of the standard error shows that in most cases there is no statistical difference between these values.  Figure 34. Bar graph. Comparison of object luminance at detection and recognition of pedestrian objects. Figure 35 shows the luminance comparison for the retroreflective objects, and figure 36 shows the comparison for the obstacle objects. It can be seen that the same trend exists for both of these object types. These results imply that in general, there is no difference between the lighting required for detection and recognition of the objects included in this investigation. Based on this finding, only the detection results will be given further consideration in the photometric analysis.  Figure 35. Bar graph. Comparison of object luminance at detection and recognition of retroreflective objects.  Figure 36. Bar graph. Comparison of object luminance at detection and recognition of obstacle objects. Pedestrian Object GroupThe analysis of the pedestrian object group included the 3 VIS headlamps and all 12 pedestrian object scenarios. These involved pedestrians standing at different locations, facing the vehicle, and wearing black or denim clothing. The means of their luminance, background luminance, contrast, and visibility level results are presented with standard error bars. The exceptions are the objects appearing far off axis and objects in curves; these appeared at only one location, so no standard error value is available. VIS Headlamp and Pedestrian Object Effect on LuminanceThe effect of the pedestrian object types on the object luminance at detection for VIS headlamps is shown in figure 37. In this figure, it can be seen that the two bloom objects both required the highest luminance for detection. It would be expected that higher luminance is required to overcome the disability glare of the headlamps. The Bloom Left object had a higher luminance at detection than the Bloom Right object, indicating that closer proximity to the glare source results in a higher level of disability glare.  Figure 37. Bar graph. Mean luminance values at pedestrian object detection. The other interesting aspect of this comparison is that in general, the HID 1 system required lower luminance for detection than the HID 2 system, which has a generally lower luminance than the HLB system. This was the case for all objects except those that were far off axis or on the left. In these cases, the luminance provided by the HID 2 system was very low. These headlamps have a wider beam distribution, leading to the expectation that the luminance provided to the side would be higher than the other configurations. One of the issues with this comparison is that all of these measurements were taken at the mean detection distance. One would expect that, with the exception of the bloom condition, a similar luminance would be required for detection of any of the pedestrian objects. As the vehicle approached, detection would occur when the required luminance was achieved; however, the pedestrian objects did not have a consistent threshold luminance value. This is particularly noticeable when comparing the threshold luminance value for a given object when it is on the left versus on the right. Regardless of lateral position, the object should have a similar size and, therefore, a similar required luminance. This means that object luminance is a poor indicator of object visibility. Other factors, such as the background or displacement from the driver’s line of sight, may come into play in this detection and recognition task. VIS Headlamp and Pedestrian Object Effect on Background LuminanceThe effect of the headlamp type on the background luminance for the various experimental objects is shown in figure 38, where it can be seen that the background provided by each of the headlamps is similar for most objects. Significant differences can be seen only in the far off-axis conditions, where the HID 2 system provided a very low background luminance. It should be noted that although this system had the widest beam pattern, it also had the lowest detection distance (27.1 m or 89 ft), meaning that the angular eccentricity of the object likely put it outside the beam of the headlamps.  Figure 38. Bar graph. Mean background luminance values at pedestrian object detection. In this relationship, the Bloom Right was observed with a relatively high mean background luminance level as compared to the other objects. When measuring background luminance in these instances, the bloom vehicle headlamps were not turned on and the pedestrian was on the opposite side of the road from the vehicle. In this instance, objects behind the pedestrian such as guardrails and roadway infrastructure would increase the background luminance. Because a high standard error is associated with the measurement, it can be expected that the various locations where the object appeared would contribute to this high background luminance value. VIS Headlamp and Pedestrian Object Effect on ContrastFor the headlamp and pedestrian type relationship, the contrast was measured at the point of detection, which implies that this was the actual threshold contrast for the object. It would be expected that the threshold would be similar for all of the pedestrian objects presented because the size of the objects was similar. The exceptions to this expectation are the bloom scenarios, where a higher contrast was needed to overcome the glare, and in the off-axis and curve scenarios, where the object was eccentric to the line of sight. The effect of the visible headlamp type and the pedestrian type on the contrast is shown in figure 39. The figure shows the higher contrast for the off-axis and the bloom scenarios, as expected. The item to notice is that in the Black Left, Black Right, Blue Left, and Blue Right object conditions, the HLB headlamps had the highest threshold contrast. For the black-clothed objects, the HID 1 system had the lowest threshold contrast, with the black-clothed left pedestrian having a negative contrast level.  Figure 39. Bar graph. Mean contrast values at pedestrian object detection. It is also noteworthy that the contrast for the off-axis objects for the HID 2 system was similar to that of the HLB system. This indicates that as the vehicle approached the object, the required threshold contrast was not met until the very short distance found in the IR Clear study. VIS Headlamp and Pedestrian Object Effect on Visibility LevelAs with the contrast calculation, the threshold visibility level should be similar across all of the pedestrian objects and VIS system types. Again, a slight increase in threshold visibility level for the bloom, off-axis, and curve pedestrian objects would be expected. The results of this calculation for all of the pedestrian and visible headlamp types are shown in figure 40.  Figure 40. Bar graph. Older driver mean visibility levels at pedestrian object detection. The consistency of the values seen in the contrast calculation is not evident in the visibility level calculation. The increase for the bloom and the off-axis conditions is seen, but the black-clothed pedestrian and the blue-clothed pedestrian had different visibility level values. For the blue-clothed objects, the HLB system provided a higher visibility level at threshold than did the HID 1 and HID 2 systems. In general, many of the objects had a high standard error associated with the measurement, so many large differences existed, but they were not statistically significant. One of the reasons for the dissimilarity in visibility level across the types of headlamps might be the object size. The visibility level accounts for the object size and the vehicle headlamp cutoff. Both of the HID systems had a cutoff-style headlamp that cut the beam pattern in a sharp line, permitting very little light above it. The HLB system did not have this cutoff, and because of an anomaly in the aiming method used, there was significant light aimed straight down the roadway. This means that a tall object would have been more consistently illuminated by the HLB headlamps than by the cutoff HID headlamps. As a vehicle with cutoff headlamps approached an object in the roadway, the lower part of the object would have been illuminated first, and then the lighted area would have moved up the body as the headlamps approached, making more of the object visible below the cutoff line. For example, figure 41 shows the pedestrian in a right turn, right side in the HID 2 condition, and figure 42 shows the pedestrian in a right turn, right side in the HLB condition. The unevenness of the luminance in the HID 2 condition shows the influence of the cutoff line. (Note that the photometric detector captured these images at long distances, so some granualization of the images has occurred.)
In the visibility level calculation, the entire object size was used, and it was assumed that the object was evenly illuminated; however, the case just described might lead to discrepancies in the evaluation of the visibility level of the object. VIS Headlamp and Obstacle Object Group AnalysisThe next set of results is from the analysis of the obstacle object group, which consists of the tire tread and the simulated dog. They represent roadway objects typically smaller in size than a pedestrian. Like the pedestrians, the analysis of this object group is based on the comparison of the means of the luminance, background luminance, contrast, and visibility level. VIS Headlamp and Obstacle Object Effect on LuminanceFigure 43 shows the luminance of the two obstacle objects at the threshold distance. In both cases, the HID 2 headlamps provided a higher luminance at threshold than either the HLB or the HID 1 headlamps. The dog was located on the centerline of the road, and the tire tread was placed on the edgeline. Because the HID 2 system had the widest beam pattern, it is likely that these objects were illuminated at a higher level by the HID 2 system than by the other lighting systems. It also must be remembered that the HID 2 system produced the shortest detection distances for the three visual VESs.  Figure 43. Bar graph. Mean luminance values at obstacle object detection. As with the pedestrian objects, the luminance does not provide a consistent threshold value. This means that the luminance is not a reliable measure of visibility. VIS Headlamp and Obstacle Object Effect on Background LuminanceFigure 44 presents the effects of VIS headlamp and obstacle object for the background luminance levels of each obstacle object. Because both of these objects were low and close to the road surface, the measured luminance was primarily the luminance of the pavement.  Figure 44. Bar graph. Mean background luminance values at obstacle object detection. As in the object luminance comparison, the HID 2 headlamps had the highest background luminance, followed by the HLB and HID 1 headlamps. There was no significant difference between the HID 1 and HLB systems, but the HID 2 system was significantly different. Again, this was likely a result of the HID 2 system producing the shortest detection and recognition distances. VIS Headlamp and Obstacle Object Effect on ContrastThe contrast relationship for the obstacle objects are presented in figure 45. It is noteworthy that the tire tread, which was black with a very low reflectance, had negative contrast, which means that the object is darker than the background. The dog was gray and was brighter than the pavement surrounding it. From the analysis of the standard error, no significant difference exists between the HID 1 and HID 2 systems for either the dog or the tire tread. The HLB system does show a significant difference from the other two headlamp systems.  Figure 45. Bar graph. Mean contrast values at obstacle object detection. Table 6 also shows that the HLB system was associated with the maximum detection and recognition distances of the VIS systems for both the dog and tire objects. The HLB system’s superior performance over the other systems is also indicated by its higher contrast at threshold. VIS Headlamp and Obstacle Object Effect on Visibility LevelThe effects of VIS headlamp and obstacle object on visibility level are shown in figure 46. In this calculation, as with the pedestrian objects, a similar threshold visibility level value would be expected for all of the objects and VESs, and indeed, there was no significant difference between the HID 1 and HID 2 systems for the simulated dog object. On the other hand, the HLB system produced the highest threshold visibility level. For the tire tread object, there was no significant difference between the HID 1 and the HLB system, with the HID 2 system having a higher threshold visibility level than the others, although it was not significantly different from the HLB system.  Figure 46. Bar graph. Older driver mean visibility levels at obstacle object detection. The dog’s highest visibility level was produced by the HLB headlamps, which suggests that the HLB headlamps allowed earlier detection of the dog compared to the other headlamps tested. At the shortest detection distance, the HID 2 headlamps did not produce a large difference in visibility levels. The difference between the performance of the HID 2 system for the dog and for the tire likely resulted from the beam pattern. The HID 2 system has the widest beam pattern, and it will light an object on the right-hand side of the road more effectively than one in the center of the road. The opposite occurs for the HLB system, which produced a higher visibility level with the dog than with the tire tread. This is likely because the aim of the HLB headlamps is pointed more toward the center of the road than to the right edge. The similar visibility level of the HID 1 and HID 2 system for the dog is expected, and this represents the threshold value for these objects, which do not have the size issues that are evident with the pedestrian objects. VIS Headlamp and Retroreflective Object Group AnalysisThis analysis examined the retroreflective objects, which are designed to reflect light back to the light source rather than reflect diffusely, as the pedestrians and the obstacle objects do. The retroreflective objects included the turn arrow, the raised retroreflective pavement marker, and the two sign configurations. The IR Clear study included two additional recognition tasks: differentiating between 30- or 55-mi/h speed limit signs, which required participants to read the speed limit, and recognizing the difference between a stop and a yield sign. The object characterization results for all the retroreflective objects were analyzed for both detection and recognition. It should be noted that because of the long distances at which these were seen, the resulting visual size was very small, and these measurements have a high uncertainty associated with them because it is extremely difficult to measure a small light source with a CCD camera. VIS Headlamp and Retroreflective Object Effect on LuminanceThe objects in the retroreflective group had much longer detection distances than did the other objects. It should be noted that these distances are so long that they normally would be considered outside of the reach of the vehicle headlamps. Figure 47 shows the results of these measurements. No significant difference resulted between headlamp types for the turn arrow, which lay flat on the road surface; each headlamp performed equally well in this situation. No significant difference resulted between the two HID systems for the RRPM, which also lay on the roadway, but the HLB system provided a much lower luminance. Conversely, the results for the two sign detection tasks showed the HLB system provided a much higher luminance than the HID systems.  Figure 47. Bar graph. Mean luminance values at retroreflective object detection. The geometry and aiming of the headlamps is critical for this measurement. Because the HID headlamp beam profiles had a cutoff and the HLB headlamp beam profiles did not, the HLB headlamps provided a higher illuminance on the signs, resulting in a higher luminance level than did the HID headlamps; however, it is not clear why the RRPMs were lit to a higher level by the HID systems than by the HLB system. This may be a result of the beam distribution of the HID headlamps lighting the roadway centerline area more effectively than the HLB headlamps; these VES types may have equivalent performance in the center of the driving lane directly in front of the driver. The results for the recognition task are shown in figure 48. In this instance, the luminance of the 30- or 55 mi/h speed limit signs at the recognition distance is significantly higher than that of the other objects at recognition. The speed limit sign scenario also had the shortest recognition distance, approximately 122.2 m (401 ft) compared to 277.2 m (854.7 ft) for the stop and yield sign recognition task. For this task, the participant had to read the black numbers on the road sign and could not rely on recognizing the sign by shape alone. Thus the legibility distance for the speed limit sign was shorter than the recognition distance for stop and yield signs, and therefore, a higher luminance was measured. The HID 2 system did not perform as well as the other systems in the sign scenarios. According to table 6, the HID 2 VES yielded the shortest recognition distance. This implies that the HID 2 system did not provide the same level of illuminance on the signs as did the other two VESs.  Figure 48. Bar graph. Mean luminance values at retroreflective object recognition. VIS Headlamp and Retroreflective Object Effect on Background LuminanceThe results of the background luminance measurements at detection of the retroreflective objects are shown in figure 49. The backgrounds for these objects were different. For the turn arrow and the RRPM, the background was pavement; for the signs, the background was landscape and foliage. In this measurement set, the HID systems did not produce significantly different background luminances for the RRPM and the sign scenarios. The HID 1 system did provide a higher pavement luminance than the HID 2 system for the turn arrow. The HLB system, performed similarly to the HID systems for the turn arrow and the RRPM. The illuminance from the non-cutoff, high-aimed HLB system produced a higher background luminance for the signs than either of the HID systems because of the cutoff associated with the HID beam patterns. A high standard error was associated with the sign background measurements, which indicates the high variability of the background based on sign position.  Figure 49. Bar graph. Mean background luminance values at retroreflective object detection. The background luminance measurements for the retroreflective object recognition task are shown in figure 50. Of interest in this figure are the measurements for recognition of the 30- and 55 mi/h signs and the recognition of the stop and yield signs. For both of these conditions, the distance to the object was much shorter than that of the detection tasks. The same trend as in the detection task is apparent on the signs: the HID systems had similar performance, and the HLB system provided a higher luminance level. The cutoff of the HID headlamps reduced the background luminance. There was also a high standard error associated with these measurements, demonstrating the importance of the object position.  Figure 50. Bar graph. Mean background luminance values at retroreflective object recognition. VES Headlamp and Retroreflective Object Effect on ContrastThe contrast calculations were performed for all of the retroreflective objects. These results are shown in figure 51. For the turn arrow, the threshold contrast was very low as compared to the other retroreflective objects. This resulted from the low object luminance and the higher background luminance. Similarly for the RRPM, the low background luminance and higher object luminance led to a higher contrast. In this case, the HID 1 system had the highest threshold contrast, followed by the HID 2 and HLB systems. This result might indicate that the HID systems were more effective at lighting the object and did not light the pavement as well, thus allowing the RRPM to have a higher contrast than the other objects. Finally, the HLB system provided the highest contrast for the signs, but it was not significantly different than the HID 1 system. The HID 2 system continued to provide the lowest contrast of all three of the sources. Again, this is indicative of the aiming and cutoff differences between the headlamp beam patterns.  Figure 51. Bar graph. Mean contrast values at retroreflective object detection. Figure 52 shows the recognition task results for the retroreflective objects. Here again, the 30- and 55 mi/h speed limit sign recognition required the highest threshold contrast, and again the HID 2 system provided the lowest contrast with the shortest recognition distance. This trend is apparent with all of the objects. The recognition task of differentiating between the stop and yield signs produced contrast values similar to that of the initial sign recognition task.  Figure 52. Bar graph. Mean contrast values at retroreflective object recognition. VIS Headlamp and Retroreflective Object Effect on Visibility LevelAs with the other object types, the visibility level would be expected to have a consistent threshold for all of the objects. As seen in figure 53, the results for the turn arrow and RRPM had a very similar visibility level for all headlamp types as compared to the results for the signs. For the signs, the HLB system provided the highest visibility level, which was significantly different than the results for the HID systems. Again, this probably resulted from the cutoff and aim of the HLB system. As with the other variables, the HID 2 system continued to provide the lowest visibility level of all of the tested systems.  Figure 53. Bar graph. Older driver mean visibility levels at retroreflective object detection. Figure 54 shows the visibility level for the recognition task. The 30- and 55 mi/h speed limit sign recognition task by far dominates this comparison. The same trend is evident: the HLB system provided the highest visibility level followed by the HID 1 system, and the HID 2 system provided the lowest visibility level.  Figure 54. Bar graph. Older driver mean visibility levels at retroreflective object recognition. One of the difficulties with this comparison is the identification of the visual task. For the calculations, the entire sign was used as the size of the object. For the two sign scenarios, the critical aspects for the recognition tasks were very different; for the two speed limit signs it was the ability to recognize the black letters on the white background, while for yield and stop signs it was the recognition of the triangular shape of a yield sign as compared to the octagonal shape of a stop sign. To effectively use the visibility level for defining human performance, a better definition of the visual task is required. Photometric Analysis SummaryThe performance of the headlamps can be evaluated through photometric analysis. For all of the objects, the HID 2 system provided the lowest measures of photometric performance, even though it had the shortest measurement distances. The beam pattern of the headlamps influenced the results for many of the objects, especially the signs, tire, and dog. The headlamp beam cutoff limited the visibility of the pedestrians by providing uneven luminance as the vehicle approached. IR SYSTEM USAGEThe photometric information is useful in determining when an IR system appears to be used by the driver for object detection. The following photometric analysis compares the results for the various VESs that incorporated an IR system to the results for the VESs that were visual headlamps only, using object visibility level. If the visibility level of an object at detection by an IR system was less than the visibility level required for detection by the visual VESs, then it was assumed that the IR system’s display was used to detect the object. The visibility level was chosen for this comparison because it is a model that represents the VESs. There are difficulties with the visibility model as discussed earlier, but these difficulties are limited to each of the objects; therefore, the comparison is believed to be valid. As with the review of the photometric data, this comparison was performed by object group, and it included all of the objects. Only the detection values were considered, except for the recognition of the 30- and 55 mi/h signs and the stop and yield signs. To assist in the discussions, table 8 outlines the performance of the IR systems in the IR Clear study.
IR System Usage for Pedestrian ObjectsThe pedestrian object group included 12 different pedestrian objects. Results of the comparison for this object group are shown in figure 55. For this group, the visibility level of each of the IR systems is significantly lower than that of the VIS systems for every object except the left turn pedestrian on the left. For most objects with IR systems, the visibility level is less than 1, indicating that the actual contrast was below the threshold contrast and that the object was not visually detectable by the participant.  Figure 55. Bar graph. Comparison of older driver mean visibility levels at pedestrian object detection with the IR system versus the VIS systems. For the left turn left pedestrian, the visibility level at detection with NIR 2 and FIR was higher than with VIS systems, indicating that the NIR 2 and FIR displays did not provide a benefit and were likely not used in this scenario. The visibility level with the NIR 1 system, however, indicates that participants did use this system for detection of the left turn left pedestrian, resulting in longer detection and recognition distances (see table 7). This may have been because of the wider FOV of the NIR 1 display compared to FIR and NIR 2 displays. The expectation is that the threshold visibility level for an IR system that was not used would be similar to the VIS system performance; however, the threshold visibility level for the FIR and NIR 2 systems was significantly different from that of the VIS systems, indicating that the presence of the IR system distracted the driver and required the object to be significantly brighter to draw attention. IR System Usage for Obstacle ObjectsThe obstacle object group for the IR experiments included the dog and tire. The comparison of the visibility level results is shown in figure 56. In this case, it appears that the FIR system probably was used to detect the dog, but the two NIR systems were not. Conversely, the two NIR systems appeared to have been used for the tire tread, but the FIR system was not.  Figure 56. Bar graph. Comparison of older driver mean visibility levels at obstacle object detection with the IR systems versus the VIS systems. Figure 56 shows that the FIR system was used at all stations to detect the dog, suggesting that the FIR system allowed earlier detection of the dog. Because the dog was heated, it was thermally different than the ambient air, which would have made it detectable with the FIR system. Neither NIR system was used to detect the dog, which was very small compared to a pedestrian. Its size may have made it difficult to see in the NIR displays. The size is less of an issue for the FIR system because the dog’s thermal system heated not only the dog but also the atmosphere around it, increasing the effective size of the object in the display. Results indicate participants did not use the FIR system when approaching the tire tread, but they did use the NIR systems. As mentioned, the FIR system relies on a thermal difference between the object and its surrounding environment for detection. Because the tire tread was unheated, it did not provide a thermal difference, and therefore, it was not detectable with the FIR system. For this object, as with the left turn pedestrian object, the system was a distraction, as was indicated by the object’s higher visibility level at detection with FIR than with the VIS systems. IR System Usage for Retroreflective ObjectsThe retroreflective object group included four different roadway markings and signs. In addition, there were the tasks of recognizing the numbers on the speed limit signs and differentiating between the stop and yield signs. The comparisons of system performances for this object group are shown in figure 57. From this comparison, it is apparent that participants did not use the IR systems for detecting the turn arrow or the RRPM. It appears that for detection of the two signs, participants used the FIR and NIR 2 systems, but not the NIR 1 system.  Figure 57. Bar graph. Comparison of older driver mean visibility levels at retroreflective object detection with the IR systems versus the VIS systems. Signs are designed to reflect visible light back in the direction of the light source. As a vehicle approaches a sign, the light from the headlamps is reflected back even from very long distances, allowing the driver to detect the sign at those long distances. With the two NIR systems, two different emitters were used to provide the IR emission to the roadway. NIR 1 used a laser, which may not be reflected back as efficiently as the broadband emitters used by the NIR 2 system. The NIR 2 emitters provide wavelengths closer to the visual spectrum, and the signs’ retroreflective performance may be more efficient at this wavelength range than that of the laser used by NIR 1. This may explain the use of NIR 2 in detection of the signs and the apparent disuse of NIR 1 for this task. The use of FIR in this scenario might be explained by the temperature gradient of the signs during the IR experiments. The metal signs had a lower thermal resistance than the other objects did, which would have made the signs colder than the atmosphere. The FIR may have detected this temperature difference, making the signs visible in the FIR display. The results for the IR systems performance for the sign recognition tasks are presented in figure 58. The results indicate the IR systems may have been used to recognize the 30- and 55 mi/h signs but not the stop and yield signs.  Figure 58. Bar graph. Comparison of older driver mean visibility levels at sign recognition for the IR systems versus the VIS systems. It is not clear from these results why one sign type could be recognized using the IR systems and the other could not. This task required reading numbers on the speed limit signs and recognizing the shapes of the stop and yield signs. It would be expected that the IR reflectance of the sign material would be the same regardless of the color; the thermal performance of the sign material should also be the same; therefore, a difference was not expected in this comparison. Two possible reasons for this usage difference exist. The first is that the performance of the headlamps varied widely and may have affected the means of the VIS systems. The second is that the system allowed participants to follow the position of the sign on the roadway accurately as they approached, thus allowing them to identify the sign type earlier than the VIS systems allowed. IR System Usage SummaryThe comparison of the IR system photometry to that of the visible system photometry allowed for the development of an estimate of the IR system usage. This system usage indicated that the systems were used for all of the pedestrian objects except the left turn pedestrian on the left side of the road, who appeared to be outside of the NIR 2 and FIR systems’ FOV. The data indicated that the NIR 2 and FIR systems were a distraction to the driver for that scenario, requiring a higher level of object visibility for object detection than was required for the NIR 1 and visual VESs. The FIR system was used generally for objects that created heat, and the NIR systems generally had difficulties with the smaller objects. The differences in the IR spectral reflectance of some of the objects may also have influenced the near IR system usage. AGE ANALYSISThe final aspect of the data comparison is the effect of age. The visibility level model provides an age factor, which accounts for degradation of visual capabilities as a person ages. An age-based comparison of VIS systems and IR systems used the percentage of performance degradation between middle-aged and older drivers as compared to younger drivers. The younger drivers represented 100 percent. These values then were compared to the age factor as specified in the visibility level model. In this comparison, the ages of 30, 50, and 70 were used to represent the age groups. The result of the comparison is shown figure 59.  Figure 59. Line graph. Age comparison for detection of pedestrians. This comparison is based on the detection of the pedestrian objects group. The line graph in figure 59 shows that the age model overestimates the degradation of performance by older drivers. Because this model accounts for changes in the visual system only, it does not allow for improved driver performance with experience that may compensate for the loss of visual capabilities. This may explain the difference between actual performance and the model. The other interesting aspect of this comparison is the increased degradation in performance with the IR systems as compared to VIS systems. This may indicate that older drivers had greater difficulty adapting to the new IR systems than to changes in the headlamp system characteristics.
|