U.S. Department of Transportation
Federal Highway Administration
1200 New Jersey Avenue, SE
Washington, DC 20590
202-366-4000
Federal Highway Administration Research and Technology
Coordinating, Developing, and Delivering Highway Transportation Innovations
 |
| This report is an archived publication and may contain dated technical, contact, and link information |
|
Publication Number: FHWA-RD-02-045
Date: March 2003 |
||||||||||||||||||||||||||||||||||||||||||||||||||||||||||||||||||||||||||||||||||||||||||||||||||||||||||||||||||||||||||||||||||||||||||||||||||||||||||||||||||||||||||||||||||||||||||||||||||||||||||||||||||||||||||||||||||||||
IHSDM Intersection Diagnostic Review Model4.0 IDRM CONCERNS"Concerns" are the potential problem areas that IDRM is capable of evaluating. Twenty-seven concerns were defined for the initial knowledge base. These concerns are summarized in Table 3. This section provides a detailed description of each concern and specifies how each concern is evaluated by means of IDRM models. Threshold values are given for identification of each concern at Level 1 and Level 2. 4.1 Insufficient Intersection Sight DistanceDescription At every intersection, even where no horizontal or vertical curves are present, roadside sight obstructions can limit intersection sight distance (ISD). The ability of a driver on the major road to see the intersection is critical, as is the ability of a driver stopped on the minor approach to view the major road. In both cases, this view can be compromised or obstructed by roadside obstructions. Concern Type Leg concern Geometric Elements Involved
Associated Accident Types The following accident types are associated with insufficient ISD on intersection approaches:
Model(s) Used The models used to determine if there is sufficient ISD at an intersection are the ISD models presented in Sections 3.1 through 3.4 . Where no complicating factors such as horizontal or vertical curves are present, the value of Dtis zero. Evaluation Variable The variable used to evaluate ISD is Veff, the effective speed for which ISD is provided. Another variable used to evaluate ISD is the user's response (YES/NO) to the question concerning whether the sight triangles shown in Figure 3in Section 3.1 are clear. Evaluation Procedure The procedure presented here should be applied to both vertical and horizontal sight obstructions for each ISD case listed below in the section entitled "Concern Statement Message." The entire algorithm is presented here for completeness, but Steps 1 and 2 do not apply to this concern. The models used for these checks are those presented in Sections 3.1 through 3.4. 1. Compute the threshold ISD for a Level 1 advisory condition (ISD1) as:
where:
2. Compute the threshold ISD for a Level 2 advisory condition (ISD2) as:
where:
3. The following checks should be applied for horizontal sight obstructions:
4. If either a LEVEL 1 ADVISORY or LEVEL 2 ADVISORY is triggered based on Step 3, since no horizontal curve is present within the applicable distance to the left or right of the intersection, as appropriate to the ISD case being evaluated, then no postscript should be included after the advisory message. 5. Display and/or record the appropriate safety advisory message. Threshold Values Table 20. Tentative Threshold Values and Types of Safety Advisory Messages for Evaluation of ISD
Concern Statement Message Insufficient ISD to right (Case B1) for ___ leg Insufficient ISD to left (Case B2) for ___ leg Insufficient ISD to right (Case B3) for ___ leg Insufficient ISD to left (Case B3) for ___ leg Insufficient ISD for left turn from major road (Case F) for ___ leg Basis The thresholds are based on the judgment of the expert team. Supplementary Information for the User None known at this time. References
4.2 Insufficient Intersection Sight Distance for Intersection on a Horizontal CurveDescription The presence of a horizontal curve on an intersection approach represents an additional risk beyond that of a typical intersection. Two issues related to ISD include:
Increased Probability of Roadside Sight Obstructions The ability of a driver on the major road to see the intersection is critical, as is the ability of a driver stopped on the minor approach to view the major road. In both cases, this view can be compromised or obstructed along the inside of the curve due to roadside obstructions, or even normal slopes. The likelihood and severity of this problem increase with the sharpness of the curve. Also, for curves that are long and for intersections located at the middle of the curve, the severity of this problem may be greater. Difficult Turning Maneuvers The presence of a curve through an intersection can create difficult or awkward turning maneuvers for drivers and vehicles. These include acute-angle right turns such as those that occur at skewed intersections. They also include "reverse path" turns, i.e., those in which the vehicle tracking the main road is turning in one direction, with the turning movement (either left or right) in the opposing direction. This reverse turning movement can be further exacerbated if the mainline curve is significantly superelevated and the vehicle must turn against the superelevation. Such awkward turns may take longer to complete, increasing the exposure of the vehicle to conflict. In the extreme, such turns by heavy vehicles or those with a high center of gravity may lead to loss of control. Concern Type Leg concern Geometric Elements Involved
Associated Accident Types The following accident types are associated with insufficient ISD for a horizontal curve:
Model(s) Used The models used to determine if there is sufficient ISD for a horizontal curve are the ISD models presented in Sections 3.1 through 3.4, with additional time, Dtc, being added to the time gaps. Evaluation Variable The variable used to evaluate ISD for a horizontal curve is Veff, the effective speed for which ISD is provided. Another variable used to evaluate ISD for a horizontal curve is the user's response (YES/NO) to the question concerning whether the sight triangles shown in Figure 3 in Section 3.1 are clear. Evaluation Procedure The procedure presented here should be applied to both vertical and horizontal sight obstructions for each ISD case listed below in the section entitled "Concern Statement Message." The entire algorithm is presented here for completeness, but Steps 1 and 2 do not apply to this concern. The models used for these checks are those presented in Sections 3.1 through 3.4 . 1. Compute the threshold ISD for a Level 1 advisory condition (ISD1) as:
where:
2. Compute the threshold for an ISD Level 2 advisory condition (ISD2) as:
where:
3. The following checks should be applied for horizontal sight obstructions:
4. If either a LEVEL 1 ADVISORY or LEVEL 2 ADVISORY is triggered based on Step 3, and a horizontal curve is present within the applicable distance to the left or right of the intersection, as appropriate to the ISD case being evaluated, then the postscript "- horizontal curve" should be included after the advisory message. 5. If either a LEVEL 1 ADVISORY or LEVEL 2 ADVISORY is triggered based on Step 3, but no horizontal curve is present within the applicable distance to the left or right of the intersection, as appropriate to the ISD case being evaluated, then no postscript should be included after the advisory message. 6. Display and/or record the appropriate safety advisory message. Threshold Values Threshold values can be found in Table 20 in Section 4.1. Concern Statement Message Insufficient ISD to right (Case B1) for ___ leg Insufficient ISD to left (Case B2) for ___ leg Insufficient ISD to right (Case B3) for ___ leg Insufficient ISD to left (Case B3) for ___ leg Insufficient ISD for left turn from major road (Case F) for ___ leg Basis The thresholds are based on the judgment of the expert team. Supplementary Information for the User None known at this time. References
4.3 Insufficient Intersection Sight Distance for a Horizontal Curve on an Intersection ApproachDescription The presence of a horizontal curve on an intersection approach represents an additional risk beyond that of a typical intersection. This scenario is similar to the scenario of an intersection on a horizontal curve, which was previously discussed. Both scenarios have an increased probability of roadside sight obstructions. Concern Type Leg concern Geometric Elements Involved
Associated Accident Types The following accident types are associated with insufficient ISD for a horizontal curve on an intersection approach:
Model(s) Used The models used to determine if there is sufficient ISD for a horizontal curve are the ISD models presented in Sections 3.1 through 3.4, with additional time, Dtc, being added to the time gaps. Evaluation Variable The variable used to evaluate ISD for a horizontal curve on an intersection approach is Veff, the effective speed for which ISD is provided. Another variable used to evaluate ISD for this scenario is the user's response (YES/NO) to the question concerning whether the sight triangles shown in Figure 3 in Section 3.1 are clear. Evaluation Procedure The procedure presented here should be applied to both vertical and horizontal sight obstructions for each ISD case listed below in the section entitled "Concern Statement Message." The entire algorithm is presented here for completeness, but Steps 1 and 2 do not apply to this concern. The models used for these checks are those presented in Sections 3.1 through 3.4. 1. Compute the threshold ISD for a Level 1 advisory condition (ISD1) as:
where:
2. Compute the threshold for an ISD2 Level 2 advisory condition (ISD2) as:
where:
3. The following checks should be applied for horizontal sight obstructions: Is Region 1 clear of roadside sight obstructions?
Is Region 2 clear of roadside sight obstructions?
4. If either a LEVEL 1 ADVISORY or LEVEL 2 ADVISORY is triggered based on Step 3, and a horizontal curve is present within the applicable distance to the left or right of the intersection, as appropriate to the ISD case being evaluated, then the postscript "- horizontal curve" should be included after the advisory message. 5. If either a LEVEL 1 ADVISORY or LEVEL 2 ADVISORY is triggered based on Step 3, but no horizontal curve is present within the applicable distance to the left or right of the intersection, as appropriate to the ISD case being evaluated, then no postscript should be included after the advisory message. 6. Display and/or record the appropriate safety advisory message. Threshold Values Threshold values can be found in Table 20 in Section 4.1. Concern Statement Message Insufficient ISD to right (Case B1) for ___ leg Insufficient ISD to left (Case B2) for ___ leg Insufficient ISD to right (Case B3) for ___ leg Insufficient ISD to left (Case B3) for ___ leg Insufficient ISD for left turn from major road (Case F) for ___ leg Basis The thresholds are based on the judgment of the expert team. Supplementary Information for the User None known at this time. References Harwood, D.W., J. Mason, R. Brydia, M. Pietrucha, and G. Gittings. Intersection Sight Distance, NCHRP Report 383. Transportation Research Board, Washington, DC, 1996. A Policy on Geometric Design of Highways and Streets (Green Book). American Association of State Highway and Transportation Officials, Washington, DC, 1994. 4.4 Insufficient Intersection Sight Distance for Intersection on Approaches to Crest Vertical CurveDescription The presence of a crest vertical curve on an intersection approach represents an additional risk beyond that of a typical intersection. Two potential problems related to ISD that can occur at intersections on crest vertical curves include:
Concern Type Leg concern Geometric Elements Involved
Associated Accident Types The following accident types are associated with insufficient ISD for an intersection on an approach to a crest vertical curve:
Model(s) Used The models used to determine if there is sufficient ISD for intersections on an approach to a vertical curve are the ISD models presented in Sections 3.1 through 3.4 , with additional time, Dtc, being added to the time gaps. Evaluation Variable The variable used to evaluate ISD for intersections on an approach to a vertical curve is Veff, the effective speed for which ISD is provided. Another variable used to evaluate ISD for this scenario is the user's response (YES/NO) to the question concerning whether the sight triangles shown in Figure 3 in Section 3.1 are clear. Evaluation Procedure The procedure presented here should be applied to both vertical and horizontal sight obstructions for each ISD case listed below in the section entitled "Concern Statement Message." The models used for these checks are those presented in Sections 3.1 through 3.4. 1. Compute the threshold ISD for a Level 1 advisory condition (ISD1) as:
where:
2. Compute the treshold for an ISD Level 2 advisory condition (ISD2) as:
where:
3. If ISDvert £ ISD1, then LEVEL 1 ADVISORY applies for vertical sight obstructions. If ISDvert > ISD1 and ISDvert £ ISD2, then LEVEL 2 ADVISORY applies for vertical sight obstructions. 4. If either a LEVEL 1 ADVISORY or LEVEL 2 ADVISORY is triggered based on Step 3, then the postscript "- crest vertical curve" should be included after the advisory message. 5. Display and/or record the appropriate safety advisory message. Threshold Values Threshold values can be found in Table 20 in Section 4.1. Concern Statement Message Insufficient ISD to right (Case B1) for ___ leg Insufficient ISD to left (Case B2) for ___ leg Insufficient ISD to right (Case B3) for ___ leg Insufficient ISD to left (Case B3) for ___ leg Insufficient ISD for left turn from major road (Case F) for ___ leg Basis The thresholds are based on the judgment of the expert team. Supplementary Information for the User None known at this time. References Harwood, D.W., J. Mason, R. Brydia, M. Pietrucha, and G. Gittings. Intersection Sight Distance, NCHRP Report 383. Transportation Research Board, Washington, DC, 1996. A Policy on Geometric Design of Highways and Streets (Green Book). American Association of State Highway and Transportation Officials, Washington, DC, 1994. 4.5 Insufficient Intersection Sight Distance for Multileg IntersectionDescription Multileg intersections are those with five or more intersection legs. The inclusion of additional approach(es) to an intersection represents an additional risk beyond that of a typical four-leg intersection. A multileg intersection may violate driver expectancy and present an additional burden to the driver's decision-making process. For example, drivers may have difficulty perceiving the correct route to follow. Concern Type Leg concern Geometric Elements Involved
Associated Accident Types The following accident types are associated with insufficient ISD for a multileg intersection:
Model(s) Used The models used to determine if there is sufficient ISD for a multileg intersection are the ISD models presented in Sections 3.1 through 3.4 , with additional time, Dtc, being added to the time gaps. Evaluation Variable The variable used to evaluate ISD for a multileg intersection is Veff, the effective speed for which ISD is provided. Another variable used to evaluate ISD for a multileg intersection is the user's response (YES/NO) to the question concerning whether the sight triangles shown in Figure 3 in Section 3.1 are clear. Evaluation Procedure The procedure presented here should be applied to both vertical and horizontal sight obstructions for each ISD case listed below in the section entitled "Concern Statement Message." The models used for these checks are those presented in Sections 3.1 through 3.4. 1. Compute the threshold ISD for a Level 1 advisory condition (ISD1) as:
where:
2. Compute the threshold for an ISD Level 2 advisory condition (ISD2) as:
where:
3. If ISDvert £ ISD1, then LEVEL 1 ADVISORY applies for vertical sight obstructions. If ISDvert > ISD1 and ISDvert £ ISD2, then LEVEL 2 ADVISORY applies for vertical sight obstructions. 4. The following checks should be applied for horizontal sight obstructions:
5. The more critical of the results from Steps 3 and 4 should be selected as follows:
6. If either a LEVEL 1 ADVISORY or a LEVEL 2 ADVISORY is triggered based on Step 3, then the postscripts "- crest vertical curve" and "- multileg intersection" should be included after the advisory message. 7. If either a LEVEL 1 ADVISORY or a LEVEL 2 ADVISORY is triggered based on Step 4 and a horizontal curve is present within the applicable distance to the left or right of the intersection, as appropriate to the ISD case being evaluated, then the postscripts "- crest vertical curve" and "- multileg intersection" should be included after the advisory message. 8. If either a LEVEL 1 ADVISORY or a LEVEL 2 ADVISORY is triggered based on Step 4, but no horizontal curve is present within the applicable distance to the left or right of the intersection, as appropriate to the ISD case being evaluated, then the postscript "- multileg intersection" should be included after the advisory message. 9. Display and/or record the appropriate safety advisory message. Threshold Values Threshold values can be found in Table 20 in Section 4.1 . Concern Statement Message Insufficient ISD to right (Case B1) for ___ leg Insufficient ISD to left (Case B2) for ___ leg Insufficient ISD to right (Case B3) for ___ leg Insufficient ISD to left (Case B3) for ___ leg Insufficient ISD for left turn from major road (Case F) for ___ leg These concerns may include other hyphenated postscripts as noted in Steps 6 and 7 above. Basis The thresholds are based on the judgment of the expert team. Supplementary Information for the User None known at this time. References
4.6 Insufficient Intersection Sight Distance for Intersections With More Than One Minor-Road Approach on the Same Side of the Major RoadDescription Intersections with more than one minor-road approach on the same side of the major road represent an additional risk beyond that of a typical four-leg intersection. The additional minor-road approach may be confusing to some drivers. For example, the priority of movements is unclear for minor-road approaches and drivers may have difficulty perceiving the correct route to follow. Concern Type Leg concern Geometric Elements Involved
Associated Accident Types The following accident types are associated with insufficient ISD for intersections with more than one minor-road approach:
Model(s) Used The models used to determine if there is sufficient ISD for intersections with more than one minor-road approach on the same side of the major road are the ISD models presented in Sections 3.1 through 3.4, with additional time, Dtc, being added to the time gaps. Evaluation Variable The variable used to evaluate ISD for intersections with more than one minor-road approach on the same side of the major road is Veff, the effective speed for which ISD is provided. Another variable used to evaluate ISD for this scenario is the user's response (YES/NO) to the question concerning whether the sight triangles shown in Figure 3 in Section 3.1 are clear. Evaluation Procedure The procedure presented here should be applied to both vertical and horizontal sight obstructions for each ISD case listed below in the section entitled "Concern Statement Message." The models used for these checks are those presented in Sections 3.1 through 3.4. 1. Compute the threshold ISD for a Level 1 advisory condition (ISD1) as:
where:
2. Compute the threshold for an ISD Level 2 advisory condition (ISD2) as:
where:
3. If ISDvert£ISD1, then LEVEL 1 ADVISORY applies for vertical sight obstructions. 4. If ISDvert > ISD1 and ISDvert £ ISD2, then LEVEL 2 ADVISORY applies for vertical sight obstructions.
5. The more critical of the results from Steps 3 and 4 should be selected, as follows:
6. If either a LEVEL 1 ADVISORY or LEVEL 2 ADVISORY is triggered based on Step 3, then the postscripts "- crest vertical curve" and "- more than one minor-road approach on the same side of the major road" should be included after the advisory message. 7. If either a LEVEL 1 ADVISORY or LEVEL 2 ADVISORY is triggered based on Step 4, and a horizontal curve is present within the applicable distance to the left or right of the intersection, as appropriate to the ISD case being evaluated, then the postscripts "- horizontal curve" and "- more than one minor-road approach on the same side of the major road" should be included after the advisory message. 8. If either a LEVEL 1 ADVISORY or LEVEL 2 ADVISORY is triggered based on Step 4, but no horizontal curve is present within the applicable distance to the left or right of the intersection, as appropriate to the ISD case being evaluated, then the postscript "- more than one minor-road approach on the same side of the major road" should be included after the advisory message. 9. Display and/or record the appropriate safety advisory messages. Threshold Values Threshold values can be found in Table 20 in Section 4.1. Concern Statement Message Insufficient ISD to right (Case B1) for ___ leg Insufficient ISD to left (Case B2) for ___ leg Insufficient ISD to right (Case B3) for ___ leg Insufficient ISD to left (Case B3) for ___ leg Insufficient ISD for left turn from major road (Case F) for ___ leg Basis The thresholds are based on the judgment of the expert team. Supplementary Information for the User None known at this time. References Harwood, D.W., J. Mason, R. Brydia, M. Pietrucha, and G. Gittings. Intersection Sight Distance, NCHRP Report 383. Transportation Research Board, Washington, DC, 1996. A Policy on Geometric Design of Highways and Streets (Green Book). American Association of State Highway and Transportation Officials, Washington, DC, 2001. 4.7 Insufficient Intersection Sight Distance for Skewed IntersectionsDescription When two highways intersect at an angle of less than 90 degrees, some of the factors for determination of intersection sight distance may need adjustment. For skewed intersections, the ISD model should be used to determine whether through traffic on the major road would be hidden from the view of a driver stopped on the minor-road approach at a skewed intersection. Concern Type Leg concern Geometric Elements Involved
Associated Accident Types The following accident types are associated with insufficient ISD for skewed intersections:
Model(s) Used The models used to determine if there is sufficient ISD for skewed intersections are the ISD models presented in Sections 3.1 through 3.4 , with additional time, Dtc, being added to the time gaps. The legs of the sight triangles will lie along the intersection approaches and each sight triangle will be larger or smaller than the corresponding sight triangle would be at a right-angle intersection. The area within each sight triangle should be clear of potential sight obstructions. At an oblique-angle intersection, the length of the travel paths for some turning and crossing maneuvers will be increased and additional time to assess a turning maneuver may be required. In the obtuse-angle quadrant of an oblique-angle intersection, the angle between the approach leg and the sight line is often so small that drivers can look across the full sight triangle with only a small head movement. However, in the acute-angle quadrant, drivers are often required to turn their heads considerably to see across the entire clear sight triangle. Evaluation Variable The variable used to evaluate ISD for skewed intersections is Veff, the effective speed for which ISD is provided. Another variable used to evaluate ISD for skewed intersections is the user's response (YES/NO) to the question concerning whether the sight triangles shown in Figure 3 in Section 3.1 are clear. Evaluation Procedure The procedure presented here should be applied to both vertical and horizontal sight obstructions for each ISD case listed below in the section entitled "Concern Statement Message." The models used for these checks are those presented in Sections 3.1 through 3.4. 1. Compute the threshold ISD for a Level 1 advisory condition (ISD1) as:
where:
2. Compute the threshold for an ISD Level 2 advisory condition (ISD2) as:
where:
3. If ISDvert £ ISD1, then LEVEL 1 ADVISORY applies for vertical sight obstructions. If ISDvert > ISD1 and ISDvert £ ISD2, then LEVEL 2 ADVISORY applies for vertical sight obstructions. 4. The following checks should be applied for horizontal sight obstructions:
5. The more critical of the results from Steps 3 and 4 should be selected as follows:
6. If either a LEVEL 1 ADVISORY or a LEVEL 2 ADVISORY is triggered based on Step 3, then the postscripts "- crest vertical curve" and "- multileg intersection" should be included after the advisory message. 8. If either a LEVEL 1 ADVISORY or a LEVEL 2 ADVISORY is triggered based on Step 4, but no horizontal curve is present within the applicable distance to the left or right of the intersection, as appropriate to the ISD case being evaluated, then the postscript "- multileg intersection" should be included after the advisory message. 9. Display and/or record the appropriate safety advisory message. Threshold Values Threshold values can be found in Table 20 in Section 4.1. Concern Statement Message Insufficient ISD to right (Case B1) for ___ leg Insufficient ISD to left (Case B2) for ___ leg Insufficient ISD to right (Case B3) for ___ leg Insufficient ISD to left (Case B3) for ___ l Insufficient ISD for left turn from major road (Case F) for ___ leg Basis The thresholds are based on the judgment of the expert team. Supplementary Information for the User None known at this time. References
4.8 Insufficient Stopping Sight Distance for a Crest Vertical Curve on an Intersection ApproachDescription The presence of a crest vertical curve on an intersection approach represents an additional risk beyond that of a typical intersection. The crest vertical curve may hide the intersection or vehicles at the intersection from the driver's view. Concern Type Leg concern Geometric Elements Involved
Associated Accident Types The following accident types are associated with insufficient SSD for a crest vertical curve on an intersection approach:
Model(s) Used The model used to determine if there is sufficient SSD for a crest vertical curve is the SSD model presented in Section 3.5. Evaluation Variable The variable used to evaluate SSD for a crest vertical curve on an intersection approach is Veff, the effective speed for which SSD is provided. Evaluation Procedure Assess the criticality of any SSD deficiency by the difference between Vact and Veff. If the intersection in question is a multileg intersection or has more than one minor-road leg on the same side of the major road, and if these conditions have led to advisory messages based on other models, then use an appropriate value of Dt in the determination of Veff. Table 21 presents the recommended threshold values and the types of safety advisory messages to be issued. Threshold Values Threshold values can be found in Table 21 in Section 4.9. Concern Statement Message Insufficient SSD for ___ leg If the above message is triggered and the intersection in question is a multileg intersection or has more than one minor-road approach on the same side of the major road, then add the appropriate postscript(s) to the advisory: - multileg intersection Basis The thresholds are based on the judgment of the expert team. Supplementary Information for the User None known at this time. References
4.9 Insufficient Stopping Sight Distance for a Horizontal Curve on an Intersection ApproachDescription The presence of a horizontal curve on an intersection approach represents an additional risk beyond that of a typical intersection. The horizontal curve presents an increased probability of roadside sight obstructions that hide the intersection or vehicles at the intersection from the driver's view. Concern Type Leg concern Geometric Elements Involved
Associated Accident Types The following accident types are associated with insufficient SSD for a horizontal curve on an intersection approach:
Model(s) Used The model used to determine if there is sufficient SSD for a horizontal curve is the SSD model presented in Section 3.6. Evaluation Variable The variable used to evaluate SSD for a horizontal curve on an intersection approach is Veff, the effective speed for which SSD is provided. Evaluation Procedure
Threshold Values Table 21. Tentative Threshold Values and Types of Safety Advisory Messages for Evaluation of SSD
Concern Statement Message Insufficient SSD for ___ leg If the above message is triggered and the intersection in question is a multileg intersection or has more than one minor-road approach on the same side of major road, then add the appropriate postscript(s) to the advisory: - multileg intersection Basis The thresholds are based on the judgment of the expert team. Supplementary Information for the User None known at this time. References
4.10 Insufficient Visibility of Traffic SignalDescription The presence of a horizontal curve, vertical curve, or any other physical sight obstruction within the intersection area can reduce the visibility distance to the traffic signal, thus affecting the driver's ability to stop in time. Concern Type Leg concern Geometric Elements Involved
Associated Accident Types The following accident types are associated with insufficient visibility distance to a traffic signal for signalized intersections:
Model(s) Used The model used to determine if there is sufficient visibility distance to a traffic signal is the SSD model presented in Section 3.7. Evaluation Variable The variable used to evaluate the visibility distance to a traffic signal, considering vertical sight restrictions, is Veff, the effective speed, for which visibility distance, VDavail,is provided. The variable used for evaluation of horizontal sight restrictions is the user's YES/NO response to the questions concerning a clear sight area. Evaluation Procedure The following evaluation procedure is used for vertical and horizontal sight obstructions:
Threshold Values Table 22. Tentative Threshold Values and Types of Safety Advisory Messages for Evaluation of Visibility to Traffic Signals
Concern Statement Message Insufficient visibility to signal for ____ leg Basis The thresholds are based on the judgment of the expert team. Supplementary Information for the User None known at this time. References
4.11 Insufficient Visibility of Stop SignDescription The presence of a horizontal curve, vertical curve, or any other physical sight obstruction within the intersection area can reduce the visibility distance to a stop sign, thus affecting the driver's ability to stop in time. Concern Type Leg concern Geometric Elements Involved
Associated Accident Types The following accident types are associated with insufficient visibility distance to a stop sign for stop-controlled intersections:
Model(s) Used The model used to determine if there is sufficient visibility distance to a stop sign is the SSD model presented in Section 3.8. Evaluation Variable The variable used to evaluate the visibility distance to a stop sign, considering vertical sight restriction, is Veff, the effective speed, for which visibility distance, VDavail,is provided. The variable used for evaluation of horizontal sight restrictions is the user's YES/NO response to the questions concerning a clear sight area. Evaluation Procedure The following evaluation procedure is used for vertical and horizontal sight obstructions:
Threshold Values Table 23. Tentative Threshold Values and Types of Safety Advisory Messages for Evaluation of Visibility to Stop Signs
Concern Statement Message Insufficient visibility to stop sign for ___ leg Basis The thresholds are based on the judgment of the expert team. Supplementary Information for the User None known at this time. References
4.12 Insufficient Visibility of Yield SignDescription The presence of a horizontal curve, vertical curve, or any other physical sight obstruction within the intersection area can reduce the visibility distance to a yield sign, thus affecting the driver's ability to react appropriately. Concern Type Leg concern Geometric Elements Involved
Associated Accident Types The following accident types are associated with insufficient visibility distance to a yield sign for yield-controlled intersections:
Model(s) Used The model used to determine if there is sufficient visibility distance to a yield sign is the SSD model presented in Section 3.9. Evaluation Variable The variable used to evaluate the visibility distance to a yield sign, considering vertical sight restrictions, is Veff, the effective speed, for which visibility distance, VDavail,is provided. The variable used for evaluation of horizontal sight restrictions is the user's YES/NO response to the questions concerning a clear sight area. Evaluation Procedure The following evaluation procedure is used for vertical and horizontal sight obstructions:
Threshold Values Table 24. Tentative Threshold Values and Types of Safety Advisory Messages for Evaluation of Visibility to Yield Signs
Concern Statement Message Insufficient visibility of yield sign for ____ leg Basis The thresholds are based on the judgment of the expert team. Supplementary Information for the User None known at this time. References
4.13 Insufficient Decision Sight Distance for a Crest Vertical Curve on an Intersection ApproachDescription The presence of a crest vertical curve on an intersection approach represents an additional risk beyond that of a typical intersection. The crest vertical curve may hide the intersection or vehicles at the intersection from the driver's view. Concern Type Leg concern Geometric Elements Involved
Associated Accident Types The following accident types are associated with insufficient DSD for a crest vertical curve on an intersection approach:
Model(s) Used The model used to determine if there is sufficient DSD for vertical curves is the DSD model presented in Section 3.10. Evaluation Variable The variable used to evaluate DSD for a crest vertical curve on an intersection approach is Veff, the effective speed for which DSD is provided. Evaluation Procedure
Threshold Values The threshold value for a Level 2 advisory is Veff - Vact < 0. Concern Statement Message Insufficient DSD for ___ leg Basis The thresholds are based on the judgment of the expert team. Supplementary Information for the User None known at this time. References
4.14 Insufficient Decision Sight Distance for a Horizontal Curve on an Intersection ApproachDescription The presence of a horizontal curve on an intersection approach represents an additional risk beyond that of a typical intersection. The horizontal curve presents an increased probability of roadside sight obstructions that hide the intersection or vehicles at the intersection from the driver's view. The DSD model for horizontal curves is applied in IDRM wherever the driver's view of an intersection or potentially conflicting vehicle is limited by an obstruction on the inside of a horizontal curve. Concern Type Leg concern Geometric Elements Involved
Associated Accident Types The following accident types are associated with insufficient DSD for a horizontal curve on an intersection approach:
Model(s) Used The model used to determine if there is sufficient DSD for horizontal curves is the DSD model presented in Section 3.11. Evaluation Variable The variable used to evaluate DSD for a horizontal curve on an intersection approach is Veff, the effective speed for which DSD is provided. Evaluation Procedure
Threshold Values The threshold value for a Level 2 advisory is Veff - Vact < 0. Concern Statement Message Insufficient DSD for ___ leg - horizontal curve Basis The thresholds are based on the judgment of the expert team. Supplementary Information for the User None known at this time. References
4.15 Insufficient Decision Sight Distance for Multileg IntersectionDescription Multileg intersections are those with five or more intersection legs. The inclusion of additional approach(es) to an intersection represents an additional risk beyond that of a typical four-leg intersection. A multileg intersection may violate driver expectancy and present an additional burden to the driver's decision-making process. For example, drivers may have difficulty perceiving the correct route to follow. Concern Type Leg concern Geometric Elements Involved
Associated Accident Types The following accident types are associated with insufficient DSD for a multileg intersection:
Model(s) Used It is recommended that a model of driver navigational decisions that is sensitive to the number of intersection legs (i.e., the number of potential paths through the intersection) be developed. This model should be based on a synthesis of human factors literature related to driver navigational decisions. It is expected that the results of this human factors evaluation will indicate that an additional increment of time (Dt) is required for a driver to perceive and react to a multileg intersection over and above that required at a four-leg intersection. This Dt would be added to the DSD value from Table 10 for a speed equal to Vact, both for horizontal curves as well as for vertical curves:
Evaluation Variable The variable used to evaluate DSD for a multileg intersection is Veff, the effective speed for which DSD is provided. Evaluation Procedure Assess the criticality of any DSD deficiency by the difference between Vact and Veff. Threshold Values The threshold value for a Level 2 advisory is Veff - Vact < 0. Concern Statement Message Insufficient DSD for ___ leg Basis The thresholds are based on the judgment of the expert team. Supplementary Information for the User None known at this time. References
4.16 Insufficient Decision Sight Distance for Intersections With More Than One Minor-Road Approach on the Same Side of the Major RoadDescription Intersections with more than one minor-road approach on the same side of the major road represent an additional risk beyond that of a typical four-leg intersection. The additional minor-road approach may be confusing to some drivers. For example, the priority of movements is unclear for minor-road approaches and drivers may have difficulty perceiving the correct route to follow. Concern Type Leg concern Geometric Elements Involved
Associated Accident Types The following accident types are associated with insufficient SSD for intersections with more than one minor-road approach:
Model(s) Used It is recommended that a human factors evaluation be performed to determine what effect the additional minor-road approach on one side of the major road has on the driver. It is expected that the results of this human factors evaluation will indicate that an additional increment of time (Dt) is required for a driver to perceive and react to this type of intersection over and above that required at a standard four-leg intersection. This Dt would be added to the DSD value from Table 10 for a speed equal to Vact, both for horizontal curves as well as for vertical curves:
Evaluation Variable The variable used to evaluate DSD for an intersection with more than one minor-road approach is Veff, the effective speed for which DSD is provided. Evaluation Procedure Assess the criticality of any DSD deficiency by the difference between Vact and Veff. Threshold Values The threshold value for a Level 2 advisory is Veff - Vact < 0. Concern Statement Message Insufficient DSD for ___ leg - more than one minor-road approach on the same side of the major road Basis The thresholds are based on the judgment of the expert team. Supplementary Information for the User None known at this time. References
4.17 Increased Crossing DistanceDescription A clearance time model is required to address safety and operational issues that arise from the additional distance (and time) that vehicles require to cross skewed intersections versus right-angle intersections. At unsignalized intersections, the need for additional clearance time is safety-related. Additional clearance time is required for stopped vehicles on the minor approach to cross the intersection, resulting in greater exposure of the vehicle to conflict. The sight distance for a crossing maneuver from one minor-road leg to the other is based on the time it takes for the stopped vehicle to clear the intersection. The time gap for ISD for crossing the major road at an unsignalized intersection should thus be increased by Dt at a skewed intersection. At signalized intersections, the additional time needed to cross the skewed intersection is more of an operational issue than a safety issue. Increased crossing time at a skewed intersection will have a negative effect on the operational efficiency of a signalized intersection by requiring an increase in the all-red clearance time. The function of the all-red clearance time is to allow the vehicle that has entered the intersection to safely clear the intersection before the conflicting movement is released. Concern Type Leg concern Geometric Elements Involved
Associated Accident Types The following accident type is associated with increased crossing distance:
Model(s) Used The model used to determine if increased crossing distance is a concern is the clearance time model presented in Section 3.12. Evaluation Variable The variable used to evaluate this concern is the additional time needed for vehicles to cross a skewed intersection relative to a right-angle intersection. Evaluation Procedure The following steps are required to evaluate the clearance time model:
The evaluation procedure is the same for both signalized and unsignalized intersections. Threshold Values Unsignalized Intersections
Signalized Intersections Concern Statement Message Increased crossing distance for ____ leg - skewed intersection Basis At signalized intersections, the key issue is providing increased clearance intervals. The researchers feel that the increased clearance times at skewed intersections are not substantial enough to affect the overall operation of the intersections; thus, only a Level 2 advisory message is issued for intersections with a skew angle of 45 degrees or less. Supplementary Information for the User No additional information is expected to be made available to the user through the help system. References
4.18 Warranted Left-Turn Lane Is Not PresentDescription A model is required to identify the need for left-turn lanes at intersections and to highlight locations where lack of a left-turn lane presents a potential safety concern. For rural, unsignalized intersections along the through or unstopped approach, left-turn lanes serve a safety and operational efficiency function by removing decelerating and stopped vehicles waiting to turn from the higher speed through lanes. Concern Type Leg concern Geometric Elements Involved
Associated Accident Types The following accident types are associated with a warranted left-turn lane:
Model(s) Used The model used to determine if a left-turn lane is warranted is the left-turn lane warrants model presented in Section 3.13 . Evaluation Variable The variables used to evaluate this concern are the peak- or design-hour volume for the left turn in question and the peak- or design-hour volume for the opposing approach for the major, unstopped approach at the intersection. Evaluation Procedure The following steps are required to evaluate the left-turn lane warrant model:
Threshold Values A Level 2 warning would be displayed if the design year forecast warranting left-turn volume is within 10 percent of the value indicated in Table 15, Section 3.13 Left-Turn Lane Warrants (i.e., 0.9 * volume from look-up table < design year volume < volume from look-up table). A Level 1 warning would be displayed where the left-turn volume exceeds the warranting volume given in Table 15 . Concern Statement Message Warranted left-turn lane is not present on ____ leg Basis The basis for the Level 2 warning is that the designer should be alerted to the fact that the respective traffic volume is approaching a threshold value. This is especially true given the uncertainty of typical traffic forecasts. When threshold values are exceeded, a Level 1 warning is generated to instruct the designer to include a left-turn lane in the design. Given the use of actual speed and considering the potential variations in left-turn volumes, it is possible that one approach may indicate the need for a left-turn lane, but the other may not show the need. IDRM will consider a warranting condition as applying to both directions of travel if warrants are met for either unstopped approach. In most cases, an identified non-warranting condition will be associated with the lack of a turn lane where one should exist. Where a turning lane exists, but is not "warranted," this is not considered a problem and no message would be displayed. Supplementary Information for the User No additional information is expected to be made available to the user through the help system. References
4.19 Warranted Right-Turn Lane Is Not PresentDescription A model is required to identify the need for right-turn lanes at intersections and to highlight locations where lack of a right-turn lane presents a potential safety concern. For rural, unsignalized intersections along the through or unstopped approach, right-turn lanes serve a safety and operational efficiency function by removing decelerating and stopped vehicles waiting to turn from the higher speed through lanes. Concern Type Leg concern Geometric Elements Involved
Associated Accident Types The following accident type is associated with a warranted right-turn lane:
Model(s) Used The model used to determine if a right-turn lane is warranted is the right-turn lane warrants model presented in Section 3.14. Evaluation Variable The variables used to evaluate this concern are the peak- or design-hour volume for the right turn in question and the peak- or design-hour volume for the total approach on which the right-turn lane warrant is being investigated. Evaluation Procedure The following steps are required to evaluate the right-turn lane warrant model:
Threshold Values A Level 2 warning would be displayed if the design year forecast warranting right-turn volume is within 10 percent of the value indicated in Table 16, Section 3.14, Right-Turn Lane Warrants. A Level 1 warning would be displayed where the right-turn volume exceeds the warranting volume given in Table 16. Concern Statement Message Warranted right-turn lane is not present on ____ leg Basis The basis for the Level 2 warning is that the designer should be alerted to the fact that the respective traffic volume is approaching a threshold value. This is especially true given the uncertainty of typical traffic forecasts. When threshold values are exceeded, a Level 1 warning is generated to instruct the designer to include a right-turn lane in the design. In most cases, an identified non-warranting condition will be associated with the lack of a turn lane where one should exist. Where a turning lane exists, but is not "warranted," this is not considered a problem and no message would be displayed. Supplementary Information for the User No additional information is expected to be made available to the user through the help system. References
4.20 Insufficient Left-Turn Bay Storage and Deceleration Length Between Closely Spaced IntersectionsDescription A model is required to address safety and operational issues that arise from the often-restricted dimension along a major road between closely spaced intersections. A function of auxiliary lanes is to store vehicles waiting to turn off a major roadway. Intersections with high turning-traffic volumes and/or opposing traffic volumes generally require greater storage lengths. Concern Type Intersection concern Geometric Elements Involved
Associated Accident Types The following accident type is associated with insufficient storage and deceleration length for back-to-back left-turn lanes between closely spaced intersections:
Model(s) Used The models used to determine if there is sufficient storage and deceleration length for left-turn lanes between closely spaced intersections are left-turn lane length for closely spaced intersections model (Section 3.15) and queue length prediction model (Section 3.20 ). Evaluation Variable The variable used to evaluate this concern is the left-turn lane storage and deceleration length. Evaluation Procedure The following steps are required to evaluate the storage and deceleration length model for left turns at an intersection:
Threshold Values Threshold values for storage and deceleration are based on the queue-prediction model output and the required deceleration length. These values may vary substantially based on existing or forecast volume conditions at an intersection and the anticipated vehicle speed. Guidance on required length may also be available in the PRM. Level 2 messages will be issued when the required storage and deceleration lane length is within 10 percent of the actual full-width lane length. Level 1 messages will be issued when the required storage and deceleration lane length is greater than the actual length provided. Concern Statement Message Insufficient storage and deceleration length for left-turn lanes between closely spaced intersections Basis The basis of the thresholds is that providing full turn-bay storage and deceleration length at an intersection is critical to avoiding backing up traffic into the through lane. Supplementary Information for the User No additional information is expected to be made available to the user through the help system. References
4.21 Insufficient Taper Length for Left-Turn Lanes Between Closely Spaced IntersectionsDescription A model is required to address safety and operational issues that arise from the often-restricted dimension along a major road between closely spaced intersections. Drivers turning off a highway at an intersection are usually required to reduce their speed before turning. When undue deceleration takes place directly on the highway through lanes, it disrupts the flow of through lane traffic. Providing an adequate taper length for vehicles entering a left-turn bay helps remove decelerating vehicles from the through-traffic stream. Concern Type Intersection concern Geometric Elements Involved
Associated Accident Types The following accident types are associated with insufficient taper length for left-turn lanes between closely spaced intersections:
Model(s) Used The model used to determine if there is sufficient taper length for left-turn lanes between closely spaced intersections is the left-turn lane length for closely spaced intersections model presented in Section 3.15. Evaluation Variable The variable used to evaluate this concern is the left-turn lane taper length. Evaluation Procedure The following steps are required to evaluate the taper length model:
Threshold Values Level 2 messages will be issued when the required taper length is within 10 percent of the actual taper length. Level 1 messages will be issued when the required taper length is greater than the actual taper length provided. Concern Statement Message Insufficient taper length for left-turn lanes between closely spaced intersections
Basis The basis of the thresholds is that providing adequate taper lengths for left-turn lanes is critical to removing slow-moving vehicles from the through-traffic stream. Supplementary Information for the User No additional information is expected to be made available to the user through the help system. References
4.22 High Traffic Conflict IndexDescription The intersection conflict index is used to measure the relative safety of an intersection configuration as a function of the number and types of intersection conflicts. Intersection conflict analysis is a well-understood means of addressing intersection safety. It has long been known that three-leg intersections operate more safely than four-leg intersections because three-leg intersections have fewer conflict points at which conflicting traffic streams cross, merge, or diverge. Intersection conflicts reflect the crossing or conflicting paths of vehicles moving from one leg to another. Depending on the type of movement (right or left turn, or crossing the intersection), any one vehicle can encounter or create one or more different conflicts. The different types of conflicts include diverging, merging, or crossing conflicts. It is proposed to extend the same concept to the evaluation of multileg intersections. The intersection conflict index proposed for IDRM recognizes two principles of intersection conflicts and accidents. First, conflicts (and the associated risk of a particular type of accident) are related to the traffic volume of the conflicting movements. Second, the different conflicts have differing importance. This is a reflection of the severity of accidents associated with a conflict type. Concern Type Intersection concern Geometric Elements Involved
Associated Accident Types The following accident types are associated with a high traffic conflict index:
Model(s) Used The model used to determine if the intersection has a high traffic conflict index is the intersection conflict index model presented in Section 3.16. Evaluation Variable The variable used to evaluate this concern is the intersection conflict index. Evaluation Procedure The following steps are required to evaluate the intersection conflict index (ICI) model at an intersection:
Threshold Values The following thresholds are proposed for the intersection conflict index of a four-leg intersection: ICI < 600,000 Reasonable level of conflict at an intersection. ICI > 600,000 Investigate signalization to minimize conflicts and serve traffic volumes. Based on the judgment of the researchers, the following threshold values of the ICI for multileg intersections are recommended:
Concern Statement Message High traffic conflict interest - multileg intersection Basis MUTCD warrants for all-way stop and signalized intersection control offer a means of determining reasonable thresholds for critical values of ICI as an absolute measure of intersection safety. The warrants are based on the same general principles of conflict and traffic volume. To establish reasonable thresholds, a series of calculations were performed for a range of typical traffic volumes based on the following MUTCD warrants:
Conversion of peak-hour volumes to 4-h and 8-h volumes was based on typical 24-h volume distributions. The distribution of ICI values is relatively uniform for each signal warrant investigated. ICI values for the all-way stop condition are approximately one-half of those computed for the signal warrants. Supplementary Information for the User No additional information is expected to be made available to the user through the help system. References
4.23 Uneven, Discontinuous Minor-Road Profile Through IntersectionDescription The profile of minor roads at intersections can present operational problems if not properly de4signed. Issues of concern where there is not continuity of the minor-road profile through an intersection include:
Concern Type Leg concern Geometric Elements Involved Discontinuous minor-road profile through intersection. Associated Accident Types No particular crash types are associated with this concern. Model(s) Used The model used to determine if the minor-road profile through the intersection is a concern is the minor-road profile model presented in Section 3.17. Evaluation Variable The variables used to evaluate this concern are:
Evaluation Procedure 1. Determine each minor, stopped approach:
2. Determine the grade within 100 m of the centerline intersection of the two roadways on each minor approach. The intent is to provide information on the full vertical profile within 100 m on each side of the intersection. 3. Refer to the traffic volume and determine the desirability or need for a "platform" for drivers stopped on the minor approach. The criteria for a platform is considered to be any local grade of ± 2 percent. Display appropriate message (see below).
4. Determine the cross-slope (or slope if superelevated) of the major road through the intersection.
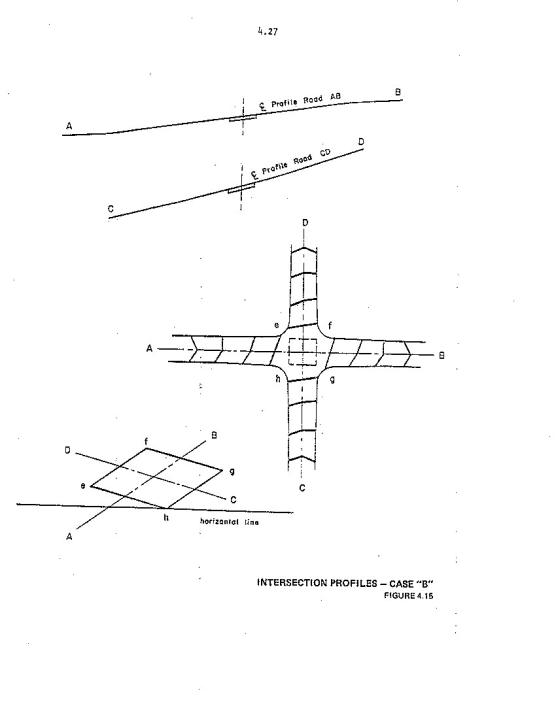
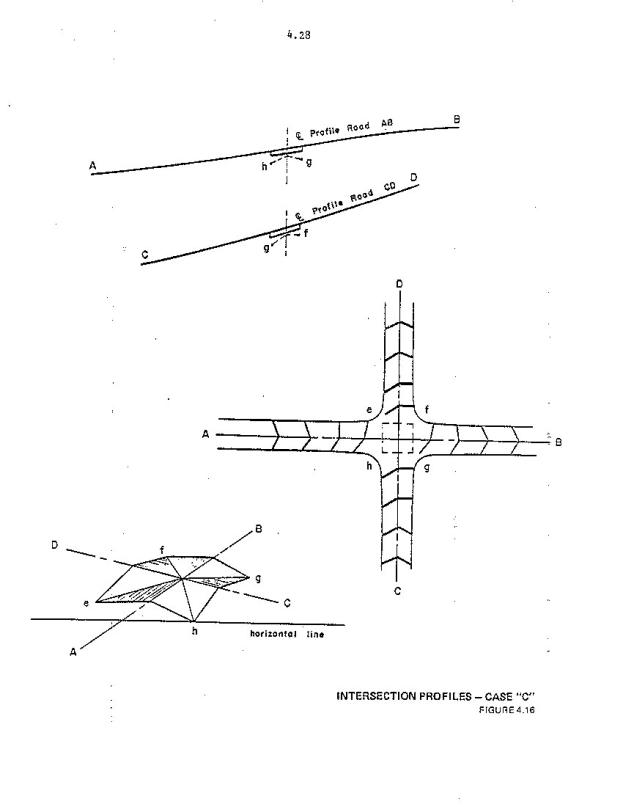
5. For each minor road, determine the relative difference in grades between the cross-slope of the major road and the minor road. Refer to the table that relates to design controls on grade; produce message as appropriate. 6. Check the presence of a vertical curve where grade changes are significant (see table notes); produce message as appropriate. Referring to Figure 9 through Figure 11 below, the user can note the type of drainage and edge warping planned. Check the operating speeds of both roads and the type of traffic control. Case A (Figure 9), in which the major-road profile dictates and the minor-road profile fits the cross-slope of the major road, is preferred. Case B (Figure 10 ), presents a case in which the entire intersection drains to one corner. This is not desirable and should be avoided, particularly if the pavement area is large and/or the local grades through the intersection are very mild. Case C (Figure 11), in which the pavement edges are warped so that water drains to all four corners, is to be avoided on higher speed, unstopped approaches. It may be suitable where speeds are low, both facilities are similar in nature, and where all four approaches are stop-controlled.
Threshold Values The threshold value for the profile on the minor, stopped approach is 2 percent. Areas not meeting this criterion would be given a Level 2 warning. Threshold values for cross-slope differential between the major and minor road are shown in Table 19 , which can be found in Section 3.17, Minor-Road Profile. A Level 2 warning would be displayed for intersections exceeding the maximum criteria above. Concern Statement Message Uneven, discontinuous minor-road profile through intersection for ____ leg Basis The threshold values are based on operational and geometric principles as well as the judgment of the researchers. Supplementary Information for the User Reference to Figures illustrating Cases A, B, and C intersection profiles will be made available to the user via the concern background. References Planning and Design Guide for At-Grade Intersection (Course workbook), Jack E. Leisch and Associates, 1990. 4.24 Large Intersection Pavement AreaDescription Intersections with large, open pavement areas can produce operational problems. Large, open pavement areas generally occur at multileg intersections, skewed intersections, and intersections on a horizontal curve. Larger intersections are more costly to construct and maintain. The open pavement areas can be more difficult to drain, which may create icing or other vehicle control problems. In addition, large, open pavement areas at intersections may also be difficult for unfamiliar drivers to navigate. The need to accommodate the operation of long and wide vehicles also produces special problems at intersections. Vehicle turning paths, which are a function of the characteristics of the vehicles, take up considerable space as the vehicle makes either a right or left turn. The amount of space and potential impacts on the operation and safety of the intersection are influenced by the type of large vehicle and the angle of the intersection. The types and severity of the potential for turning path problems are based on the frequency of large vehicle turns and which approach legs (i.e., stopped or unstopped) are skewed. Turning-path requirements are a concern at all intersections, but are particularly important at skewed and multileg intersections. An intersection on a relatively sharp horizontal curve will also result in one or more turning movements occurring through a skew. Concern Type Intersection concern Geometric Elements Involved
Associated Accident Types The following accident types are associated with a large intersection pavement area:
Model(s) Used The model used to determine if the pavement area is a concern is the intersection pavement area model presented in Section 3.18. Evaluation Variable The variables used to evaluate this concern are number of intersection legs, skew angle, type of design vehicle, and percentage of heavy vehicles in the traffic stream. Evaluation Procedure The following steps are required to evaluate the pavement area model:
Threshold Values A Level 2 warning would be displayed for multileg intersections and intersections with skew angles less than 60 degrees. Level 1 warnings will not be issued for this concern. A Level 2 warning would be displayed for multileg intersections and intersections with skew angles less than 80 degrees if the design vehicle is larger than a WB-15 and if the percentage of heavy vehicles in the traffic stream is greater than 5 percent. Concern Statement Message Large intersection pavement area Large intersection pavement area Large intersection pavement area Basis The basis for the Level 2 warning is that the designer should be alerted to the fact that intersections with large, open pavement areas can produce operational problems and are more costly to construct and maintain. The threshold intersection skew angle of 60 degrees is recommended based on the judgment of the researchers. A 60-degree skew angle is approximately the intersection angle where intersection pavement area for a skewed intersection doubles relative to a 90-degree intersection. This is thought to be a reasonable threshold upon which the designer should be alerted to issues associated with large pavement areas at intersections. The Level 2 warning for vehicle turn path is based on the presence of large vehicles in the traffic stream and the likelihood that the intersection skew angle will present turning-path issues for large vehicles. When these conditions exist, the user should be prompted to confirm the proposed geometry using turning-vehicle templates or a software package. Supplementary Information for the User No additional information is expected to be made available to the user through the help system. References 1. A Policy on Geometric Design of Highways and Streets (Green Book). American Association of State Highway and Transportation Officials, Washington, DC, 1994 (Table IX-1, Minimum Edge of Traveled Way Designs for Turns at Intersections, pp. 648-649). 4.25 Approach Alignment Differs Between Opposing ApproachesDescription The change in approach alignment model is proposed for use in IDRM to deal with forced directional changes for through vehicles as they proceed through an intersection. Forced directional changes may be difficult for unfamiliar drivers to navigate. Concern Type Leg concern Geometric Elements Involved
Associated Accident Types The following accident types are associated with a change in alignment between opposing intersection approaches:
Model(s) Used The models used to check the opposing approach is the change in approach alignment between opposing approaches model (Section 3.19). Evaluation Variable The variable used to evaluate this concern is the change in approach alignment between intersection legs (degrees). Evaluation Procedure The following general steps would be undertaken by IDRM to utilize the change in approach alignment model:
Threshold Values Threshold values are established on the basis of design speed for an approach leg to the intersection. For design speeds less than or equal to 70 km/h (40 mi/h):
Concern Statement Message Approach alignment differs between opposing approaches on ____ leg Basis The basis for the warnings is that the designer should be alerted to the fact that intersections with substantial changes between approach alignments can produce operational and safety problems. Thresholds are based on the judgment of the researchers. The degree of acceptable deflection is related to the potential speed of a vehicle. A 2-degree deflection angle between approach alignments approximates a 70-km/h (40-mi/h) design speed for a through roadway and a 5-degree deflection angle is approximately a 40-km/h (25-mi/h) design speed for the through roadway. Supplementary Information for the User No additional information is expected to be made available to the user through the help system. References
4.26 Insufficient Queue StorageDescription A traffic operational model is needed to identify situations in which expected queues of vehicles will pose an unusual hazard because of the presence of a particular geometric condition or feature. A queue-prediction model would estimate a level of queuing for a given approach-traffic volume and translate that volume to a design dimension. Concern Type Leg concern Geometric Elements Involved
Associated Accident Types The following accident type is associated with insufficient queue storage:
Model(s) Used The model used to determine if there is sufficient queue storage is the queue length prediction model presented in Section 3.20. Evaluation Variable The variable used to evaluate this concern is the length of the queue. Evaluation Procedure The following steps are required to evaluate the queue storage model: 1. Obtain the percentage of large vehicles turning left on the unstopped approaches. 2. Obtain design-hour traffic volumes for both directions of travel on the unstopped approaches: – Design-hour traffic volume information obtained for each unstopped intersection approach. – Design-hour traffic volume information needed for left turns and the sum of through and right-turning vehicles for each unstopped approach. 3. Obtain the expected number of queued left-turning vehicles based on the volume conditions from Figure 8 : – Chart can be shown to the user or answer can be selected by the program. – Chart inputs are left turns on major, unstopped approach vs. through/right-turning vehicles on opposite major, unstopped approach. 4. Translate the expected number of queued vehicles obtained from the look-up table into a predicted queue dimension: – Dimension calculated will be based on the truck percentage from Step 1. If the percentage of trucks turning left is less than 10 percent, use a vehicle length of 8 m. If the percentage of trucks turning left is 10 percent or more, use a vehicle length of 10 m. – Total queue length is the number of queued vehicles multiplied by the vehicle length. 5. Get the actual storage length for the left-turn lane. This will be the full-width portion of the turn lane. 6. Compare the predicted queue dimension to the actual storage length and generate the appropriate message based on the thresholds noted below. Threshold Values A Level 2 advisory is generated if the predicted queue dimension is greater than 75 percent of the available queue storage dimension. A Level 1 advisory is generated if the predicted queue dimension exceeds the available queue storage dimension. Concern Statement Message Insufficient queue storage for left-turn lane for __ leg Basis The basis for establishing queue lengths are Highway Capacity Manual procedures for unsignalized intersections. Supplementary Information for the User No additional information is expected to be made available to the user through the help system. References
4.27 Loss of Control Potential Due to Frequent BrakingDescription At intersections on horizontal curves and intersections with horizontal curves on the intersection approach, the driver's capacity to brake may be limited because the vehicle is simultaneously braking and cornering. The purpose of this procedure is to determine whether the combination of braking and cornering that may occur when an intersection is on or near a curve is likely to result in vehicle loss of control due to skidding. Concern Type Leg concern Geometric Elements Involved
Associated Accident Types The following accident types are associated with skidding on horizontal curves:
Model(s) Used The model used to determine if there is a sufficient margin of safety against skidding due to combined braking and cornering is presented in Section 3.21. Evaluation Variable The evaluation variable is the speed margin of safety (Vms) against skidding due to combined braking and cornering. Evaluation Procedure The evaluation procedure is to determine the value of Vms and compare it to the threshold values given below. Threshold Values If Vms £20 km/h and Vms > 10 km/h, then display a Level 2 advisory. If Vms £10 km/h, then display a Level 1 advisory. Concern Statement Message Loss of control potential due to frequent braking for __leg Basis The thresholds are based on the judgment of the expert team. Supplementary Information for the User None known at this time. References
|
||||||||||||||||||||||||||||||||||||||||||||||||||||||||||||||||||||||||||||||||||||||||||||||||||||||||||||||||||||||||||||||||||||||||||||||||||||||||||||||||||||||||||||||||||||||||||||||||||||||||||||||||||||||||||||||||||||||