U.S. Department of Transportation
Federal Highway Administration
1200 New Jersey Avenue, SE
Washington, DC 20590
202-366-4000
Federal Highway Administration Research and Technology
Coordinating, Developing, and Delivering Highway Transportation Innovations
 |
| This report is an archived publication and may contain dated technical, contact, and link information |
|
Publication Number: FHWA-RD-03-042
Date: November 2003 |
A Review of Pedestrian Safety Research in the United States and AbroadFinal Report
Part 3. Overview of Pedestrian Crash Countermeasures and Safety ProgramsCautions Regarding Design Problems in Studies of Countermeasure EffectivenessThis report is based on a review of many evaluation studies of pedestrian safety initiatives, so it is useful to comment on the difficulties inherent in this kind of research and the study design problems that plague such research efforts. First, research on the effectiveness of pedestrian safety initiatives is inherently difficult because pedestrian crashes are generally quite rare at any given location; therefore, a study may not have enough data for numerical stability. It is common that years will pass between instances of a pedestrian-vehicle collision at a given site. While the rarity of pedestrian collisions at a site is fortunate, it makes the study of countermeasures difficult. To compensate for small numbers, investigators often aggregate data from many sites. Many intersections will be studied, and the study period will be extended for as long as possible because this is the only way that usable numbers of crashes can be accumulated. However, such aggregation of sites and long time periods creates other sources of crash variability, perhaps partly offsetting the benefit of the larger sample size. The other significant problem is the almost inevitable study design flaws in many research efforts. These critical study design flaws include selection bias and regression to the mean. These particular study design problems generally are encountered because of the procedures used to decide where to install treatments. Given limited funds and great needs, authorities earmark countermeasure sites based on some kind of priority procedure. It may be a formal warranting procedure, or an informal approach of placing the remedies where the problem is judged to be greatest. This latter procedure is prudent, and is completely justified from an operational standpoint. However, from a research standpoint it can be troublesome, especially in assessing pre- and post-treatment data. The problem is that the sites where the treatments are introduced were usually different from the comparison sites before the interventions were introduced. That is why the treatments were put there rather than somewhere else. This pre-existing difference is very likely to overwhelm the effect of the treatment. If the "after" experience is different from the "before" experience, one cannot know how much of the change was produced by the treatment and how much is a continuation of the pre-existing difference. A special case of selection bias is regression to the mean. If the pretreatment collision record is the basis for introducing an intervention at a particular site, and if the "worst" sites are selected for introduction of countermeasures, then the after-crash experience will be better than before the experience because of the operation of the probability phenomenon called "regression to the mean." When that particular flaw is embedded in a study design, one cannot know whether the favorable results are from the countermeasure, from the regression effects, or from a combination of the two. Many studies reviewed herein likely suffer from one or the other of these study design flaws. This is not said as a particular criticism of the study authors: Sometimes it is virtually impossible to carry out a study without such flaws, given the manner in which operational decisions are made to install treatments. If studies are to be done in a way that avoids these study design problems, it will be necessary to change the manner of deciding how treatments are to be introduced. These study design problems are not mentioned in many following reviews, but the reader should keep these cautions in mind in assessing the studies reported in the following discussion.
Marked CrosswalksCrash StudiesZegeer, Stewart, Huang and Lagerwey (2002) have completed what is the largest and most comprehensive study of marked crosswalks reported so far. The authors analyzed data from 1,000 marked crosswalk sites and 1,000 matching unmarked sites in 30 U.S. cities. Information was collected at each of the 2,000 sites, including pedestrian crash history (average of five years per site), daily pedestrian volume, traffic volume, number of lanes, speed limit, area type, type of median, type and condition of crosswalk marking, location type (midblock vs. intersection), and other site characteristics. All study sites were at intersection or midblock locations with no traffic signals or stop signs on the approaches. The comparatively large sample size permitted analysis of relevant data subsets. A number of site factors were found to be related to crashes and therefore had to be used as control variables in the analysis. Such factors included: higher pedestrian average daily traffic (ADT), higher traffic ADT, and number of lanes (three or more lanes vs. two lanes). In addition, multilane roads with raised medians had significantly lower crash rates than similar roads with no median or painted medians only. There was also a significant regional effect: Sites in western U.S. cities had a significantly higher crash risk than in eastern U.S. cities (after controlling for other site conditions).
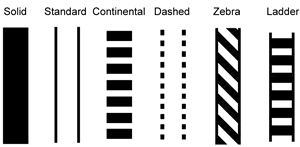
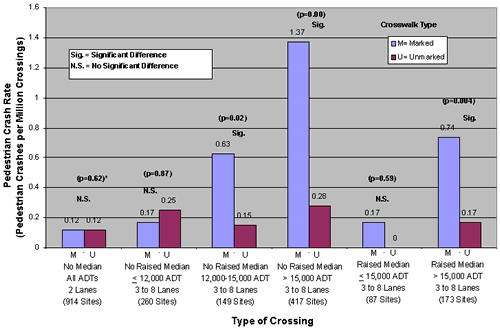
Some site factors were not found to be associated with crashes in and of themselves. These included area type, speed limit, and type of crosswalk marking pattern (see figure 12 for various crosswalk marking patterns from that study). All site factors that were related to crashes (i.e., pedestrian ADT, traffic ADT, number of lanes, median type, and region of the country) were then included in the statistical models used to determine effects of marked vs. unmarked crosswalks. (Poisson and negative binomial regression models were used.) The study found that on two-lane roads, the presence of a marked crosswalk alone at an uncontrolled location was associated with no difference in pedestrian crash rate, compared to an unmarked crosswalk. Further, on multilane roads with traffic volumes above about 12,000 vehicles per day, having a marked crosswalk alone, without other substantial improvements,was associated with a higher pedestrian crash rate after controlling for other site factors, compared to an unmarked crosswalk (see figure 13). Raised medians provided significantly lower pedestrian crash rates on multilane roads, compared to roads with no raised median. Older pedestrians' crash rates were high relative to their crossing exposure. The authors state (page 1): "Pedestrians are legitimate users of the transportation system, and they should, therefore, be able to use this system safely. Pedestrian needs in crossing streets should be identified, and appropriate solutions should be selected to improve pedestrian safety and access." Some improvements suggested by the authors at unsignalized crossing locations:
Two studies by Knoblauch were conducted on pedestrian and motorist behavior as part of the overall FHWA study on crosswalks in conjunction with the study summarized above. One study was conducted to determine the effect of crosswalk markings on driver and pedestrian behavior at unsignalized intersections (Knoblauch, Nitzburg, and Seifert, 2000). A before-and-after evaluation of crosswalk markings was conducted at 11 locations in 4 U.S. cities. Behavior observed included: pedestrian crossing location, vehicle speeds, driver yielding, and pedestrian crossing behavior. The authors found that drivers approach a pedestrian in a crosswalk somewhat slowly, and that crosswalk usage increases after markings are installed. No evidence was found indicating that pedestrians are less vigilant in a marked crosswalk. No changes were found in driver yielding or pedestrian assertiveness as a result of adding the marked crosswalk. Marking pedestrian crosswalks at relatively low-speed, low-volume, unsignalized intersections was not found to have any measurable negative effect on pedestrian or motorist behavior at the selected sites, which were all 2- or 3-lane roads with speed limits of 35 or 40 mph. In a comparison study, a before-and-after evaluation of pedestrian crosswalk markings was performed in Maryland, Virginia, and Arizona (Knoblauch and Raymond, 2000). Six sites were selected that had been recently resurfaced. All sites were at uncontrolled intersections with a speed limit of 56 km/h (35 mi/h). "Before data" were collected after the centerline and edgeline delineation was installed but before the crosswalk was installed. "After" data were collected after the crosswalk markings were installed. Speed data were collected under three conditions: no pedestrian present, pedestrian looking, and pedestrian not looking. All pedestrian conditions involved a staged pedestrian. The results indicate a slight reduction at most, but not all, of the sites. Overall, there was a significant reduction in speed under both the no-pedestrian and the pedestrian-not-looking conditions. These more recent studies must be considered in the context of contradictory results among several earlier studies. The above study shows that marked crosswalks do not differ in safety from unmarked crosswalks under most circumstances, while in the high-volume, multilane case, the use of marked crosswalks alone is associated with increased pedestrian risk. This does not fully agree with several other studies that reported that marked crosswalk crashes in general were much more frequent than at unmarked crosswalks. However, most of the older studies typically did not analyze the effects of marked crosswalks as a function of number of lanes, traffic volume, or other roadway factors. For example, Herms (1972) authored an early and oft quoted (and sometimes mis-quoted) study from San Diego, CA, reporting that crashes on marked crosswalks were twice as frequent per unit pedestrian volume. In this study, 400 intersections were selected, each having one marked and one unmarked crosswalk leg on the same street. Herms made no mention in 1972 of warrants used to determine where to paint crosswalks, but an earlier version of the study did (Herms, 1970). The warrant directive for San Diego (January 15, 1962) established a point system calling for painting crosswalks when: 1) traffic gaps were fewer rather than more numerous; (2) pedestrian volume was high; (3) speed was moderate; and (4) "other" factors prevailed, such as previous crashes. Thus, it is possible that crosswalks may have been more likely to be painted in San Diego where the conditions were most ripe for pedestrian collisions, compared to unmarked sites. In a 1994 study, Gibby et al. revisited the issue in an analysis of crashes at 380 California highway intersections. These were picked in a multi step selection process from among more than 10,000 intersections. Results showed that crash rates at the selected 380 unsignalized intersections were 2 or 3 times higher in marked than in unmarked crosswalks when expressed as crash rates per pedestrian vehicle volume. Other studies on crosswalk effects have also been conducted. Gurnett (1974) described a project to remove painted stripes from some crosswalks that had shown a bad crash experience in the recent past. This is a before after study of three locations picked because they had a recent bad crash record. Crosswalk paint was removed. Subsequent crashes were tallied and fewer were found. The findings of this study are likely an artifact of the well known statistical phenomenon of regression to the mean. Another study of marked crosswalks at non signalized intersections was reported by the Los Angeles County Road Department in July, 1967. In a before after study of 89 intersections, painted crosswalks were added at each site. Collisions increased from 4 during the before period to 15 in the after period. All sites that showed crash increases after crosswalks were installed had ADT of less than 10,900 vehicles. At sites with smaller ADT volume, no change in crashes was seen. (NUMBERED NOTE) The above finding regarding ADT above approximately 11,000 is consistent with the findings of Zegeer, Stewart, and Huang and Lagerwey (2002) reported at the beginning of this section. Moreover, Zegeer et al. attempted to compare their results with those of Herms. They lumped all their study sites together and computed a simple ratio of crashes divided by pedestrian crossing volume, as did Herms. By replicating the Herms analysis method on the 2000-site (30-city) data set, they too found the marked crosswalks were worse by slightly more than 2-to-1 than the unmarked. It is only when the data were disaggregated (and more appropriate Poisson and negative binomial modelling analyses were done) that it was seen that higher pedestrian crash risk of marked crosswalks is confined to the high volume, multi lane case. In contrast to the foregoing, however, Tobey and colleagues (1983) reported reduced crashes associated with marked crosswalks. They examined crashes at marked and unmarked crosswalks as a function of pedestrian volume (P) multiplied by vehicle volume (V). When the P x V product was used as a denominator, crashes at unmarked crosswalks were overrepresented, and considerably underrepresented at marked crosswalks. Communication with the authors indicates that this study included controlled (signalized) as well as uncontrolled crossings. It seems likely that more marked crosswalks were at controlled crossings than were unmarked crosswalks, which could partially explain the different results compared to other studies. It should be noted that the study methodology was useful for determining pedestrian crash risk for a variety of human and location features. It was never intended, however, to be used for quantifying the specific safety effects of marked vs. unmarked crosswalks for various traffic and roadway situations. Results of a study of pedestrian crossings in London, England calculated crash risk as the ratio of crashes per unit time to pedestrian volume counts (Mackie and Older, 1965). The authors found that the risk was lower in zebra crosswalks than in areas up to 45.7 m (50 yards) away from the crosswalks. There was a gradient effect, with crash risk highest nearer to the zebra crossing, but the risk was lower in the crossing. They found similar results for zebra crossings near a signalized crossing. However, Ekman of the University of Lund in Sweden found in 1988 that "a pedestrian experiences approximately a double risk of being injured when crossing on a zebra crossing compared to a crossing location without any signs or road markings, presupposed that all other conditions are equal." Ekman contrasted his results with those from a similar Norwegian study, which reported that pedestrian risk associated with Norwegian zebra crossings was significantly lower than on the Swedish counterparts. In 1985, Yagar reported the results of introducing marked crosswalks at 13 Toronto, Ontario, intersections. The basis for selecting the intersections was not described. A before after study was carried out and it was found that crashes had been increasing during the before period and continued to increase at the same pace after crosswalks were installed. It would appear that marking the crosswalks did not have much of an effect. However, the author pointed to an increase in tailgating crashes after crosswalk painting. He also reported that the increased crashes during the after phase seemed to be explained by involvement of out of town drivers. It is difficult to summarize these disparate findings, but it can be said that marked crosswalks have little or no association with pedestrian crash risk on two-lane roads and also on multilane roads with ADT less than approximately 10,000. However, for multilane facilities with ADT greater than 10,000, a significant crash risk is associated with using marked crosswalks alone without other, more substantial pedestrian safety treatments.
Behavioral Studies
It is logical to expect behavioral studies of driver and pedestrian reaction to marked crosswalks in view of the counterintuitive crash results reported in the literature. In his 1972 study, Herms stated: "Evidence indicates that the poor crash record of marked crosswalks is not due to the crosswalk being marked as much as it is a reflection on the pedestrian's attitude and lack of caution when using the marked crosswalk." No behavioral data were presented in that study, however. Other authors advanced similar assertions with regard to pedestrian behavior in marked crosswalks (Public Works, 1969) (Los Angeles County Road Department, 1967). In a 1994 study, Gibby et al. provided a thorough review of the literature including behavioral studies. Some are reviewed here in a separate consideration of pedestrian vs. motorist behavior. PEDESTRIAN BEHAVIOR In 1999, Knoblauch and his colleagues carried out a study intended to directly observe incautious or reckless pedestrian behavior, such as Herms and others postulated to exist, and that might account for the negative crash results reported in some studies. They found no such behavior (Knoblauch, 1999). The research team collected data at eleven sites before and after crosswalks were marked. They measured vehicle speed and volume, pedestrian volume, and recorded pedestrian and motorist behavior. Their study addressed three hypotheses related to pedestrian behavior: Hypothesis: Will pedestrians, perhaps feeling more protected, act more aggressively when crossing a marked crosswalk compared to one not marked? No difference was seen in blatantly aggressive pedestrian behavior whether the crossing was marked or not. Hypothesis: Will pedestrians keep in the corridor defined by the stripes? Pedestrians walking alone tended more to use marked crosswalks, especially at busy intersections. Pedestrians in groups tended not to use the marked crosswalks. Overall, crosswalk usage increased once markings were in place. Hypothesis: Will marked crosswalks result in less pedestrian "looking behavior," perhaps because they feel more protected? Looking behavior increased significantly after crosswalk markings were installed. No evidence was seen that the pedestrians were less vigilant in a marked crosswalk compared to one not marked. The findings are generally consistent with an earlier study that likewise addressed pedestrian looking behavior and how well they kept within the area defined by the markings (Knoblauch et al., 1987). Of one case study, these authors said, "The analysis of behavioral data indicates that there were little or no changes in pedestrian behavior resulting from the installation of the pedestrian crosswalk markings." (p. 21) Of a second case study, the authors said, "...pedestrians tended to stay in the crosswalk. There was no change in the number of pedestrians looking before entering the roadway; fewer pedestrians continued to look during the first half of the crossing. There was no change in looking behavior during the second half of the crossing. (pp. 25 26) Hauck (1979) reported a before after study done in Peoria, IL, in which 17 crosswalks at traffic signals were re painted. Operational evaluation at the sites showed a general decrease in both pedestrian and motorist violations when comparing "before-and-after results. It was found that the percentage of pedestrians who stepped out in front of traffic during the after period decreased at 12 of the 17 locations; crossing against the DON'T WALK phase (signalized intersections) decreased at 13 of the 17 locations, though jaywalking was unchanged. These studies show pedestrian behavior to be generally better in the presence of marked crosswalks Certainly there is no indication of incautious or reckless pedestrian behavior associated with the marked crosswalks. What would be of interest, however, would be a study of pedestrian behavior at the kind of high ADT multilane facility where crashes at marked crosswalks were significantly higher than at unmarked. A study under those circumstances might not be advisable, however. It should be noted that the study by Zegeer and colleagues found that much of the increase in pedestrian crashes at marked crosswalks on multilane roads (above 10,000 ADT) involved "multiple-threat" crashes, where a vehicle stops in the curb lane to let a pedestrian cross and the pedestrian steps into the street and is struck by a vehicle in the adjacent lane (whose view of the pedestrian is blocked by the stopped vehicle). Some agencies have used an advance stop bar with the sign STOP HERE FOR PEDESTRIANS to improve sight distance (i.e., when stopping vehicles stop further back from the crosswalk) and reduce the risk of this type of crash. MOTORIST BEHAVIOR Motorist behavior changes at marked (vs. unmarked) crosswalks, have been studied by looking at speed (with and without pedestrians present), yielding, and other factors. In 1998, Knoblauch reported results of speed measurements at six locations before and after crosswalk markings were applied. Some measurements were made with no pedestrians present, some with a pedestrian present and looking at traffic (the pedestrian was a member of the research team) and another condition in which the pedestrian approached and stood at the edge of the curb, looked straight across the road and not at traffic. The results were not clear cut. Traffic behavior at the sites was not consistent. One site showed a considerably slower speed after the markings were painted even though no pedestrian was present. This speed change was unexpected and could not be explained; such changes were not seen at other crossings. When the pedestrian was present and looking at traffic, the result summed over all six sites was a small speed decrease of less than 1 kph (.6 mph), which was not statistically significant. However, one site showed a significant decrease in speed and one showed a significant increase. The author pointed out that given the overall speed of the vehicles and the point at which the measurements were taken, a reasonable driver would assume that a pedestrian looking at traffic would not begin to cross. The driver would therefore see no need to slow down. When the driver was present and not looking, however, overall the speeds were about 4 kph (2.5 mph) lower after the markings were applied; a statistically significant change. The author concluded that drivers are aware of and respond to the crosswalk markings in most cases, particularly when a pedestrian is present but does not look toward the motorist. In a 1999 study, Knoblauch and colleagues observed motorist behavior to address two questions:
Ekman reported in 1988 that motorists in Sweden did not reduce their speeds when approaching zebra crossings. Insofar as this study measured vehicle speed when no one was present in the crosswalk or at the curb, one might expect speed to change little or not at all. In another 1996 Swedish study, Varhelyi measured motorist behavior at non signalized zebra crossings. He reported that in 73 percent of "critical" cases, the vehicle maintained or even increased speed and in only 27 percent of cases did they slow down as required. Despite what the motorists actually do, it was found in a separate survey that motorists in 67 percent of the cases say they "always" or "very often" slow down. In 1992, Van Houten studied factors that might influence motorists to yield for pedestrians in marked crosswalks. He measured several behaviors at intersections in Dartmouth, Nova Scotia, where a series of interventions was sequentially introduced to increase the vividness of crosswalks. First signs were added, then a stop line, and then amber lights activated by pedestrians and displayed to motorists. The percentage of vehicles stopping when they should do so increased by amounts up to 50 percent. Conflicts dropped from 50 percent to about 10 percent at one intersection and from 50 to about 25 percent at another. The percentage of motorists who yielded increased from about 25 percent up to 40 percent at one intersection and from about 35 to about 45 percent at another. Malefant and Van Houten studied in 1989 ways to increase the percentage of drivers who yield to pedestrians. An experiment was conducted in St. John's, Newfoundland, and Fredericton and Moncton Dieppe, New Brunswick, Canada. Countermeasures included additional markings, feedback to the pedestrians as to compliance, warning signs for motorists, and enforcement. Associated with these multiple interventions were large increases in the proportion of motorists who yielded to pedestrians, ranging from 50 percent (before) to 70 percent (after) in one city; from 10 to 60 percent in another, and from 40 to 60 percent in the third. In 1975, Katz et al. carried out an experimental study of driver-pedestrian interaction when the pedestrian crossed. The pedestrians in question were members of the study team and they crossed under a variety of conditions in 960 trials. It was found that drivers stop for pedestrians more often when the vehicle approach speed is low, when the pedestrian is in a marked crosswalk, when the distance between vehicle and pedestrian is greater rather than less, when pedestrians are in groups, and when the pedestrian does not make eye contact with the driver. Cynecki and Associates, 1993 reported the results after rumble strips were installed in advance of marked crosswalks. The strips were placed at 19 uncontrolled locations. After installation, there was little change in vehicle speed. The authors also reported that 85th percentile speeds showed essentially no change. Presumably most of the time when the motorist encountered the rumble strip, the marked pedestrian crosswalk ahead would have been empty.
Assessment of LiteratureIt appears that there is a greater crash risk associated with marked crosswalks alone (i.e., if no other substantial improvement also is present) on multi lane facilities with ADT greater than approximately 10,000. Otherwise, it appears that marking a crosswalk has no clear effect one way or another on pedestrian crashes. The apparent large negative effect reported by earlier authors disappears on two-lane roads and multi-lane roads having ADT's below approximately 10,000. The pedestrian behavior hypothesized to account for the negative results was not observed under the circumstances discussed.
Alternative Crossing TreatmentsInnovative approaches to pedestrian crossing protection were tested in Detroit, MI (Malo et al., 1971). Combinations of signing, marking, lighting, and pedestrian signal actuation were installed. The alternative configurations included overhead signs with internal illumination, flashing beacons, and pedestrian signals. Thirteen sites were chosen on the basis of poor crash records and/or judgment that indicated an unusual hazard. Implementation of the devices was preceded by a considerable educational and publicity effort by the Traffic Safety Association of Detroit, using leaflets, demonstration installations, press releases, and other public information methods. Field measurements included approach speeds, gaps, volumes, driver response (slowing), pedestrian attributes, gap acceptance, and behavior. In addition to the engineering studies, opinion surveys were conducted of both pedestrians and drivers as well as evaluations by experts.
The engineering studies led to the following findings:
Interviews of pedestrians and drivers showed drivers were usually satisfied with the devices, but pedestrians were not satisfied with driver response. It was concluded that drivers did not expect to have to stop or slow down significantly unless a traffic signal or stop sign were in use. Pedestrians expected traffic to slow down when the device was activated. A study of special crosswalks was conducted in five major Canadian cities (Braaksma 1976). Four evaluation criteria were used-safety, delay, aesthetics, and cost. Special crosswalks were defined as those with some extra features in the form of overhead signs and lighting, pavement markings, parking prohibitions, or, in some cases, special laws. The best system of performance rating per unit cost was in Toronto. Excluding cost, the Calgary system performed best. The Toronto system consisted of pavement markings and roadside signs. Large "Xs" were marked on the pavement in each lane 30.5 m (100 ft) back on the approach to the crosswalk. The stripe widths were between 304.8 mm and 508 mm (12-20 in), and the X was 6.1 m (20 ft) long. A standard advanced pedestrian crossing warning sign was mounted adjacent to the X at the roadside. The crosswalk was marked no less than 2.44 m (8 ft) wide with two 152.4-mm to 203.2-mm (6-8 in) stripes, 2235.2 mm (88 in) apart, delineating each side of the crosswalk. The Calgary system employed a large overhead sign bearing the word PEDESTRIAN with two large "Xs" on either side of the word. On either side of the "Xs" were mounted 203.2-mm (8-in) flasher units. Below the word PEDESTRIAN a smaller flasher was mounted for pedestrian viewing. The flashers were activated by a pedestrian button having an appropriate sign instructing the pedestrian to push the button and cross with caution. Standard crosswalk markings were employed. A sign was post mounted at the roadside 45.75 m - 76.25 m (150 ft to 250 ft) before each approach, containing the words WHEN LIGHT FLASHING-MAXIMUM 20*-DO NOT PASS-HERE TO CROSSWALK. A flasher was placed above the sign. The flasher was also activated by the pedestrian button. Before-and-after studies in Toronto showed a marked decline in pedestrian fatalities, although two hazardous behavior patterns were noted. First, some pedestrians would step off the curb without signaling their intention to cross the roadway; they apparently expected vehicles to stop instantaneously. Second, pedestrians noted that vehicles passed each other just before the crosswalk. The need for consistent laws regarding crosswalks, pedestrian, and driver education in this regard, and improved enforcement, were also cited. Illuminated crosswalk signs were installed and evaluated at 20 locations in Tokyo, Japan, using before-after comparisons of crashes (Accident Prevention Effects, 1969). Findings show both pedestrian crossing-related and other unrelated crashes increased after the installation of the signs by 4.8 and 2.4 percent, respectively, in 200-m (218-yd) sections on either side of the installation. Both crash types increased 11.4 percent in 50-m (55-yd) sections. It was concluded that the illuminated crosswalk signs did not seem to be effective in reducing crashes; whether this type of device increases crashes, however, is unclear, as the average annual rate of crash growth on major streets in Tokyo is approximately 24 percent.
Crosswalk IlluminationA two-stage study of floodlighting of pedestrian crossings was conducted in Perth, Australia (Pegrum, 1972). A pilot study showed sufficient success to initiate a broader scale lighting program. Sixty-three sites were studied. The illumination consisted of two floodlights, one on each side of the roadway, on either side of the crosswalk, mounted about 3.66 m (12 ft) from the crosswalk at a height of 5.185 m (17 ft), and aimed at a point .915 m (3 ft) above the pavement. The luminaire was a 100-watt sodium lamp. The ambient lighting was not from sodium luminaires. The author found sodium floodlighting resulted in a significant decrease in nighttime pedestrian crashes, as shown in table 25. A combined illumination and signing system for pedestrian crosswalks was developed and tested in Israel (Polus and Katz, 1978). The nighttime crash change at the 99 illuminated study sites and 39 unilluminated control sites is shown in table 26 on the following page. The reductions were concluded to be primarily due to the illumination, since daylight crashes were relatively unchanged. Other threats to validity were checked, including changes in pedestrian and vehicle flow, weather differences, and national crash trends. None of these showed any effect on the results. *The sign indicating "maximum 20" refers to kph.
A study in Philadelphia assessed the impacts of installing improved lighting at seven sites (Freedman et al., 1975). The impacts were evaluated on the basis of behavior as measured for 728 pedestrians and 191 drivers at the 7 study sites and 7 control sites. The study sites were high-crash locations, while the control sites were low-crash locations. The illumination improvement consisted of 90-watt low-pressure sodium lamps. Each system was controlled by a photocell that energized the circuit at sundown and turned it off at sunrise. Experimenter override was possible. The evaluation was conducted using two primary comparisons of pedestrian attribute changes. One approach used five basic factors-search behavior, crossing path, concentration, erratic behavior, and clothing brightness. The results of comparing the five basic factors before and after lighting improvements showed that "perceived clothing brightness" increased significantly on the basis of all comparisons for high-crash locations with the installation of the special illumination. Observers searching the street in a fashion similar to drivers perceived the general appearance of pedestrians as brighter. There was significant improvement in the apparent concentration of pedestrians to the crossing task at all signalized locations. Search behavior was found to improve significantly under all conditions. Drivers appeared more aware of approaching hazardous crosswalks when the illumination was present. It should be noted that the crash data changes in both groups moved as if toward the mean, consistent with what would be expected since one group consisted of high-crash sites and the other low-crash sites. However, the behavioral measures should not have been influenced by regression to the mean.
Barriers, Signals, and Signage to Restrict Pedestrian MovementsMedian BarriersAs part of a test of various countermeasures, median fence barriers were installed at two sites (Washington, D.C., with a 1.22-m-[4-ft-] high fence, and New York City, with a 1.83-m- [6-ft-) high fence) (Berger, 1975). One site had two gaps at intersecting minor streets. After installation of the barrier, 61 percent of the pedestrians identified the barrier as the reason for using the crosswalk. When asked whether the barrier affected the manner in which they crossed the street, 52 percent stated it had no effect, while 48 percent indicated the only effect was to force them to cross at the intersection. Of those who were crossing midblock before the installation, 61 percent did so out of convenience. About one-third indicated they would use the crosswalk only if midblock traffic were "very heavy." After the fence was installed, 32 percent of the 22 pedestrians interviewed who previously made midblock crossings stated inconvenience as the major factor, with high turning volume at the intersection as a close second (23 percent). Older pedestrians were generally concerned with the intersection turning-traffic problem. Many cited recent crash experience. Almost one-quarter of those interviewed indicated they had walked along the median to the end of the barrier, or an opening, before completing the crossing. While merchants at a control site did not indicate anticipating much effect from a median barrier, 58 percent of those at the experimental sites indicated their belief that its major effect was to discourage customers from shopping both sides of the street. Most residents accepted the barrier. Only 7 percent wanted it removed. A few complained about inconvenience and its unsightly appearance.
Freeway BarriersAs part of the analysis of freeway pedestrian crashes, attempts were made to estimate the maximum national impact of right-of-way fencing and/or median barriers on freeway crashes if these pedestrian barriers were employed and were completely effective in controlling crashes identified as related to this countermeasure (Knoblauch et al., 1978). The field investigators estimated that 14 percent of freeway pedestrian crashes were susceptible to this countermeasure. One analysis of the crash types and the contributing factors suggested that these countermeasures could address between 160 and 222 of these usually severe nationwide crashes per year.
Roadside/Sidewalk BarriersChains, fences, guardrails, and other similar devices have been proposed in several studies as a means for channelizing and protecting pedestrians (Knoblauch, 1977; Snyder and Knoblauch, 1971; Knoblauch et al., 1978; Model Pedestrian Safety Program, 1987 edition). Parking meter post barriers were tested at three sites in urban areas (Berger, 1975). All involved use of chains that connected parking meter posts. The barrier was .9 m (3 ft) high and involved 1, 2, or 3 chains. In Washington, DC, 6 parking meter post barriers were created on one side of a street, resulting in a series of 3.66-m (12-ft) long single chain sections. In New York City, 19 posts were utilized, 9 on one side of the street and 10 on the other. These were 3.66-m- (12-ft-) sections with 2 chains. The third site was a section of one-way street along which three-chain sections were installed on eight posts. The results were mixed. A vandalism problem (stolen chains) interfered with the experiment, a noteworthy concern. Twenty-six percent of those interviewed who crossed at the intersections after the installation mentioned that a factor in their choice of crossing location was the illegality of crossing elsewhere. Since only 12 percent had mentioned this before the change, the barriers may have reminded pedestrians that it is illegal to jaywalk. While 65 percent of merchants perceived no negative effects from the countermeasure, 15 percent noted interference to street crossing, and 18 percent cited a problem when loading or unloading goods. In London, research was done on a 548.4-m (600-yd) road segment that had been provided with pedestrian barriers on both sides (Jacobs, 1966). The access openings were not directly across from each other. Pedestrian crossing movements were mapped and crash data were compiled. Crashes during the previous 8 years were shown as a ratio to 4-hour pedestrian volume, fewer than 20,000 people. The resulting risk ratio was compared with that for 11 other sites in London that did not have pedestrian barriers. The only significant differences occurred at points within 45.7 m (50 yds) of a signalized intersection (more than twice the risk ratio with the pedestrian barrier) and at other midblock locations within 18.28 m (20 yds) of an intersection where controlled crossings were not present and approximately 10 times the risk ratio. The overall risk ratio was lower at the test site but was not found to be statistically significant. The longitudinal path taken by each pedestrian was studied. This was the distance between barrier openings used to get on and off the roadway, measured parallel to the curb. The results indicate most pedestrians would cross away from the crosswalk when the longitudinal distance between barrier openings on either side of the street was less than 9 m (10 yds). It was suggested by the author that longitudinal distances between the openings on opposite sides of a street be greater than 9 m (10 yds). Pedestrian barrier fences were installed along 18 sections of road in Tokyo (Accident Prevention Effects, 1969). Crashes were analyzed before and after the installation. Crashes related to crossing pedestrians declined by nearly 20 percent. An overall 4-percent reduction was observed, including non-pedestrian crashes. It had been thought that even though crashes related to pedestrians' crossing out of crosswalks might decrease, crashes related to pedestrians crossing in the crosswalks might increase. The results indicated both types of pedestrian collisions were reduced equally by 20 percent.
SignalizationSignals are widely employed to direct and assist pedestrians at crossings. A study of 30 locations in Tokyo where pedestrian-activated signals were installed showed that crashes declined by 37.5 percent (Accident Prevention Effects, 1969). Little difference was noted in the severity of crashes between the before and after periods. The effective range of the signal influence seems to be between 25-50 m (27-55 yds) on either side of the signal. The pedestrian-activated signals were found to be much more effective in reducing night crashes than daylight crashes. Rear-end vehicular crashes, which are usually expected to increase after signalization, decreased by 12 percent. Several behavioral studies of pedestrian signals have been conducted in the U.S. Most have found pedestrian compliance to be poor. One study compared pedestrian crossing behavior at sites with and without standard pedestrian signals (Mortimer, 1973). Observers noted specific behaviors twice on different days. A total of 24 sites in Detroit, MI, were analyzed, 12 of which had pedestrian signals. More than 3,200 pedestrians were observed. Illegal starts on amber/DON'T WALK were about 4 percent less at sites with pedestrian signals. The percent arriving at the far side of the green/WALK was 20 percent higher at the sites with pedestrian signals. An observational sampling study of pedestrian behavior at a site in Brooklyn, NY, noted any change occurring with the installation of a pedestrian signal (Fleig and Duffy, 1967). A before-after crash analysis was also performed on 11 additional sites at which pedestrian signals had been installed. Neither the behavioral analysis nor the crash analysis showed any significant difference between the before and after periods. As part of a behavioral analysis at a variety of intersections in Washington, DC, San Francisco and Oakland, CA (Petzold, 1977), observations were made of compliance with pedestrian signals at six intersections. Based on four intersections with pedestrian signals displaying a flashing WALK indication (550 pedestrians) and two intersections having steady WALK indications (139 pedestrians), no difference was observed between flashing and steady WALK signals in terms of pedestrian usage of the cycle. A very large portion of the users paid little, if any, attention to the pedestrian signal. This same study demonstrated that few pedestrians understand the meaning of flashing WALK and DON'T WALK pedestrian signals, whereas symbolic pedestrian signalization such as the walking pedestrian and upheld hand offers an improved understanding over word messages. One study showed that, at most, only about half of the pedestrians pressed the button to activate the WALK light (Palamarthy et al., 1994). A comparison was made in Massachusetts of the behavior of pedestrians at intersections with flashing and solid WALK segments of the pedestrian signals (Sterling, 1974). The sites were controlled by vehicle-actuated signals having a fixed pedestrian phase length. Sites with high pedestrian and traffic volumes were chosen. Pedestrians at the sites with flashing WALK were found to cross in a legal manner only 29 percent of the time compared with 51 percent who did so at the sites with a steady WALK indication. The percentage of crossings for which a vehicular conflict occurred was 6 percent for the steady indication and 8 percent for the flashing indication. This difference was statistically significant. An area-wide, centralized computer-controlled signal system was installed in West London. The impact on pedestrian safety and other impacts were studied (Crook, 1970). A significant 5-percent reduction in pedestrian crashes occurred in the experimental area while a 20-percent increase in pedestrian crashes occurred in a comparison (control) area. Studies in the U.S. and Israel have quantified the effects of pedestrian signals and signal timing on pedestrian crashes. The most comprehensive study involved the collection and analysis of pedestrian crashes, traffic and pedestrian volume, signal timing, roadway geometrics, and other data at 1,297 signalized intersections (2,081 total pedestrian crashes) in 15 U.S. cities. The following pedestrian signal strategies existed (Zegeer et al., 1982, 1983):
The study found that the factors significantly related to increased pedestrian crashes include higher pedestrian and traffic volumes, street operation (two-way streets have higher pedestrian crashes than one-way streets), wider streets, higher bus use, and greater percentage of turning movements. The presence of concurrently timed pedestrian signals had no significant effect on pedestrian crashes when compared with intersections with traffic signals alone. Sites with exclusive pedestrian signal timing had significantly lower pedestrian experience (about half as many) as sites with either standard timing or with no pedestrian signals. This exclusive timing scheme was effective, however, only at intersections with more than 1,200 pedestrians per day. The authors controlled for pedestrian volume, traffic volume, intersection geometrics, and other factors in their analysis. A summary of results for various signal timing schemes is given in table 27. Of possible relevance to the issue of early or late release timing is a study of pedestrian traffic conflicts at T intersections (Lord, 1996). This study confirmed earlier work that showed more pedestrian conflicts with left-turning vehicles at T intersections than at standard X intersections. Because left-turning traffic at T intersections has no oncoming vehicle traffic to cause a delay, the driver can initiate the turn immediately and may intercept a pedestrian who starts at the same time. At an X intersection, left-turning traffic may have to wait for oncoming vehicle traffic to pass, which may amount to an early release for the pedestrians. Zegeer and colleagues (1982, 1983) cite these explanations for the possible lack of effectiveness of concurrent signal timing:
The study concluded that highway agencies should not indiscriminately install pedestrian signals at all traffic signalized locations. Instead, the cost of pedestrian signals should be weighed against their effectiveness at a given location. On the other hand, the authors cite a need for pedestrian signals at some signalized locations (e.g., within established school crossings, wide street crossings, or where vehicle signals are not visible to pedestrians) as discussed in the Manual on Uniform Traffic Control Devices (1988). In a 1987 study from Israel by Zaidel and Hocherman, pedestrian crashes were used to compare the safety of various types of pedestrian signal options at signalized intersections in Tel Aviv, Jerusalem, and Haifa. These included sites with a concurrently-timed pedestrian signal, an exclusively timed pedestrian interval, and no pedestrian control. Extensive control data were collected for use in the analysis. A total of 1,310 pedestrian crashes and 5,132 vehicle crashes were analyzed at 320 intersections. The factors most strongly associated with higher pedestrian crashes include increased pedestrian and traffic volume and greater intersection complexity (as evidenced by number of intersection legs or number of conflict points). The type of pedestrian crossing provision was found to have only a slight effect on pedestrian crashes, and no effect on vehicle injury crashes, particularly where vehicle volumes were relatively low (i.e., less than 18,000 vehicles per day). Exclusively timed pedestrian signals showed evidence of crash reduction where high vehicle and pedestrian volumes existed.
A 1984 study by Robertson and Carter examined the safety, operational, and cost impacts of pedestrian signal indications at signalized intersections. The study was based on information obtained from existing literature, an analysis of pedestrian crashes, a delay analysis, and a benefit-cost analysis. The authors concluded that pedestrian signal indications appear to reduce pedestrian crashes at some intersections, have little or no effect at others, and even increase such crashes at other intersections. Also, while the presence of pedestrian signals apparently did not significantly offset pedestrian and vehicle delay, the operation of pedestrian and vehicular signals (i.e., signal timing) had a profound effect on delay. The authors recommended that further efforts be made to determine intersection conditions for effective use of pedestrian signals. As stated above, many pedestrians do not fully understand the meaning of pedestrian signals and markings, nor the legal obligations underlying them, and that may explain, in part, the less than perfect performance associated with these devices. A 1995 study by Tidwell and Doyle reported survey results based on data collected in 48 states. The following survey responses were reported:
SigningA variety of pedestrian-related signs are used by state and local agencies. Examples of regulatory signs include PEDESTRIANS PROHIBITED, WALK ON LEFT FACING TRAFFIC, NO HITCHHIKING, and others. Warning signs for pedestrians include the advance pedestrian crossing sign, school warning sign, and others. Guide signs provide travel information and can direct pedestrians to sidewalks, walkways, hiking trails, overpasses, and other facilities. Criteria for the design and placement of signs are contained in the Manual on Uniform Traffic Control Devices (MUTCD) (1988) and supplemented by the Traffic Control Devices Handbook, (1988). A 1988 study for the Transportation Research Board summarizes experiences from 48 state and local agencies regarding traffic and roadway conditions where certain signs are most (and least) effective (Zegeer and Zegeer, 1988). An experiment was conducted using a novel fluorescent yellow green sign warning motorists of pedestrians (Clark et al., 1996). A before-and-after study was done, including a comparison group where no such sign was deployed. An increase was found in the proportion of vehicles slowing or stopping for pedestrians. However, no decrease was seen in conflict events.
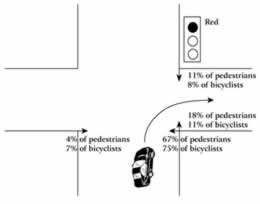
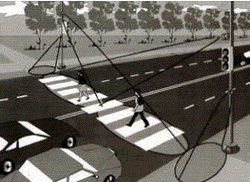
Right Turn on RedThe effects of RTOR on pedestrian safety was investigated in a 1981 study by Preusser and Associates. Right turn crashes increased from 1.47 percent before RTOR to 2.28 percent of all pedestrian crashes after RTOR went into effect. A common RTOR pedestrian crash resulted when a motorist was stopped at the intersection looking for approaching vehicles from the left and failed to see a pedestrian crossing from the right side. Directional movements related to RTOR crashes involving pedestrians and bicyclists are illustrated in figure 27. The study concluded that there was a small but clear safety problem for pedestrians because of RTOR. A 1994 NHTSA report to Congress said that about two-tenths of 1 percent of all fatal pedestrian and bike crashes result from RTOR (Compton and Milton, 1994).
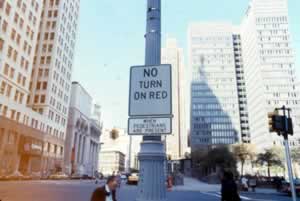
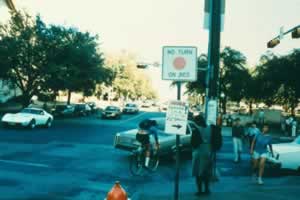
A 1986 study by Zegeer and Cynecki investigated motorist violation rates related to NO TURN ON RED (NTOR) signs and resulting pedestrian-vehicle conflicts. Observational data for more than 67,000 drivers at 110 intersections were collected at intersections in Washington, DC, Dallas, Austin, Detroit, Lansing, and Grand Rapids. It was found that 3.7 percent of all right-turning motorists at RTOR-prohibited intersections violate the NTOR signs. However, approximately 21 percent violate the NTOR signs if given an opportunity (e.g., first in line at the intersection with no pedestrians in front of them and no vehicle coming from the left). A summary of motorist violations and resulting conflicts at RTOR-prohibited sites is shown in table 28. According to Zegeer and Cynecki's findings, approximately 23.4 percent of all RTOR violations result in a conflict with a pedestrian. These types of conflicts are summarized in table 29 for the near and far crosswalks. At intersections where RTOR is allowed, 56.9 percent of motorists fail to make a full stop before turning right on red. This compared with 68.2 percent of vehicles that failed to make a complete stop at other intersections with stop-sign control. The higher violation rate (i.e., not fully stopping) at stop sign intersections was attributed in part to the greater opportunity for a rolling stop or no stop (because of lower side street volumes and pedestrian activity at stop-sign locations compared with signalized locations). Based on locational factors, 30 candidate countermeasures were developed to improve pedestrian safety relative to RTOR. A follow-up evaluation of promising countermeasures was conducted for RTOR pedestrian crashes. Seven countermeasures were tested at 34 intersection approaches in six U.S. cities on the basis of motorist violations and pedestrian-vehicle conflicts related to RTOR and right turn on green (RTOG). The results showed that the NTOR sign with the red ball was more effective than the standard black and white NTOR signs. For RTOR motorists, an offset stop bar was found to increase compliance (i.e., making a full stop before turning right on red) and also reduced conflicts with cross-street traffic. An electronic NTOR/ blank-out sign (actuated only during critical times, such as during school crossing times) was slightly more effective, although considerably more costly than traditional signs. In general, driver compliance was improved when the RTOR restriction was limited to the peak pedestrian times instead of full-time restrictions. The NTOR WHEN PEDESTRIANS ARE PRESENT sign was found to be effective at intersections having moderate or low RTOR volumes. Several of these countermeasures are illustrated in figure 28. The study also showed that generally the likelihood of an RTOG collision was higher than a RTOR collision. In some cases, prohibiting RTOR may lead to a greater RTOG collision potential.
Innovative Traffic Control DevicesVarious problems have been identified in recent years regarding traffic controls for pedestrians, particularly related to the ineffectiveness and confusion associated with pedestrian signal messages. A 1982 study by Zegeer et. al. developed and tested alternatives to warn pedestrians and/or motorists of potential problems between pedestrians and turning vehicles at intersections. Field testing was conducted at selected intersections in several cities (Washington, DC, Milwaukee, Detroit, Ann Arbor, and Saginaw, MI). The results revealed that:
Previous research has also shown a general misunderstanding by pedestrians of the flashing DON'T WALK interval (Robertson and Carter, 1984). As part of the 1982 Zegeer et. al. study, several devices were developed as alternatives to the flashing DON'T WALK, including:
An illustration of some of these innovative traffic control alternatives is shown in figure 29.
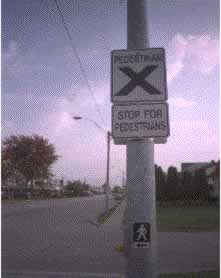
Huang, Zegeer, and Nassi conducted an evaluation of innovative pedestrian signs at unsignalized locations in conjunction with marked crosswalks to improve the crosswalk visibility and increase the likelihood that motorists would yield to pedestrians. Their study evaluated three such devices: (1) an overhead CROSSWALK sign in Seattle, WA; (2) pedestrian safety cones with the message, "STATE LAW - YIELD TO PEDESTRIANS IN CROSSWALK IN YOUR HALF OF ROAD" in NY State and Portland, OR; and (3) pedestrian-activated "STOP FOR PEDESTRIAN IN CROSSWALK" overhead signs in Tucson, AZ. The signs were used under different traffic and roadway conditions. The New York cones and Seattle signs were effective in increasing the number of motorists who stopped for pedestrians. At one location in Tucson, the overhead sign increased instances of motorists' yielding to pedestrians. The signs in Seattle and Tucson were effective in reducing the number of pedestrians who had to run, hesitate, or abort their crossing. None of the treatments had a clear effect on whether people crossed in the crosswalk. The authors concluded that these devices by themselves cannot ensure that motorists will slow down and yield to pedestrians, and that it is essential to use such devices together with education and enforcement. Finally, the authors recommended that traffic engineers should use other measures, including designing "friendlier" pedestrian environments at the outset.
A novel overhead illuminated crosswalk sign and high-visibility ladder style crosswalk were evaluated in Clearwater, FL by Nitzburg and Knoblauch (2000) using an experimental/control design. The effect of the novel treatments on driver and pedestrian behavior was determined. A significant 30-40 percent increase in daytime driver yielding behavior was found. A smaller (8 percent) and insignificant increase in nighttime driver yielding behavior was observed. A large (35 percent) increase in crosswalk usage by pedestrians was noted along with no change in pedestrian overconfidence, running, or conflicts. It was concluded that the high-visibility crosswalk treatments had a positive effect on pedestrian and driver behavior on the relatively narrow low-speed crossings that were studied. Additional work was recommended to determine whether they also have a desirable effect on wider roadways where speeds are greater.
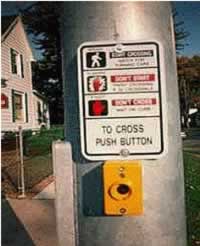
At many intersections, pedestrians must push buttons to activate the WALK phase. However, they often do not know whether the button has been pressed and whether it is functional. If the WALK phase does not appear soon after the button has been pressed, they may believe that it does not work and start crossing early, while the steady DON'T WALK is still being displayed. When a pedestrian presses an illuminated push button, a light near the button turns on, indicating that the WALK phase has been activated and will appear. Huang and Zegeer conducted in 2000 a study to evaluate the effects of illuminated push buttons on pedestrian behavior. In general, illuminated push buttons did not have a statistically significant effect on how often the pedestrian phases were activated, how many people pushed the button, how many people complied with the WALK phase, or such pedestrian behaviors as running, aborted crossings, and hesitation before crossing. Only 17 and 13 percent of pedestrians pushed the button in the "before" and "after" periods, respectively. In both the before and after periods, someone pushed the button in 32 percent of signal cycles with pedestrians. The majority of pedestrians (67.8 percent with, and 72.3 percent without illuminated push button) who arrived when parallel traffic had the red and who pushed the button complied with the WALK phase. Automated pedestrian detection systems provide the means to detect the presence of pedestrians as they approach the curb before crossing the street, and then "call" the WALK signal without any action required on the part of the pedestrian. Hughes, Huang, Zegeer, and Cynecki conducted a study to determine whether automated pedestrian detectors, when used in conjunction with standard pedestrian push buttons, would result in fewer overall pedestrian-vehicle conflicts and fewer inappropriate crossings (i.e., beginning to cross during the DON'T WALK signal). "Before" and "after" video data were collected at intersection locations in Los Angeles, CA (infrared and microwave), Phoenix, AZ (microwave), and Rochester, NY (microwave). The results indicated a significant reduction in vehicle-pedestrian conflicts as well as a reduction in the number of pedestrians beginning to cross during the DON'T WALK signal. The differences between microwave and infrared detectors were not significant. Detailed field testing of the microwave equipment in Phoenix revealed that fine tuning of the detection zone is still needed to reduce the number of false calls and missed calls.
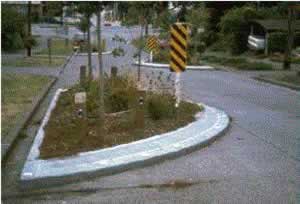
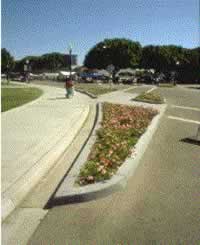
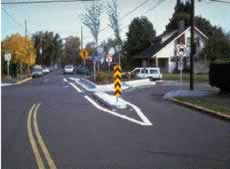
Pedestrian Refuge AreasSome pedestrians cannot cross an intersection within the signal time provided, and some midblock crossings are too wide for the available gaps. Running across intersections has been shown to be a common cause of pedestrian crashes. Pedestrian refuge areas between traffic lanes offer a place where pedestrians may pause while crossing a multilane street. They also allow pedestrians to cross one direction of travel at a time. Refuge areas may be delineated by markings on the roadway or raised above the surface of the street.
The use of central refuge islands, or medians, for pedestrians is often proposed but seldom studied. One analysis reports before-after comparisons of personal injury crashes at sites where pedestrian refuges were installed (Lalani, 1976). "Double-D" shaped islands were installed at 120 sites in London. The installations were in conjunction with other roadway improvements, including anti-skid surfacing, illuminated bollards, bus lanes, and cross-hatch markings. The crash records for comparable before-and-after periods were subjected to statistical tests to determine significant changes. It was found that provision of refuges, thought of as a facility for pedestrians, reduced vehicle crashes but increased pedestrian crashes. Significant pedestrian crash reduction at intersections could be identified only where the purpose of the refuge was very clearly established, such as: provision of the refuge specifically on the basis of safety, reinforcement of the refuge with cross-hatch markings, or provision of the refuge for channelization or vehicular traffic. For single refuges not at junctions, it was possible to identify significant reductions in vehicle crashes when the refuges were fitted with fully illuminated bollards. It was possible to identify overall significant reductions in crashes where the refuges were provided in the vicinity of active pedestrian areas.
Additional studies do not fully remove the ambiguity cited above. Bowman and Vecellio (1994A, 1994B) reported comparisons of several kinds of medians, including undivided multi lane roadway, TWLTL, and raised curb medians. Raised curb facilities seem to be associated with lower pedestrian crash rates, as might be expected. But the authors say, " . . . it appears that both raised and TWLTL medians significantly reduce the number and severity of vehicular crashes . . . . The literature did not provide a conclusive indication that medians improved pedestrian safety," (Bowman and Vecellio, 1994B, p. 186).
In general, raised curb medians may be better than TWLTL medians which are, in turn, better than undivided highways (Bowman and Vecellio, 1994A). The data were broken down several ways, and recombined several ways. Some differences were significant and others were not. The need for refuge areas is presumably related to street widths, pedestrian walking speed, and vehicle gaps. The Manual on Uniform Traffic Control Devices (MUTCD) requires clearance intervals to be based on a walking speed of 1.2 m/s (4 ft/s); however, this may not be sufficient for pedestrians with mobility impairments. Knoblauch and colleagues measured pedestrian start up and walk times in 1996. The measures varied according to many factors, but the differences, though statistically significant, were mostly too small to matter from the design standpoint. The authors recommend, however, use of a walking speed of 0.91 m/s for elderly pedestrians and 1.22 m/s (4 ft/s) for a typical pedestrian. Further indications of variability of possible relevance to designers are two studies of pedestrian walking speeds in the tropical countries of Thailand and Sri Lanka.(Tanaboriboon and Guyano, 1991; Morrall et al., 1991), where walking speeds are slower than typical in the U.S. Thus, when the temperature is high and when pedestrians may be encumbered with loads, walking speed may be slower.
Provisions for Pedestrians with DisabilitiesA study of collisions involving pedestrians with disabilities in Atlanta, GA led to conclusions regarding various countermeasures for reducing elderly and handicapped pedestrian crashes (Templer, 1979). A telephone interview was used to determine information not available from the collision report or hospital records of 989 pedestrian crash reports. Field reconnaissance was made of the crash sites. The number of crashes in the sample that might have been prevented by each of the following countermeasures is noted below:
In addition to those crashes analyzed for Atlanta, the same study sampled reactions to environmental hazards by handicapped people in five U.S. cities. Four elements of the pedestrian system were identified as accounting for 81 percent of the crashes they reported:
Countermeasures for Pedestrians with Vision ImpairmentsCrossing the street is a major hazard for people with vision impairments. A non-visual system to assist the vision-impaired has two distinct aspects, according to Hulscher (1975).
From a series of interviews with 10 persons with vision impairments in Washington, DC, Hulscher showed the need for careful consideration of this impairment when widening streets and intersections, or accomplishing other physical changes. Major recommendations by those interviewed included:
Particular problems were noted for pedestrians with vision impairments at signalized crossings, including their difficulty in finding the pedestrian push buttons at actuated signals. Another problem for visually impaired pedestrians was in determining when the WALK and clearance intervals were displayed. Conveying signal information under such circumstances has been achieved by both tactile and audible means. These may be used to provide information regarding signal status as well as crossing guidance (Hulscher, 1975; Roberts, 1972). One study reported that, in Japan, sound equipment was used to generate bird calls or little songs to indicate signal status (Van Der Does, 1976). These have been found least disturbing to others and can be installed to vary in loudness depending on ambient sound levels. Combinations of buzzers and beepers have been used in Australia (Chalis et al., 1976). These were combined with a vibrator, which the pedestrian with a vision impairment must touch at the curb to determine when it is safe to walk. The beeper then provides information on the clearance interval. Disturbance to others and masking due to ambient noise were noted as problems. Interviews with pedestrians with vision impairments uncovered a pronounced mistrust of mechanical aids at intersections, based upon experience with the vibrating signal. Several new designs were evaluated on the basis of behavior on the part of pedestrians with a vision impairment. The recommended mechanism employed an audible DON'T WALK sound device mounted on a pole to which the pedestrian could go and wait for the WALK signal. The signals were automatically adjusted to ambient noise level. An evaluation of audible pedestrian signals was conducted in 1988 by the San Diego Association of Governments. The study estimated that as many as 100 cities in the U.S. use audible pedestrian signals, and they were reported to be used in Australia, Japan, Canada, Great Britain, and other countries in Europe. One aspect of the study involved a review of pedestrian crashes at 60 intersections in San Diego, CA, where pedestrian signals had been installed. No differences were found in the number of pedestrian collisions before and after installation of the audible devices. Drivers were at fault in more than half of the pedestrian collisions, and most crashes occurred between 9 a.m. and 6 p.m. in clear weather with the vehicle going straight. In spite of the signals' lack of a measurable effect on pedestrian crashes, the authors developed specific criteria for their use. Tactile strips have been laid down to assist pedestrians with a vision impairment in crossing the street. In San Diego, tests at three sites showed tactile guide strips made of epoxy cement and pea gravel to be effective and durable under sustained traffic and weather conditions (Herms et al., 1975). They reported no evidence that the raised strip (102 mm [4 in] wide with 6-mm [0.25-in.] gravel) caused any subsidiary problems for motorists, bicyclists, or other pedestrians. The authors cautioned that these tactile strips should not be applied on an areawide basis but rather at selected locations of proven need, under joint supervision of a traffic engineering specialist and a trained mobility expert. This will help insure that such devices are provided consistently and to warn visually-impaired pedestrians where it is appropriate to do so. Research was done by Gallon and colleagues on the use and utility of tactile surfaces in the traffic environment for people with visual impairments (Gallon et al., 1991; Gallon, 1992). The 1991 report included four study parts:
Five or six surfaces were found to be reliably distinguished, though none was "perfect," and color differences were important for people with some sight. The study also called for training people with visual impairments and consistent deployment of the various surfaces. In the 1992 study, Gallon reported that the selected surfaces posed no problems for those with mobility impairments. In contrast, O'Leary et al. (1995) cite some concerns by people with mobility impairments to the surfaces that assisted people with visual impairments. Another device for pedestrians with a visual impairment, tested in Japan is a radio receiver carried by the vision-impaired pedestrian to receive information on traffic signal status from the signal installation (Van Der Does, 1976). For the color-blind, red and green are most often difficult to distinguish, so blue has been included in the green signal, or replaced green, for easier identification. These "system" approaches can augment motorist behavior in response to seeing a handicapped pedestrian. In one experiment, a member of the research team crossed traffic with and without carrying a cane (Harrell, 1992). Drivers stopped more often when the cane was carried, but even under this condition, an average of three cars passed by before one stopped.
Safety Measures for Pedestrians with Hearing ImpairmentsA survey of 60 people with hearing impairments in Washington, DC, emphasized the visual dimension of travel on foot (Roberts, 1972). These pedestrians indicated the need for better, clearer signs at more appropriate locations; the use of audible crossing signals at various frequencies for the hearing impaired; more and better lighting facilities along pedestrian routes; and support structures, such as handrails, at critical locations such as bus boarding areas.
Guides and Manuals for Accommodating Pedestrians with DisabilitiesSeveral published reports, guides, and manuals provide guidance on the selection and use of facilities for pedestrians with physical or mental impairments. For example, Earnhart and Simon in 1987 prepared a manual entitled, Accessibility for Elderly and Handicapped Pedestrians - A Manual for Cities, written to provide guidance to planners and other officials in the development of a program for improved accessibility. The manual includes information on planning, programing, and design of such facilities, and also provides example problems and solutions along with a checklist that can be used to solve various problems. Design details are provided relative to walkways and sidewalks, curb ramps, crosswalks, refuge islands, parking and loading areas, ramps and stairs, handrails, signing, street furniture, lighting and illumination, traffic signals, and tactile surface treatments. Several FHWA reports address efforts to improve accommodation for elderly and handicapped pedestrians in U.S. cities. They involve the priority accessible network (PAN) approach, which is based on planning principles designed to provide for the special needs of these pedestrian populations. (Larsen, 1984; Hawkins, 1984). The goals of the PAN approach are to:
The PAN process has been applied successfully and documented in, among other cities, Seattle, WA; New Orleans, LA; and Baltimore, MD (Larsen, 1984; Hawkins 1984; Zegeer and Zegeer, 1989). A summary of the various types of roadway and engineering improvements for elderly and handicapped pedestrians has been documented in a 1989 publication by Zegeer and Zegeer, which discusses the many possible measures related to traffic signals, sidewalks, signs, and design features. The FHWA's two-part Designing Sidewalks and Trails for Access report provides further guidance on designing sidewalks and walkways for people with disabilities. Part I: Review of Existing Guidelines and Practices looks at existing sidewalk and trail conditions for people with disabilities. By conducting a literature search and site visits around the U.S., the authors compiled data and reviewed designs to identify factors that affect accessibility for all populations (Axelson et al., 1999). Building on the foundation of Part I, Part II: Best Practices Design Guide was created to improve understanding among city planners, urban designers, and transportation engineers with respect to how sidewalks and trails can be developed to promote pedestrian access for all users, including people with disabilities (Kirschbaum et al., 2001).
Bus Stop LocationTwo percent of all pedestrian collisions in urban areas can be classified as pedestrian collisions at bus stops. Most do not involve a pedestrian's being struck by a bus; rather, the bus creates a visual screen between approaching drivers and pedestrians crossing in front of the bus. In rural areas, pedestrian crashes related to school bus stops were identified in 3 percent of all pedestrian crashes. The countermeasure proposed for the urban crashes involved bus stop relocation to the far side of the intersections to encourage pedestrians to cross behind the bus instead of in front. This allows the pedestrian to be seen and to see oncoming traffic closest to the bus. To determine the effect of such relocation on pedestrian crossing behavior, two studies addressed before-and-after bus stop relocation. One was a site in Miami, FL, on a two-way, four-lane street intersecting with a two-way, two-lane street at an unsignalized location. The other was in San Diego, CA, on a two-way, four-lane street intersecting with a one-way, three-lane street at a signalized location that included pedestrian signals (Berger, 1975). The relocation of the bus stops to the far side eliminated the undesired crossing behavior; previously, half those crossing after disembarking were crossing in front of the bus. An analysis of pedestrian crashes in Sweden found school bus stops were not located with the greatest care regarding pedestrian safety factors (Sandels, 1979). They concluded bus stops should be located:
A U.S. study of crashes involving trips to and from schools investigated the location of school bus stops and developed guidelines for planning, routing, and scheduling school buses (Reiss, 1975A).
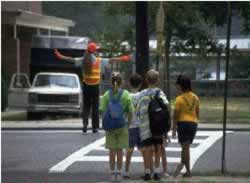
School Trip SafetyPedestrian safety dealing with the school trip has received much attention from the public and researchers. It is therefore treated as a separate entity here, referencing a variety of traffic guidance and control countermeasures. An inventory of crashes in 1,335 U.S. cities revealed that 25.4 percent of 220 child pedestrian deaths reported for 1967 occurred as the children were en route to or from school (AAA Special Study, 1968). Among 1,854 child pedestrian injuries, 18.6 percent took place en route to or from school. From this study, a national estimate was made of 500 fatalities and 11,000 injuries resulting from the walk to school. The highest proportion of these occur at ages 12 to 14. This is the junior high school age when the student is usually without the presence of student crossing controls for the first time. Further analysis showed about 93 percent of all children involved were struck at locations where no school safety patrols, adult guards, or police officers were stationed. (This study was carried out many years ago and may now be out of date.) An intensive study of the school trip was conducted at sites in New York, Maryland, and Virginia (Reiss, 1975A), surveying both students and drivers. Crashes were also analyzed. The student surveys sought information on knowledge, behavior, and possible means for modifying these. Driver surveys sought data regarding perceptions, motivational factors, and reactions to the school zone environment and their correlation to actual behavior. The four sites studied employed school warning and speed limit signs. Walking to school accounts for between 10 and 20 percent of the annual young-pedestrian crashes in the U.S. Significantly more younger students than older ones indicated they are unaware of or do not differentiate among various traffic control devices. They consider uniformed crossing guards safer than other control devices. They would vary their route to school on the basis of parental instructions.
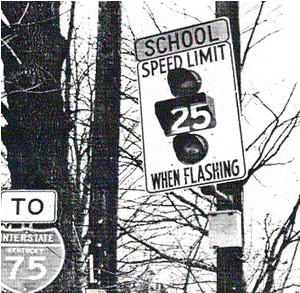
Zegeer and Deen in 1978 conducted an evaluation in Kentucky of the 25 MPH WHEN FLASHING sign at 48 high-speed school-zone locations with yellow flashing beacons. Speeds were predominantly 56-73 km/h (35-45 mi/h) without the flasher. Vehicle speeds overall were an average of only 5.8 km/h (3.6 mi/h) less during the flashing periods compared with the non-flashing periods. Speed reductions of 16 km/h (10 mi/h) or more were found at only two sites, and only 18 percent of all motorists complied with the 40 km/h (25 mi/h) flashing limit. The regulatory flashing signs were not considered effective in reducing vehicle speeds to 40 km/h (25 mi/h). At rural school zone locations, the 40 km (25 mi) flashers during school periods resulted in an increase in speed variance and thus, they created the potential for increased rear-end vehicle crashes. The presence of crossing guards and/or police speed enforcement, however, contributed to improved speed compliance Another discouraging note is added in a 1990 study by Burritt et al. in which yellow flashers were added to existing 24 km/h (15 mi/h) school zone signs at a school crossing on a highway in Tucson, AZ. The flashers, installed over the objections of the Arizona highway authorities, were then evaluated in December before the flashers and in May after the flashers. Speed was somewhat worse after the flashers were installed, increasing from 26 to 32 km/h (16-20 mi/h) at one site and from 24 to 27 km/h (15-17 mi/h) at the other. The authors provided no behavioral data.
Alternatives to Signalization for School CrossingsA school pedestrian signal design concept has been used with stop signs on the minor approach and traffic signals on the major approach. Some western states have used these devices to create adequate pedestrian crossing gaps across high-speed, high-volume facilities used by school children, the elderly, and/or those with disabilities where full signalization was not warranted. A 1977 study by Petzold was directed at identifying and evaluating alternatives to full signalization at school pedestrian crossings. These crossings were located at the intersection of a high-volume arterial street and a low-volume residential street where traffic gaps are inadequate to allow pedestrians to cross the arterial street safely without an unreasonable delay. These locations would not otherwise warrant full signalization. The following five school pedestrian crossing designs were selected for field testing at installations in six U.S. cities:
The five school pedestrian crossing designs were evaluated in a time series, matched experimental-control design. Six measures of effectiveness were used: compliance, behavior, and volume, for both pedestrians and vehicles; vehicle delay; gaps in the major street vehicular traffic stream; and driver understanding. In all experiments, a fully signalized intersection was used as a control site. Based on the data analysis and observations at each school pedestrian crossing design, Petzold (1977) listed the following advantages as compared with full signalization:
Disadvantages to the full signal alternatives as found by Petzold include:
Based on the comparison between each school pedestrian crossing design and its fully signalized control site, the authors made these conclusions:
Based on the comparison of mean rank scores among the five school pedestrian crossing designs, the crossing guard had significantly better operating characteristics than the beacon and stop sign or the flashing yellow signal and flashing red beacon designs. The crossing guard operating characteristics were not significantly different from the operating characteristics observed at the signal and stop sign and flashing green signal and stop sign designs.
Reflectorization and ConspicuityResearch has identified reflectorization as a highly effective means of improving visibility (Allen et al., 1969; Hazlett and Allen, 1968; Jacobs, 1968b). In a survey of safety specialists, reflectorization countermeasures were identified as having the highest overall rating to reduce school children crashes occurring during darkness (Reiss, 1975). The key issue is attaining proper usage. A study of reflectorization treatments showed that a person dressed in black wearing a thumb-sized retroreflective tag is detected at greater distances than a person completely dressed in white (Rumar, 1966). Maintaining the retroreflective power of the tag was also shown to be important to achieve good results, thus highlighting the need to regularly replace or clean the tag. A 1984 study by Blomberg et al. investigated countermeasures to improve the conspicuity of pedestrians and bicyclists. Nighttime field tests were conducted for baseline pedestrians (i.e., wearing a white tee shirt and blue jeans), compared with pedestrians with dangle tags, a flashlight, jogger's vest, and retroreflective material on head band, wrist bands, belt, and ankle bands ("rings"). On average, the flashlight was detected by a driver at 420.5 m (1,379 ft). This was slightly more than 183 m (600 ft) further away than rings, which were the next best target (at 231.8 m [760 ft]) and jogging vest (227 m [744 ft]), as shown in figure 40. The average detection distance of the baseline pedestrian was 68 m (224 ft).
Owens and Antonoff in 1994 conducted an experiment in which retroreflective materials were placed on different body locations. Pedestrians with reflective materials on knees, waist, elbows, and shoulders were seen more readily than when placed on a pedestrian (e.g., chest or back) where no movement was evident. Authors said "biological motion" was an important part of detection and recognition. Seen at night, such motions of the reflectorized materials are more pronounced and are more readily interpreted as characteristic of human motion. As an engineering countermeasure, retroreflective materials are used for roadway markings such as crosswalks, stop lines, and lane markings. These materials reflect light from vehicle headlights and from roadway illumination. Reflective vests and other clothing for pedestrians have also been made with reflective materials. Reflectorization has been shown to increase the visibility of a pedestrian by a factor of five. The difficulty is making retroreflective clothing that can last more than a few wash cycles.
One-Way Streets as a Pedestrian Crash CountermeasureA comprehensive study of pedestrian and bicycle crashes in several Canadian cities found fewer crashes on one-way streets in the core of a city than on two-way streets (Lea, 1978). Thus, conversion to a one-way street system may also be a relatively low-cost pedestrian countermeasure, having as high as 40-60 percent effectiveness on amenable crashes. However, the applicable crashes were estimated to represent only about 10 percent of the city total. A study in Manhattan, NY highlighted the aspects of one-way street grids that tend to provide safer traffic operation (Fruin, 1973). The simplification of the crossing and turning conditions, which has been noted to occur for vehicles at the intersection of two one-way streets, is also helpful to pedestrians. Two-hundred fifty-three pedestrian crashes, occurring over a 5-year period in an 8-by-4 grid, were studied. Almost 70 percent of these occurred at intersections. Only five fatalities occurred in the area during the 5 years; all were males over age 60. The four crosswalks at each intersection were divided into two groups, two where there was a conflict with a vehicle completing a turn (conflict side), and two with no turning conflict. The results of that study showed that crossings on the turning conflict side of the intersection accounted for 69.7 percent of the intersection crashes. This total consisted of 44.7 percent turning crashes, 17.5 percent straight crashes, and 7.5 percent backup crashes. A pedestrian is more than twice as likely to be struck by a vehicle when crossing on the turning conflict side than when crossing on the non-turning conflict side. Short vehicle and pedestrian counts were taken at the intersections in the study area. While the conclusions were not statistically significant, the results offer some useful perspectives. Although vehicle turning movements averaged only 14 percent of the total intersection volume, turning crashes were almost 45 percent of the total. Left-turn crashes exceeded right-turn crashes by a ratio of two to one. The front left vehicle window post was suggested as a factor, blocking the driver's view of a critical part of the crosswalk area. Of course, the left turn is inherently a more complex task for the driver. In many cases, converting two-way streets to one-way streets may not be justified solely by pedestrian safety considerations. Several concerns such as capacity, traffic circulation, and overall traffic safety are the major considerations. Vehicle speeds may also increase after conversion from two-way to one-way street patterns. However, one-way streets can greatly simplify the task of crossing a street and in some cases may improve safety for pedestrians.
Pedestrian Overpasses and UnderpassesAn analysis was made of reported pedestrian crashes for 6 months before and 6 months after the installation of pedestrian overpasses at 31 locations in Tokyo, Japan (Accident Prevention Effects, 1969). The overall results are shown in table 30. The table shows data for 200-m (218-yd) sections and 100-m (109-yd) sections on either side of each site. The "related" crashes (assumed to be pedestrian crossing crashes) decreased substantially after overpass installation, but non-related crashes (not defined) increased by 23 percent in the 200-m (218-yd) sections. There was also a greater reduction in daylight pedestrian collisions than in those occurring at night. The effectiveness of pedestrian overpasses depends largely on the amount of use by pedestrians. A 1965 study by Moore and Older found that use depended on walking distances and convenience of the facility. A convenience measure (R) was defined by the authors as the ratio of the time to cross the street on an overpass divided by the time to cross at street level. As illustrated in figure 41, the study found that approximately 95 percent of pedestrians will use an overpass if the walking time in using the overpass is the same as crossing at street level (i.e., R = l). However, if crossing the overpass takes 50 percent longer than crossing at street level (R = l.5), almost no one will use the overpass. Usage of pedestrian underpasses (subway) was not as high as overpasses for similar values of R.
Problems have also been identified relative to pedestrians' use of overpasses. A panel of people with disabilities was asked to comment on problems after using three pedestrian overpasses in San Francisco, CA (Swan, 1978). The major elements identified as creating a barrier or hazard to the user with disabilities included:
A study in 1980 by Templer et al. investigated the feasibility of accommodating pedestrians with physical disabilities on existing overpass and underpass structures. A review of 124 crossing structures revealed that 86 percent presented at least one major barrier to the physically handicapped, the most common being:
Various solutions to these access problems were developed and compared based on cost-effectiveness.
The Americans with Disabilities Act (ADA) law of 1990 has since required the barriers to wheelchair users to be removed, requiring more gentle slopes. While these gentle slopes make it easier for bicyclists and other users, it has also greatly increased the length of ramps, which may discourage usage. Methods such as carefully planned fencing have been used to channel pedestrians to the overpasses and underpasses to increase usage. Grade separations such as overpasses and underpasses for pedestrian crossing can be beneficial under certain circumstances if the pedestrian can be persuaded to use the grade-separated crossing (i.e., perceive it as safer, convenient). However, they are very costly and may not be used by pedestrians if not planned properly.
Traffic Calming
What is Traffic Calming?At an Institute of Traffic Engineers (ITE) meeting attended by traffic calming experts, the following definition was prepared: "Traffic calming is the combination of mainly physical measures that reduce the negative effects of motor vehicle use, alter driver behavior and improve conditions for non-vehicular traffic." (Lockwood, 1997, page 22) The need for a definition process grew out of the fact that a variety of activities are called traffic calming by one person or another. Lockwood (1997) said: "...traffic calming could mean anything from lowering motor vehicle speeds to an all-encompassing transportation policy." (page 22) and "...everything from slowing down motor vehicles to changing tax laws." (page 24) According to Lockwood, the term "mainly physical measures" is meant to include the supporting political environment, policy, and legislation. The "negative effect of motor vehicle use" refers to speeding, neighborhood intrusion, energy consumption, pollution, urban sprawl, etc. Many traffic calming measures typically create an improved environment for pedestrians by reducing vehicle speeds or volumes, and/or shortening the crossing distances for pedestrians.
Traffic-Calming MeasuresMany measures can be considered traffic calming. A 1995 document prepared by the Institute of Traffic Engineers (ITE) (Kemper and Fernandez, 1994) discusses "neighborhood traffic control measures" and lists 13 types, and other initiatives are not included on the ITE list. :
Other measures include traffic diversion, which involves moving traffic onto other streets, while still others, such as speed limit signs and enforcement, fall into traditional traffic engineering approaches. Figure 43 illustrates some of the above. A study in 2000 by Huang and Cynecki evaluated the effects of a variety of traffic-calming measures on pedestrian and motorist behavior at midblock and intersection locations. "Before" and "after" data were collected in Cambridge, MA (bulbouts and raised intersection), Corvallis, OR (pedestrian refuge island), and Seattle, WA (bulbouts). Data were also collected at "treatment" and "control" sites in Durham, NC (raised crosswalks), Greensboro, NC (bulbouts), Montgomery County, MD (raised crosswalks), Richmond, VA (bulbouts), and Sacramento, CA (bulbouts). The key findings include:
In conclusion, these devices have the potential for improving the pedestrian environment. However, these devices by themselves do not guarantee that all motorists will slow down or yield to pedestrians.
1. Play Streets Play streets have been employed in the United States in center-city neighborhoods to provide safe play areas in or near residential areas. A play street is a residential street closed to vehicular traffic during specific hours to permit a supervised program of recreational activities in the roadway. A series of interview studies was performed at 20 sites in Philadelphia and New York City. The interviews sought behavioral and opinion data regarding play streets from users, residents, merchants, play street supervisory staff, and city officials (Reiss, 1975B). Play streets were found to be effective in eliminating traffic and parking. The streets drew 67 percent of the users from among those who live along the street. The remainder came from within a radius of three blocks. Ninety-six percent of the residents and merchants interviewed believed the play street reduces the likelihood that children will be hit by cars. Eighty-eight percent noted no problems to them because of the 1 p.m. to 8 p.m. street closure. However, only 12 percent of the play supervisors interviewed perceived a safety benefit. It was recommended that signing and barricades be judiciously used to control vehicular access to a play street. The authors recommend that appropriate traffic engineering studies should be made before selecting a play street site. Guidelines were developed for the creation and operation of urban play areas. No evaluations of the safety benefits of play streets were conducted.
A study of the effect of recreational facilities on child pedestrian crashes was made in Philadelphia (Bartholomew, 1967). Traffic crash records were analyzed for 2 years before and 2 years after the opening of seven different recreational facilities in various parts of the city. Service areas for each were defined on the basis of population density and physical barriers. There was a significant reduction in pedestrian crashes involving children ages 5-14 for the combined areas after facilities were opened. Outside the seven areas, there was a city-wide trend of an increase in child pedestrian collisions. The greatest impact was noted within a radius of one-quarter mile of each facility. This occurred even though more children were using the facilities and crossing streets going to and from the sites. 2. Community Streets Japan's traffic-calming strategies have been directed toward community streets. Community streets rely on treatments such as speed humps, bulbouts, chicanes, and other devices to slow down motor vehicle traffic (Replogle, 1992). In addition, motorists and pedestrians are separated. Community streets are most appropriate when traffic volumes are 200 vehicles per hour or less. Road-pia are neighborhood-wide installations of community streets that give priority to pedestrians and cyclists. In the Koraku district of Nagoya, a road-pia scheme introduced community streets to connect schools and transit stations to homes. The number of car-pedestrian crashes resulting in injury or death fell from 32 in the 4 years before the road-pia scheme was installed to only 2 in the 2 years after. While the effects of individual components such as speed humps or bulbouts was not known, the combination of these devices was effective in reducing traffic, vehicle speeds, and collisions (Replogle, 1992). 3. Woonerf The Netherlands is one of the leaders in traffic calming. They developed the "woonerf" based on the concept of the residential yard (Kraay, 1976). These are areas where the physical and visual treatments of the public right-of-way create a pedestrian-oriented area. Only local traffic is allowed to use the roadway and all modes are "forced" to travel almost as slow as the slowest mode (the pedestrian) through design features. The residential yard's function differs from a conventionally designed residential street. The paved area is used in common for various functions, including driving, playing, cycling, walking, and parking. This is intended for application only along low-volume streets having minimal parking demand. Special legal and behavioral rules apply to traffic in the residential yard:
4. Transit Malls: Shared Use of Pedestrian-Oriented Space The use of transit malls is common in Europe, and is increasing in U.S. cities. Studies were conducted of crashes occurring before and after implementation of transit malls in Philadelphia and Minneapolis (Edminster and Koffman, 1979). Analysis showed non-pedestrian collisions decreasing sharply on transit malls with no evidence of an increase on nearby streets. Total pedestrian crashes appear stable with the only increase related to an increase in the exposure rates of pedestrian and vehicular volumes. Bus-pedestrian conflicts are much higher on transit malls than on other streets. Fortunately, creating the malls has not resulted in a higher number of bus-pedestrian collisions. Factors related to pedestrian crashes in Philadelphia include:
Although some people believed speeding buses, encouraged by the freedom from other traffic, were a danger to pedestrians, there was no evidence of buses speeding. As a result of a review of studies involving shared use of pedestrian-oriented space, it was concluded that plans that restrict private vehicles from small sections of the roadway but allow other public service vehicles have only marginal or small positive safety benefits (Edminster and Koffman, 1979; Katz, 1978). Other pedestrian measures, such as pedestrian delay, are improved. 5. Area-wide Traffic Restrictions Area-wide traffic restriction plans have been employed in town centers and residential areas. Observations of pedestrian risk were made in Upsala, Sweden, both before and after the implementation of an area-wide traffic restriction plan in the center of town (Lovemark, 1974). This involved closing streets to vehicular traffic, institution of one-way flow on bypass routes, and bus-only streets. Risk was defined as the probability of a collision occurring that would result in personal injury and was predicted from serious traffic conflicts for various types of pedestrian and driver behaviors. Risk for pedestrians in the restricted area declined by 29 percent. Risk for pedestrians on surrounding streets outside the restricted area, which experienced a 30-percent increase in volume after the restrictions were implemented, increased 12 percent. In similar traffic management efforts in London, the impact of street closures and a few other devices on pedestrian safety was analyzed for 19 areas (Brownfield, 1980). Ten sites showed declines in pedestrian collisions and two sites remained the same. The overall result was a pedestrian crash decline of 24.4 percent. However, this decline was not statistically significant. 6. Speed Humps and Speed Tables Also known as road humps, undulations, or "sleeping policemen," speed humps were developed by the Transport and Road Research Laboratory in Great Britain. The purpose of speed humps is to promote the smooth flow of traffic at slow speeds, around 32-40 km/h (20-25 mi/h). The speed hump is an elongated bump with a circular-arc cross-section, rising to a maximum height of 76 mm (3 in) above the normal pavement surface and having a length of 3.7 m (12 ft) in the direction of vehicular travel. Speed humps usually extend the full width of the road. Speed tables are flat-topped or trapazoidal speed humps. When used in conjunction with crosswalks, the flat top of the hump can extent the width of the crosswalk. Speed tables are generally the same height of speed humps, and the raised portion can be built with brick pavers. Speed tables are more common in Europe and Australia than in the U.S. The ITE notes that, Speed humps have the advantage of being largely self-enforcing and of creating a visual impression, real or imagined, that a street is not intended for speeding or 'through' traffic. Some items to consider before speed hump installation are their initial construction and continuing maintenance costs, any potential negative impact on emergency and service vehicles, increases in vehicle noise, inconvenient access, and to some, their unsightliness. They must be appropriate for use at all hours, day and night. In addition, it is mandatory that they be supplemented with a combination of signs and/or pavement markings to warn motorists. (ITE Technical Council, 1993) Other concerns related to speed humps and speed tables include the effect on drainage, snow removal, and the effect on emergency access of fire trucks and ambulances. 7. Effects of Speed Humps According to the ITE, speed hump research and testing have found that:
8. Experience with Speed Humps Several agencies have reported on the use of speed humps. OMAHA, NE (Klik and Faghri, 1993)
BELLEVUE, WA (Clarke and Dornfield, 1994)
HOWARD COUNTRY, MD (Walter, 1995)
AGOURA HILLS, CA (Cline, 1993)
WESTLAKE VILLAGE, CA (Cline, 1993)
Several other demonstration projects in Los Angeles used the 67-mm (2.625-in) speed humps, with results similar to Agoura Hills and Westlake Village CORIO, VICTORIA, AUSTRALIA (McDonald and Jarvis, 1981)
STIRLING, WESTERN AUSTRALIA (Richardson and Jarvis, 1981)
Other Australian cities conducted evaluations on speed tables. In Croydon, Victoria, the 85th percentile speeds between speed tables fell as much as 36 percent (Hawley et al., 1992). In Mosman, New South Wales, the noise levels after speed tables were installed fell by up to 11 decibels, partly the result of lower traffic volumes (Hawley et al., 1992). With speed tables in place, the character of vehicle noise changes to thumping (as motorists drive over the tables) and acceleration (as motorists speed up between tables). Nearby residents may perceive these changes as increased noise. A Danish study developed a regression model to calculate expected speed changes associated with speed humps, lateral dislocations, and street narrowing (Engel and Thomsen, 1992). According to their model, every centimeter in height is expected to reduce speed by 1.0 km/h (0.6 mi/h). (Street narrowing is predicted to produce a 4.7-km/h (2.9-mi/h) speed reduction. A single lateral dislocation is predicted to reduce speed by 2.0 km/h (1.2 mi/h), while a double lateral dislocation by 4.7 km/h (2.9 mi/h).) Zaidel et al. in 1992 surveyed individuals and organizations about speed-reduction devices. Based on 23 responses from 13 countries, they concluded that "many communities in several countries experienced neither vehicle damage nor driver loss of control when passing over humps. Also, no real operational or comfort problems with bus, truck, or emergency vehicles were reported." 9. Guidelines for Speed Hump Use Drawing upon experiences with speed humps, the ITE proposed the following guidelines:
In the United Kingdom, road hump regulations were first issued in 1983, with more flexible regulations in 1986 and 1990 (Road Safety Division, 1993). Among other changes, the 1990 regulations allowed tapered-edge and flat-top humps in addition to the conventional round-top, curb-to-curb hump. The new regulations allow humps at pelican[1] crossings and do not limit the number of humps in a series. When a hump coincides with a crossing, only flat-top humps should be used. Humps may not be placed closer than 30 m (98 ft) from a pelican or zebra crossing. Pavement markings delineating a crossing should be placed along the flat top of the hump, not on the ramps leading to and from the hump. A tactile surface may be necessary to indicate the sidewalk/street edge for pedestrians with vision impairments. At junctions, humps across side streets can be set back 5-8 m (16-26 ft) from the main road to discourage pedestrians from crossing the side street to near the main road and thereby reduce conflicts between pedestrians and turning traffic (Speed Control Humps, 1990). Although speed humps reduce vehicular speeds and volumes to the benefit of pedestrians, they have their disadvantages. Adjacent residential streets and arterials are likely to experience higher levels of traffic as motorists are diverted from the treated street. The noise caused by vehicle acceleration and "thumping" over humps may disturb residents who live near the humps. Signing and pavement markings can render humps unattractive. Because humps reduce speeds, emergency response time may increase. They can impede maintenance activities such as sweeping and snowplowing and may affect drainage (Clarke and Dornfield, 1994). Speed humps also require extra care when resurfacing of the street is required. Thus, speed humps are certainly not a cure-all for traffic problems on residential streets. Less restrictive and more passive devices that may address these problems should be considered first. However, where high vehicle speeds create an unsafe environment on local streets, speed humps may be one possible treatment. Care should be taken to inform the residents of the advantages and disadvantages of the humps before they are installed. Residents should provide a show of consensus for the humps, particularly those who will be most directly affected. 10. Bulbouts and Street Narrowing The purpose of a bulbout, also known as a choker, bulbout, or curb bulb, is to reduce the width of the vehicle travel way at either an intersection or a midblock pedestrian crossing location. It shortens the street crossing distance for pedestrians, may slow vehicle speeds, and provides pedestrians and motorists with an improved view of one another, thereby reducing the risk of a motor vehicle-pedestrian collision.
In two Australian cities, Keilor (Queensland) and Eltham (Victoria), "curb blisters" (i.e., bulbouts) had little effect on reducing vehicle speeds (Hawley et al., 1992). However, in Concord, New South Wales, a comparison of a subarterial street with both curb blisters and marked parking lanes versus an untreated street showed that the crash rate on the treated street was only one-third that of the untreated street (Hawley et al., 1992). The number of these crashes involving pedestrians was not stated, nor is it known how the streets compared before treatment. Australia's "wombat" crossings usually consist of a raised platform with a marked crosswalk on top, and a refuge and curb blisters where space permits. Thus, they combine features of speed tables and bulbouts. They are designed to slow motorists, shorten pedestrian exposure to motor vehicles, and increase pedestrian visibility to motorists. Wombat crossings have generally reduced 85th percentile vehicle speeds by 40 percent (Hawley et al., 1992). Anne Arundel County, MD, has been using a combination of medians and bulbouts near intersections. The medians narrow the traveled way, while the bulbouts force drivers to make a lateral deflection as they enter the narrowed area. Medians with lateral deflection have reduced the 85th percentile speeds by 3-8 km/h (2-5 mi/h) (Walter, 1995). The Dutch towns of Oosterhout and De Meern have installed street-narrowing variations. The Oosterhout project consisted of installing two bulbouts so as to require motorists to deviate from a straight path. Both the 85th percentile vehicle speed and the degree of pedestrian-motor vehicle conflict fell after the deviation was installed. De Meern's deviation was created by placing two bulbouts opposite one another to narrow the width of the traveled way. A significant reduction in the 85th percentile vehicle speed was observed at the deviation. Opinions of the deviation in De Meern were mixed. There was not a strong sense of neighborhood improvement among residents. Swerving cars were thought to endanger bicyclists. School teachers thought that children would be confused by the deviation. Retailers were concerned about accessibility and parking. There was little concern about emergency vehicle access (Replogle, 1992). Macbeth in 1995 reported favorable speed changes seen on five raised and narrowed intersections and seven midblock bulbouts (two raised). The speed limit was also lowered to 30 km/h (19 mi/h). The results of speed changes are given below.
11. Roundabouts In a Toronto traffic engineering workshop, Frederick (1995) reported modest reductions in 85th percentile speed after traffic circles were installed. It was reported that local citizens asked for traffic- calming measures (Herget, 1995). Before the installation, the 85th percentile speed was 43-50 km/h (27-31 mi/h) and 81 percent of traffic was non-local. Two roundabouts were installed and 81 percent of citizens in the area approved. Herget said there was no measurable effect of the application. More recently, the Insurance Institute for Highway Safety found in 2000 that roundabouts reduce crashes when compared to intersections with signals or stop signs, especially when injuries are considered. Researchers at the University of Maine, Ryerson Polytechnic University, and the Institute studied crashes and injuries at 24 intersections before and after the construction of roundabouts. Though the study found that fewer pedestrian crashes occurred when roundabouts were installed, the numbers were too small to be statistically significant. Accordingly, the topic of roundabouts and pedestrian safety remain controversial, especially for people with disabilities. For motorists, however, the study found a 39-percent overall decrease in crashes, a 76-percent decrease in injury-producing crashes, and a 90-percent decrease in crashes involving fatal or incapacitating injuries. 12. Cul de sacs In the 1970's, Australia implemented street closures "on the grounds that the problem was caused by excessive connectivity in the network" (Brindle, 1997, page 26), but now latter-day planners want to return to connective local street networks as part of a neotraditional neighborhood design. A disadvantage to cul de sacs is that extra right-of-way is needed to build the turnarounds. If complete closures are built, blocking pedestrian and bicycle access, it may make travel by automobile more attractive. The authors cite the "benefits" of the neotraditional designs as coming from "increased density, a mix of land uses, and a grid transportation system" (Szplett and Sale, 1997, page 42), but they acknowledge the opposing view, saying "The volume of traffic is often a rallying point for the neighbors in an adjoining residential area who are opposed to the project. The authors' experience is that the higher density is another element of citizen complaints" (p. 43). 13. Emergency Vehicles Some apprehensions about certain traffic-calming measures relate to fears that emergency vehicles will be delayed in responding, and the traffic-calming facilities will make vehicle access more difficult. Atkins and Coleman (1997) report the results of their study of several types of emergency vehicles, with several drivers, in negotiating several types of traffic-calming devices including humps and roundabouts. This was carried out as an experiment in non-emergency situations. They report that the delay was 0 or 1 second in some cases, ranging up to 10 seconds, maximum, in others. They did not report the duration of the typical emergency run, but an additional 10 seconds is within the variation imposed by random factors encountered on such runs. Despite this, many emergency service providers may be opposed to certain traffic-calming projects; some that involve street closures, medians, chokers or other street-narrowing projects may make it more difficult for large fire trucks to negotiate the streets. It is always a good practice to have the local fire officials review the project to make sure that essential emergency services will not be unnecessarily disrupted. Implementing traffic-calming projects on streets that provide primary access to fire stations, hospitals, and other emergency services should be carefully evaluated. 14. Traffic Diversion Traffic diversion can be accomplished by street closures, diverters, and signs restricting access, either during the peak travel hours or on a 24-hour basis. Traffic diversion projects are designed to shift traffic off of a neighborhood street that is suffering from cut-through traffic onto other streets. If these "other streets" are major streets or arterial roads, the project generally can be considered successful. If the traffic is shifted onto adjacent neighborhood streets, the problem is merely transplanted, not solved.
Parent in 1995 reported that certain roads were closed for a year. When reopened, various traffic- calming measures had been installed such as chicanes and narrowing. He reports that ADT was diminished from 3,865 to 1,850. Speed was reduced by 14 percent. Local citizens in the neighborhood rated the changes as good. He did not discuss what happened to the 2,000 vehicles per day that "disappeared." Where did they go? Were they safely diverted? Was the total system better? When considering traffic diversion projects, the entire neighborhood area must be included in the decisionmaking process. This will allow input from the entire affected area and will prevent one part of the neighborhood's being sacrificed to benefit another part. The boundaries of the affected neighborhood should be broadened to include more than one or two streets that may be currently suffering from cut-through traffic. Traffic diversion projects often limit resident access, as well as access for their guests and service vehicles. The affected residents should provide input into the change or loss of access to ensure that the tradeoffs will be acceptable. Often, the traffic restrictions can be tested and evaluated before they are made permanent. A test period can be used to identify potential problems to residents and emergency and school access, and to allow for adjustments to accommodate those problems that were not readily apparent at the outset of the project.
Traffic Calming in Original ConstructionMany residential streets have been designed to provide the most convenient automobile access, with little thought of the high traffic levels and speeds that may result. In some cases, the curb returns and street widths are designed to allow easy access to the largest moving van that may serve an area. While it is important to provide access to fire trucks and school buses, some communities may be able to make significant changes to the layout and design of their neighborhood streets as a part of the design and review process to eliminate the potential for cut--through traffic or speeding before the neighborhood streets are built. This can include narrowing streets, providing smaller turn radii at corners, and preventing long straight streets that are unobstructed. Roundabouts and discontinuous street paths can be supplemented with connective bike and pedestrian paths to provide ideal access to transit, schools, and adjacent shopping areas. Access to a large neighborhood should not be limited to one or two entry points, and an adequate system of arterial and collector streets should be provided to diminish the attractiveness of using local streets. West and Lowe make the point that traffic-calming measures are often thought of as modifications to an existing facility, but they urge consideration for traffic-calming designs in original construction (1997).
Effectiveness EvaluationSome documents on traffic calming report numerical changes in before-versus-after analyses. In many cases, it appears that the traffic calming measures had the desired effect of slowing or diverting traffic. Likewise, fewer "after" crashes are reported in many cases. In some instances, little or no change is noted. In many of these reports, it is not clear just how the evaluation was conducted. Leonard and Davis (1997) cite a lack of evaluation of traffic calming installations (page 36) and list some indicators they say should be used in evaluation:
Spielberg (1994) spells out research needs:
The report also provides a good list of references. Skene et al. (1997) comment that much is done in the name of traffic calming, but they say effectiveness is largely unknown. On page 34 they state "there is little information available regarding the applicability, effectiveness, and geometric characteristics of various traffic-calming devices." They also say there is little information on the adverse effects of traffic-calming initiatives. Nevertheless, before-and-after data are reported for many projects. In "Traffic Calming in Practice" prepared by the County Surveyors Society in England and published by Landor Publishing Limited in November, 1994, a total of 85 case studies is reported; in 74 cases, before-and-after-crash data are cited. In 69 of those cases, the crashes after were fewer than before; in three cases, crashes were more numerous, and in two cases there was no change. The sheer number of projects that experienced safety benefits is persuasive to a degree, especially when the very nature of the traffic-calming measures was intended to reduce speeds and in some cases to induce traffic to go elsewhere. However, one cannot know the study designs used, most notably what factors dictated the particular intervention at the particular site, and therefore the possible role of regression to the mean.
Sidewalks and Pedestrian PathsThe 1992 Uniform Vehicle Code defines a sidewalk as "that portion of a street between the curblines, or the lateral lines of a roadway, and the adjacent property lines, intended for use by pedestrians." Several types of pedestrian walkways have been defined (Work Zone Traffic Management, 1989; Zegeer and Zegeer, 1988):
A study by Tobey et. al. (1983) investigated the safety effects of sidewalks. Sites with no sidewalks or pathways were the most hazardous for pedestrians, with pedestrian hazard scores of +2.6 and a PxV exposure score (i.e., exposure measure equals pedestrian volumes [P] times traffic volume [V]) of +2.2. This indicates that crashes at sites without sidewalks are more than twice as likely to occur than expected. Sites with sidewalks on one side of the road had pedestrian volume and PxV hazard scores of +1.2 and +1.1, compared with scores of -1.2 and -1.2 for sites with sidewalks on both sides of the road. Thus, sites with no sidewalks were the most hazardous to pedestrians, and sites where sidewalks were present on both sides of the road were least hazardous. A later study by Knoblauch et al. (1987) developed guidelines for sidewalk installation separately for new and existing streets. A variety of factors are widely acknowledged to have an impact on the risk of pedestrian motor vehicle injuries. Those most extensively researched are geometric characteristics of the road, including the presence of sidewalks. However, until recently, factors relating to demographics and neighborhood characteristics have been mentioned but not sufficiently researched. To address that problem, McMahon, et al. (2000) used a case-control methodology and applied conditional and binary logistic models to determine the effects of cross-sectional roadway design attributes and socioeconomic and other census block group data on the likelihood that a site is a crash site. A total of 47 crash sites and 94 comparison sites were analyzed. Physical design factors found to be associated with significantly higher likelihood of being a crash site are higher speed limit, the lack of wide grassy walkable areas, and the absence of sidewalks. When these roadway factors are controlled for, non-geometric factors associated with significantly higher likelihood of being a crash site are high levels of unemployment, older housing stock, and more single parents. This information suggest that some neighborhoods may, due to increased exposure or specific types of exposure, be especially appropriate sites for pedestrian safety measures such as sidewalks, lower speed roadway designs, and the addition of wide grassy shoulders. That FHWA study also developed guidelines and priorities for installing sidewalks and walkways, as shown in table 31.
Education CountermeasuresNumerous studies have evaluated efforts of educational programs on pedestrian behavior. For example, the NHTSA film on "Willie Whistle" is aimed at grades kindergarten through 3, and teaches children the safe way to cross streets (Blomberg et al., 1983). It is 7 minutes long and contains live action plus animation. It is directed at reducing midblock dart-out or dash crashes by teaching children always to stop at the curb and look left-right-left before entering the street. After extensive testing in Los Angeles, Columbus, and Milwaukee, the film was reported to reduce dart and dash crashes by more than 30 percent among 4- to 6-year old children, as illustrated in figure 49. Non-midblock pedestrian crashes were used as a control group, since they were not considered to be affected by the "Willie Whistle" program. Crashes in this group remained relatively unchanged, suggesting that the drop in midblock pedestrian crashes was the result of the educational messages and not a general decline in pedestrian crashes. A 15-minute follow-up educational film called "And Keep On Looking" (Preusser and Lund, 1988) was later developed by NHTSA to convey street-crossing advice to older children (grades 4-7), such as crossing busy streets, safety in parking lots, and crossing at signalized locations. The effectiveness of this film was examined through testing in Connecticut, Seattle, and Milwaukee. In a 2-year test in Milwaukee of the film's effects, the number of 9- to 12-year olds involved in pedestrian crashes decreased by more than 20 percent. Positive results were also found in Seattle in terms of children's observed behavior and in Connecticut through retained information after viewing the film. Other less formal evaluations of pedestrian educational programs have been conducted in the past 20 years, including:
In recent years, a number of other pedestrian educational programs have been developed in the U.S. and abroad, although no formal evaluations are available for many of these. Most were directed at helping various pedestrian age groups, but a few were intended for either the parents or teachers of young children. As discussed in the WALK ALERT Program Guide, some of these pedestrian educational materials include the following (National Safety Council, 1988):
Since driver education is also an important component of pedestrian safety, numerous programs directed at drivers are also available, including:
Education is certainly an essential ingredient of pedestrian safety programs along with engineering and enforcement. Cities that historically have had a low incidence of pedestrian crashes have typically had active pedestrian-education programs. More information on various educational programs for pedestrian safety and specific messages is available (National Safety Council, 1988; Preusser, 1988). Media campaigns are one form of education, and they are sometimes accompanied by the promise of intensified law enforcement. Two studies carried out in Canada are illustrative. In one, a multimedia campaign targeted left turns, aimed at increasing the proportion of drivers who yield to pedestrians (Koenig and Wu, 1994). No enforcement emphasis was mentioned. Failure to yield was 25 percent before and 17 percent after. No change was seen in right-turn behavior, which was not targeted. Another study, in Seattle, reported little success (Britt et al., 1995). These authors evaluated a 4-year study in Seattle. Driver behavior at crosswalks was observed; compliance with the yield law was not great (15 to 20 percent). A media campaign accompanied the enforcement effort, but it is not clear whether the intensity of either was maintained during the full 4-year period. Enforcement seemed to produce a slight improvement in compliance, but the authors said they were " . . . unable to demonstrate that law enforcement efforts directed at motorists' violations of crosswalk laws significantly or consistently increase drivers' willingness to stop for pedestrians." (p. 166) It seems reasonable to believe that many pedestrian collisions are the result of poor behavior on the part of pedestrians and drivers. This would indicate that educational countermeasures could improve pedestrian safety. Many public information and education campaigns have been conducted to improve pedestrian and driver behavior. However, there is a clear need for further development and widespread use of effective pedestrian-safety programs that are targeted at children of various ages, parents, and drivers.
Enforcement and RegulationsIn addition to engineering and education, enforcement of traffic laws and regulations is another important element in safe pedestrian activity. This means curtailing dangerous motorist actions that relate to pedestrians. Motorists who exceed the speed limit, fail to yield the right of way to pedestrians when turning, run a red light or stop sign, and/or drink and drive can place pedestrians in jeopardy. Strong police enforcement programs are needed to help reduce these violations (National Safety Council, 1988). Giving citations to pedestrians (for jaywalking, etc.) has not been shown to be effective in improving behavior, and can create a public-relations problem for local police departments. Unfortunately, no quantitative studies could be found that determined the specific effects of various types of police enforcement on pedestrian crashes and injuries. However, many U.S. cities with exemplary pedestrian safety achievements (such as Milwaukee, Seattle, and San Diego) have maintained active enforcement programs along with other pedestrian safety measures (National Safety Council, 1988). The effect of enforcement alone is difficult to quantify because so many factors affect pedestrian crash experience over a given time period. Several model pedestrian ordinances have been developed by NHTSA that have the potential to reduce certain types of pedestrian crashes. These include the following (National Safety Council, 1988; Development of Model Regulations, 1974; Model Ice Cream Truck Ordinance, 1979, Enforcement-Policing Pedestrian Protection, 1988):
The above ordinances can help reduce pedestrian crashes when implemented and followed by local jurisdictions. Effective police enforcement may be needed to help ensure reasonably high compliance with these and other ordinances. Enforcement efforts have been most effective when they are long term and consistent, have strong support from top management, and are upheld by the local judicial system (National Safety Council, 1988). [1]As used in England, pelican crossings are midblock crossings controlled by traffic signals and pushbutton pedestrian signals. The pushbutton hardware lights up and conveys specific messages to pedestrians during each interval (walk phase, clearance phase, and don't walk phase), with dashed (not solid) parallel lines to mark the crosswalk (Zegeer, et al., 1994).
FHWA-RD-03-042 |
|||||||||||||||||||||||||||||||||||||||||||||||||||||||||||||||||||||||||||||||||||||||||||||||||||||||||||||||||||||||||||||||||||||||||||||||||||||||||||||||||||||||||||||||||||||||||||||||||||||||||||||||||||||||||||||||||||||||||||||||||||||||||||||||||||||||||||||||||||||||||||||||||||||||||||||||||||||||||||||||||||||||||||||||||||||||||||||||||||||||||||||||||||||||||||||||||||||||||||||||||||||||||||||||||||||||||||||||||||||||||||||||||||||||||||||||||||||||||||||