U.S. Department of Transportation
Federal Highway Administration
1200 New Jersey Avenue, SE
Washington, DC 20590
202-366-4000
Federal Highway Administration Research and Technology
Coordinating, Developing, and Delivering Highway Transportation Innovations
 |
| This report is an archived publication and may contain dated technical, contact, and link information |
|
Publication Number: FHWA-HRT-05-087
Date: July 2006 |
Federal Highway Administration University Course on Bicycle and Pedestrian TransportationPDF Version (238 KB) PDF files can be viewed with the Acrobat® Reader®
LESSON 2: BICYCLING AND WALKING IN THE UNITED STATES TODAY
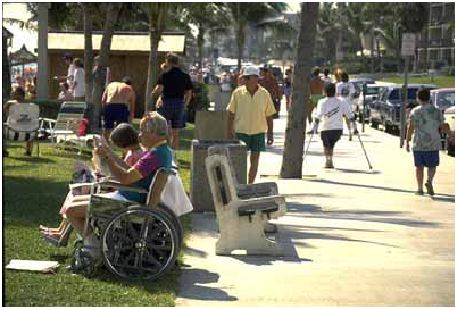
2.1 IntroductionIt is generally acknowledged that nonmotorized travel modes are not being used as extensively as they could be in the United States. This lesson describes current levels of bicycle and pedestrian activity, and it specifically examines the reasons why bicycling and walking are not used more widely as travel modes. This lesson explores patterns of pedestrian and bicycle travel, particularly as they relate to design issues and allocation of right–of–way space. In order to adequately plan and design for bicycles and pedestrians, it is important to understand current patterns of travel as well as the desire for increased mobility. Although children, older adults, and people with disabilities make up a large percentage of the population (up to 37 percent of most States), their needs are seldom adequately considered in transportation system planning and design (see figure 2–1). Increasing transportation accessibility for users with disabilities increases the accessibility for all users. This lesson discusses these and other pertinent issues that affect bicycle and pedestrian travel in the United States today.(1) The major sections of this lesson are as follows:
2.2 Current Levels of Bicycling and WalkingA number of surveys confirm that bicycling and walking are activities enjoyed by increasing numbers of Americans of all ages:
Bicycling and walking are clearly popular activities, whether for sport, recreation, exercise, or simply for relaxation and enjoyment of the outdoors. As the following surveys indicate, however, their potential as modes of transportation is just beginning to be realized. 2001 NHTS The primary source of information on utilitarian as well as recreational bicycling and walking in the United States is the NHTS.(5) The survey is conducted approximately every 5 to 7 years, with the most recent survey taken in 2001. NHTS survey data are collected from a sample of U.S. households and expanded to provide national estimates of trips and miles by travel mode, trip purpose, and a host of household attributes (see figure 2–2).
The 2001 NHTS collected travel data from a national sample of approximately 66,000 households. The NHTS was conducted using computer–assisted telephone interviewing (CATI) technology. Each household in the sample was assigned a specific 24–hour "Travel Day" and kept diaries to record all travel by all household members for the assigned day. A 28–day travel period was assigned to collect longer–distance travel [over 80.5 km (50 mi) from home] for each household member and includes information on long commutes, airport access, and overnight stays.(5) Results revealed that 8.6 percent of all trips were by walking and 0.9 percent by bicycling. The survey techniques used for the 2001 NHTS varied in their measurement of walking trips; thus, what appears to be an increase in walking trips from the 1995 Nationwide Personal Transportation Survey (NPTS) (which indicated that walking trips were 5.4 percent of total trips) may in fact be due to the change in sampling methodologies.(6) In 2003, the Eno Transportation Foundation profiled transportation trends in an article in the Transportation Quarterly titled "Socioeconomics of Urban Travel: Evidence from the 2001 NHTS." In it, the authors make the following conclusions regarding walking:(7) Walking is probably the most ignored mode of transport, both in general as well as in reference to its importance among the disadvantaged . . . walking accounts for 16.2 percent of the trips by the poor, 12.6 percent of trips by blacks, and 11.8 percent of the trips of Hispanics. Yet in the United States, facilities for pedestrians are often inconvenient or nonexistent, leading to fatality rates per mile traveled 36 times higher than for occupants of cars and light trucks. The lack of pedestrian safety especially affects minorities and the poor. For example, blacks account for 20 percent of all pedestrian deaths, almost twice their 12 percent share of the total population. There are significant regional differences in amount of walking trips that occur in different geographic regions of the United States. As calculated by the authors of the Transportation Quarterly article, table 2–1 shows regional variations in modal shares for transit, walking, and bicycling.(7) As expected, nonmotorized modes are used to a greater extent in areas of the country with more extensive public transit systems and in cities that are oriented to transit use.
Table 2–1. Regional variations in modal shares for transit, walking, and bicycling.
As with previous federally sponsored transportation surveys, the 2001 NHTS collected data on trip purpose and trip length. Results show that more than half of the bicycle trips and a third of the walking trips are for social or recreational purposes. Family and personal business travel, along with school and church–related travel, were also significant contributors. The average length of a travel trip is 0.97 km (0.6mi) for walking and 3.2 km (2.0 mi) for bicycling. Other National Surveys A second source of information on utilitarian bicycling and walking is the U.S. Census "Journey to Work" survey.(8) The survey is conducted every 10 years and is targeted toward participants in the work force age 16 or older. It is important to note that the U.S. Census survey reports on travel to and from work only, excluding trips to school, shopping, and other frequent destinations. Data are collected for a one–week period during the last week in March, making it likely that bicycling and walking trips are underreported for many parts of the country due to cold weather. Moreover, only the predominant transportation mode is requested, so that occasional bicycling and walking trips as well as bicycling and walking trips, made to access transit or other travel modes, are not recorded. With these limitations in mind, in 2000, an estimated 3.8 million people (3.9 percent of all workers) commuted to work by walking, and just under one–half million (0.4 percent) commuted by bicycle. These are national averages; some cities had much higher percentages of people walking or bicycling to work. It should be noted, however, that the overall percentages for 1990 are down slightly from the 1980 Census results, which showed 5.3 percent of persons commuting by walking and 1.4 percent by bicycling. The 2002 National Survey of Pedestrian and Bicyclist Attitudes and Behaviors was sponsored by the USDOT NHTSA and Bureau of Transportation Statistics to gauge pedestrian and bicyclists trips, behaviors, and attitudes (see http://www.bicyclinginfo.org/survey2002.htm).(9) According to the survey, approximately 57 million people, 27.3 percent of the population age 16 or older, rode a bicycle at least once during the summer of 2002. The survey breaks this down by gender, age, and race/ethnicity (see figure 2–3).
Comparisons between 1990 and 2000 Census data have provided some of the first evidence in the United States that higher levels of bicycle commuting result in areas where trails and on–road bicycle networks have been built. In Portland, OR and Washington, DC, local planners have used geographic information systems (GIS) to overlay the established trail networks with the 2000 census data to compare commute rates along census tracts that lie near trails and bikeways. In both cities, census tracts that lie adjacent to or near trails and bikeways exhibited levels of bicycle commuting that are higher than the local averages.
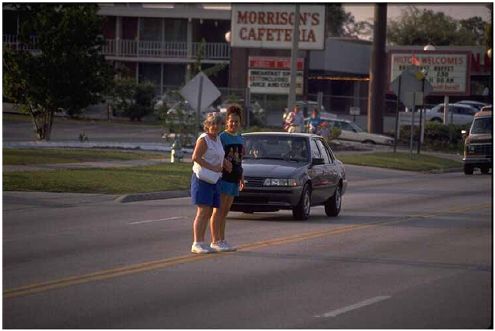
2.3 Factors Influencing the Decision to Bicycle or WalkMany factors influence choice of travel mode and, in particular, the decision to bicycle or walk. These factors operate at different levels in the decision process. An analysis in the early 1990s identified a three–tiered hierarchy of factors categorized according to initial considerations, trip barriers, and destination barriers.(10) Initial Considerations Many people may never seriously consider the transportation options of bicycling and walking. Overcoming the status quo of automatically relying on a car to travel the 4.8 km (3 mi) to work or three blocks to the drugstore is an important first step in broadening the base of bicyclists and walkers. Activities such as Bike to Work days have been successfully employed in many communities to increase awareness of bicycling and walking as viable means of transport. Either distance, or its companion factor, time, is often cited as a reason for not bicycling or walking. According to 2001 NHTS results, the average length of travel while shopping and taking other utilitarian trips are short. More importantly, nearly half of all travel trips are 4.8 km (3 mi) or less. All of these trips are within reasonable bicycling distance, if not within walking distance. Individual attitudes and values are also important in the decision to bicycle or walk. People may choose not to bicycle or walk because they perceive these activities as uncool, as children’s activities, or as socially inappropriate for those who can afford a car. Others may have quite different values, viewing bicycling and walking as beneficial to the environment, healthy, economical, and free from the problems of contending with traffic, or finding parking. These, and the many other benefits of bicycling and walking described previously, often influence people to begin bicycling and walking on a regular basis. Individual perceptions (and misconceptions) also play a role in the decision process. Safety concerns such as traveling at night must be addressed. Although many bicycling and walking trips may be accomplished at low levels of exertion, some people perceive that these activities are beyond their capabilities.(11) While a small portion of the population may not have the physical capabilities to walk to a destination or ride a bicycle, for most people, these activities are well within their abilities. Also, as stamina and skill increase, such activities become easier and more enjoyable. Finally, there are situational constraints that, while they may not totally preclude the decision to bicycle or walk, do require additional planning and effort. Examples include needing a car at work, having to transport items that are heavy or bulky, and needing to drop off children at daycare. While these situations may make it more difficult to bicycle or walk, they can often be overcome with advance planning. More analysis of these issues would be useful. If bicycling and walking are not appropriate for one particular trip, there are still a number of trips during the course of a day or week in which bicycling and walking are viable options. Trip BarriersEven with a favorable disposition toward bicycling and walking, reasonable trip distances, and absence of situational constraints, many factors can still encourage or discourage the decision to bicycle or walk. One of the most frequently cited reasons for not bicycling or walking is fear for safety in traffic.(11) Given the prevailing traffic conditions found in many urban and suburban areas—narrow travel lanes, high motor vehicle speeds, congestion, lack of sidewalks, pollution, etc.—many individuals who could meet their transportation needs by bicycling or walking do not, simply because they perceive too great a risk to their safety and health (see figure 2–4).
Figure 2–4. Photo. Street crossings can be a significant barrier to walking. Perceptions of safety as well as actual safety problems must be addressed at the local level. Locational constraints such as lack of alternatives to high–speed, high motor vehicle volume roadways must be carefully handled. Adequate facilities can help overcome many of these safety concerns, whether they are sidewalks for walking, smooth shoulders, wide curb lanes, bicycle lanes, or off–road paths for the enjoyment of both bicyclists and walkers. Traffic calming measures are another way to enhance bicycle and pedestrian safety and accommodation. Traffic safety can also be improved through education and law enforcement activities. Training opportunities that help bicyclists feel more competent riding in traffic, campaigns that remind motorists to share the road, and efforts to cite motorists who fail to yield to pedestrians at intersections are just a few examples. Even communities with well–designed bicycling and walking facilities can still be plagued by problems with access and linkage. A beautifully designed and constructed off–road facility is useless to the bicyclist or pedestrian who cannot traverse a narrow bridge or cross a freeway to get to it. Similarly, facilities that do not connect neighborhoods to shopping areas or downtown businesses may never achieve their intended purpose of increased use of nonmotorized travel modes. Directness of the route and personal safety and security considerations are also important factors in people’s decisions to bicycle or walk. Environmental factors could also be considered in this category of trip barriers. Examples include hilly terrain, extreme temperatures, high humidity, and frequent or heavy rainfall. Like many of the other trip barriers cited, these are to a great extent subjective and have been dealt with by those already engaging in these activities, many of whom have effectively overcome these difficulties. For potential users, these issues must be addressed and overcome if possible. Destination BarriersFacility and infrastructure needs do not stop with arrival at the work site or other destination. Many bicyclists are discouraged from becoming bicycle commuters because once at work they have no place to safely park their bicycle and no place where they can shower and change (although if the trip is made at lower levels of exertion, showering, and changing clothes may not be necessary). Secure bicycle parking deserves special attention. The availability of parking is a prerequisite for automobile use; the same holds true for bicycling. Bicyclists are further burdened by the possibility of theft or damage to their bicycles. A Baltimore, MD, survey of bicyclists reported that 25 percent had suffered theft, with 20 percent of those giving up bicycling as a result. In New York City, bicycle theft numbers in the thousands annually. Even when parked securely, bicycles are frequently exposed to damage from rain and other environmental conditions. Secure parking areas for bicycles are necessary before bicycle use will increase. Destination barriers can also take a less tangible form, such as a lack of support from employers and co–workers. Such support can be particularly important for sustaining a long–term commitment to bicycling or walking. In some cases, this support may be tangible, such as a discount on insurance costs or reimbursed parking expenses. In other cases, it may be less tangible, but equally important, such as allowing a less formal dress code or establishing a policy of flextime so that employees do not have to commute during the heaviest traffic times or in darkness. To summarize, a variety of factors enter into the decision to walk or bike for utilitarian purposes. Some of these, such as trip distance, must be considered at the very outset of the decision and the process. It must be addressed if current levels of bicycling and walking are to be increased.(1)
2.4 Potential for Increasing Bicycling and WalkingWhat is the potential for increasing bicycling and walking in the United States? Can the relatively high levels of bicycling and walking found in cities such as Davis, CA, and Madison, WI, be duplicated in other communities? Can U.S. cities approach the high usage levels found in some European and Asian cities? Clearly, if aggregate levels of bicycling and walking are to be increased, changes must occur to remove the barriers previously discussed. This section identifies a variety of factors that impact the potential of bicycling and walking to become viable transportation modes in the United States. Public Support for Bicycling and WalkingAs mentioned in the previous chapter, the public already strongly supports increased travel options. The 1991 Harris Poll cited earlier showed that 46 percent of adults age 18 and older—82 million Americans— had ridden a bicycle in the previous year. Of these:
Other ConsiderationsOther factors can also significantly impact the potential for bicycling and walking in the United States. Of particular relevance are: (1) the linkage of bicycle and pedestrian travel to transit, (2) the expansion of recreational bicycling and walking to more utilitarian uses, and (3) the potential impact of bicycle design technology. The transit connection. The potential for bicyclist and pedestrian integration with transit is enormous. According to 2001 NHTS data, more than half of all people nationwide live less than 3.2 km (2 mi) from the closest public transportation route. The median length of an automobile trip to access a park–and–ride lot for public transit is less than 4.8 km (3 mi); and for a kiss–and–ride trip in which a passenger is dropped off, median trip length ranges from 2.1 to 2.6 km (1.3 to 1.6 mi).(13) Since these short–distance, cold–start motor vehicle trips generate significant pollution, improved bicyclist and pedestrian access to transit can also reap environmental benefits. A 1980 Chicago area transportation study found bike–and–ride to be by far the most cost–effective means of reducing hydrocarbon emissions. The conversion of only 10 percent of park–and–ride commuters to bike–and–ride could result in gasoline savings of more than 2.2 million gallons annually.(13) While much potential remains unrealized, the bicycle–transit link is gaining momentum:
Recreational bicycling and walking. The popularity of bicycling and walking as both recreational activities and healthy forms of outdoor exercise is well documented. Over the past decade, both activities have enjoyed widespread and growing participation by the American public. The distinction between recreational bicycling and walking and utilitarian bicycling and walking is not always clear–cut. One approach is to classify a bicycle or walking trip as utilitarian only if it would otherwise have been made by an alternative mode of transport, such as a car or bus (the mode substitution test). By this definition, the age of the person and the nature of the facility on which the travel takes place do not enter into consideration. If a child rides a bicycle, even on the sidewalk, down the street to a friend’s house, this is a legitimate transportation trip. According to the Bicycle Federation of America (BFA), there are already an estimated 131 million recreational bicyclists and walkers. These people have demonstrated their ability to travel under their own power. They have also experienced firsthand the physical, psychological, and other benefits of bicycling and walking. This population will be instrumental in achieving the goal of doubling the percentage of utilitarian bicycling and walking. The primary question that remains is how to convert more of these recreational bicyclists and walkers to persons using these modes for utilitarian travel. The 1991 Harris Poll suggests that at least part of the answer lies in improving existing facilities for bicycling and walking, building sidewalks and designated bicycle facilities, installing secure bicycle parking at destinations, etc.(11) Other surveys support this conclusion.(12) However, it is uncertain to what extent a person’s professed intention to bicycle or walk (if certain facilities are made available) will correspond to actual changes in their travel behavior, should these improvements be realized. Nevertheless, recreational bicyclists and walkers represent a strong candidate pool of potential bicycling and walking commuters. Bicycle design technology. Another factor that may affect the potential for increased bicycling is the bicycle itself, along with the many accessories that accompany it. The resurgence of bicycling in the 1980s may be partially credited to the development of mountain bikes. Technological innovations and highly functional design have made this type of bicycle user–friendly and versatile for a wide range of people and uses. New bicycle designs, some of which are just now appearing and are appropriate for transit interface, short–distance cargo carrying, and easy use, further broaden ridership. Perhaps a more intelligent bicycle design can contribute to a significant increase in utilitarian bicycle trips.(1)
2.5 Need for Action: Pedestrians and Bicyclists at RiskAn increasing percentage of the U.S. population is affected if pedestrians and bicyclists are not accommodated in transportation facilities and programs. Children, older adults, and people with disabilities make up a substantial portion of the population—up to 37 percent in some States. To maintain independence and mobility, these people walk and ride bicycles. Age groups affected. More than other age groups, children and older adults (age 66+) rely on walking or bicycling as their primary transportation mode. They have few options in most cases. They must achieve mobility within the physical limitations associated with old age and with the early stages of children’s physical development:
Bicycle and pedestrian crashes. Children and older adults are highly overrepresented in bicycling and pedestrian crash statistics. Approximately 4,900 pedestrians and 700 bicyclists are killed each year as a result of collisions with motor vehicles. As a group, pedestrians and bicyclists comprise more than 14 percent of all highway fatalities each year. Pedestrians account for as much as 40 to 50 percent of traffic fatalities in some large urban areas.(13)
2.6 Student ExercisesThe following are suggested ideas for student exercises. Exercise AList and describe several issues or limitations related to walking or cycling and how they can be overcome (e.g., land use, weather, facilities at the workplace, connectivity, etc.) Exercise BSearch the county or city statistics on factors that effect bicycle and pedestrian usage (e.g., number of miles of bike facilities or sidewalks, connectivity, access by car, portage on transit). Exercise CGather statistics on mode share for the county or city, and document the general planning and design for the network system. Is it a grid system, and how connected are transit, bike, and pedestrian systems, etc.? Exercise DWrite an essay on how you would get around your city or town if you had only a defined amount of gasoline, which might vary depending on location. Keep a diary for a week, indicating method of travel for each type of trip, mode taken, trip distance, duration, and other important details. 2.7 References and Additional ResourcesThe references for this lesson are:
Additional resources for this lesson include:
FHWA-HRT-05-087 |