U.S. Department of Transportation
Federal Highway Administration
1200 New Jersey Avenue, SE
Washington, DC 20590
202-366-4000
Federal Highway Administration Research and Technology
Coordinating, Developing, and Delivering Highway Transportation Innovations
 |
| This report is an archived publication and may contain dated technical, contact, and link information |
|
Publication Number: FHWA-HRT-05-091
Date: July 2006 |
Federal Highway Administration University Course on Bicycle and Pedestrian TransportationPDF Version (471 KB) PDF files can be viewed with the Acrobat® Reader®
LESSON 4: BICYCLE AND PEDESTRIAN PLANNING
4.1 IntroductionThe rising awareness of bicycle and pedestrian issues in transportation planning has brought with it a new era of planning for these modes. Planning strategies range from small scale (such as a study to improve bicycle and pedestrian access to a neighborhood bus stop) to large scale (such as a statewide master plan for bicycling and walking). Additionally, bicycle and pedestrian planning includes planning provisions to make streets accessible for all users, including those with disabilities. Increasing the accessibility for users with disabilities increases the accessibility for all users. While there are some common elements (such as public participation) that nearly all bicycle and pedestrian planning projects should include, such projects otherwise can vary greatly, depending upon the particular situation. An effective, interconnected system of bicycle and pedestrian facilities requires planning at a variety of levels. This lesson provides an overview of bicycle and pedestrian planning issues, and it presents a variety of model master planning processes that can be used at various levels of government.
4.2 Federal Requirements for PlanningAs discussed in detail in lesson 1, section 5, government commitment and support has been critical to improving conditions for bicycling and walking throughout the United States. Efforts to plan for bicycle and pedestrian mobility were given a tremendous boost by the Intermodal Surface Transportation Efficiency Act of 1991 (ISTEA) and subsequent transportation legislation that has had a continuing emphasis on multimodal transportation. As a result of Federal legislation, States and metropolitan planning organizations (MPOs) are required to address bicycle and pedestrian needs during the transportation planning process. States and MPOs are required to incorporate appropriate provisions for bicycling and walking into the State transportation improvement program (STIP) and transportation improvement programs (TIPs). In addition, each State is required to establish a bicycle and pedestrian coordinator position in its State department of transportation (DOT). The American Association of State Highway and Transportation Officials (AASHTO) maintains an online list of current State bicycle and pedestrian coordinators on the AASHTO website at http://design.transportation.org/?siteid=59&pageid=852. The Federal Highway Administration (FHWA) and Federal Transit Administration (FTA) have issued technical guidance for bicycle and pedestrian planning at the State and MPO levels in order to meet Federal requirements. In brief, this guidance makes the following key points relevant to State and metropolitan area transportation planning for bicycles and pedestrians:
4.3 Statewide and Regional Pedestrian and Bicycle PlansStatewide Bicycle and/or Pedestrian PlansAt the State level, bicycle and pedestrian plans establish policies, goals, and actions for State agencies (i.e., within a State DOT and transit agencies) to accommodate and improve conditions for biking and walking. These plans often include design standards/guidance for local and regional governments, and they typically address education and safety issues as well. The primary objective of a statewide bicycle and pedestrian access plan is to guide future transportation projects in the State, and to establish programs that support and encourage bicycling and walking. The following types of activities may be included in a statewide bicycle and pedestrian planning process:
Bicycle and pedestrian assessments and recommendations are often grouped together for planning projects but the needs of both groups are often quite different. For this reason, bicycle and pedestrian plans at the statewide level should include separate and distinct recommendations for each mode. Regional Bicycle and/or Pedestrian PlansAt the regional level, bicycle and pedestrian planning is usually carried out by MPOs, county governments, or similar regional agencies. The main objectives of these planning projects are usually to coordinate between jurisdictions, develop planning and design guidance for local governments, establish regional priorities for funding, and build a unified regional approach to land use and transportation issues. Issues that typically arise during the regional planning process include:
4.4 Local Bicycle and Pedestrian PlansCities and towns with good bicycle and pedestrian plans can have a very positive impact on bicycling and walking conditions. Decisions at the local level often have a more direct and immediate impact on bicycling and walking because these two modes are affected to a great extent by localized opportunities and constraints. In order to compete successfully for Federal funding, the local entity must demonstrate a commitment to providing matching funds, and it should come equipped with the specifics of projects, cost–estimates, and other information. The city that does its homework has the best chance of securing the funds. It is important to recognize that there is no single, perfect formula for completing a local pedestrian and/or bicycle master plan. Successful planning processes are tailored to the needs and opportunities of a particular local area. A successful planning process for one city or town might be a failure somewhere else. Bicycle and pedestrian plans are inherently political and must respond to the opportunities and constraints of the government that develops them. Each planning process must begin with a strategic assessment of the critical path to success, and it should focus in on those activities, projects, and recommendations that are most likely to yield results. For example, if the jurisdiction is preparing to embark on a comprehensive revision of local zoning and subdivision regulations, a strategic approach would be to focus the work of the bicycle and pedestrian plan on developing very specific recommended policies that can be incorporated into the revisions. Despite the differences among bicycle and pedestrian plans, there are some features that many local bicycle and pedestrian plans have in common:
Setting PrioritiesOne approach in setting priorities for pedestrian and bicycle improvements is to identify what would encourage people to walk more often and then orient efforts toward improving conditions for pedestrians in this direction. During the development of the bicycle and pedestrian plan for Louisiana, citizens were asked what could be done to make it easier to get around by foot. The responses were ranked as follows:
Of course, some projects are expensive. For instance, if there is a need for a grade–separated pedestrian crossing of a freeway, such a project can easily cost upwards of $300,000 to $500,000. Planning for such an expenditure can take several years and may involve grant applications or implementation through the TIP process and the use of any one of several categories of Federal funds. Meanwhile, many small but important changes can be made to improve conditions for bicycling and walking. Many local programs have found that small initial successes build momentum, allowing more ambitious work to follow. In one western community, for instance, installation of several test traffic circles on residential streets—a project that took several days of work and less than $5,000 to accomplish—helped build support for an ongoing program installing such circles all over town. Developing a Bicycle Network PlanThe following discussion details a planning process for a bicycle network plan. Chapter 1 of the AASHTO Guide for the Development of Bicycle Facilities contains several suggestions for establishing a bicycle planning program. The following process is but one example. It consists of six steps:(1)
Establish Performance Criteria for the Bicycle Network. Performance criteria define the important qualitative and quantitative variables to be considered in determining the desirability and effectiveness of a bicycle facility network. These can include:
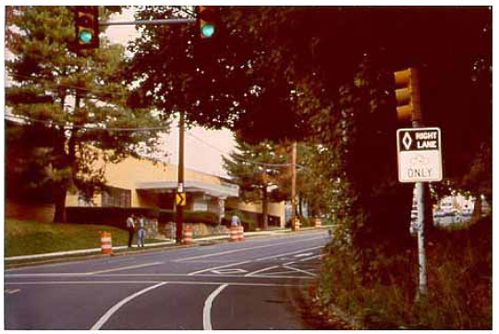
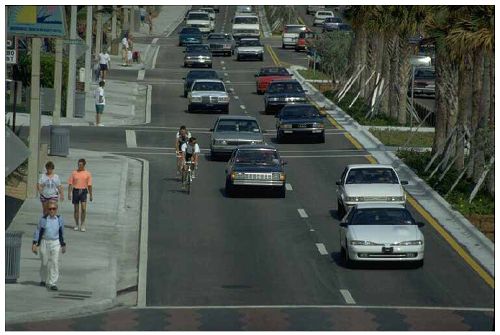
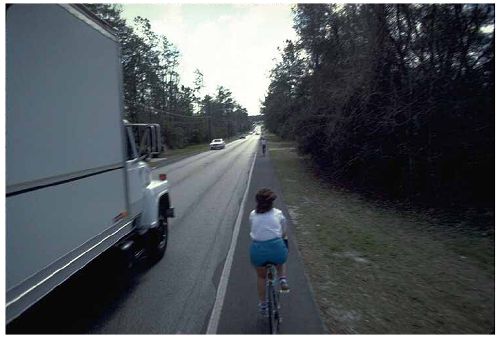
Figure 4–1. Photo. Group B (basic) bicyclists value designated bike facilities such as bike lanes. Inventory Existing System. Both the existing roadway system and any existing bicycle facilities should be inventoried and evaluated. The condition, location, and level of use of existing bicycle facilities should be recorded to determine if they warrant incorporation into the proposed new network or if they should be removed. If existing bicycle facilities are to be used as the nucleus of a new or expanded network, the inventory should note which improvements to the existing portions of the network may be required to bring the entire new network up to uniform design and operations standards. A simple inventory of the roadway system could be based on a map of the annual average daily traffic (AADT) counts on each road segment within a community or region. A more complex inventory could include factors such as the number of traffic lanes, the width of the outside lane, the posted speed limit or actual average operating speed, the pavement condition, and certain geometric and other factors (e.g., the frequency of commercial driveways, grades, and railroad crossings). Identify Bicycle Travel Corridors. Predicting bicycle travel corridors for a community is not the same as identifying the routes that bicyclists currently use. Instead, travel corridors can be thought of as desire lines connecting neighborhoods that generate bicycling trips with other zones that attract a significant number of bicycling trips. For motor vehicle traffic, most peak morning trips are made from residential neighborhoods to employment centers. In the evening peak hours, the reverse is true. Furthermore, in the evenings or on weekends, the patterns of trip generation are much more dispersed, as people travel to shopping centers, parks, and the homes of friends or relatives. Estimating these trip flows for an entire city can be a complex, time–consuming effort requiring significant amounts of raw data and sophisticated computer models. Fortunately, transportation planning for bicycles is much simpler. Unlike traditional transportation planning that attempts to predict travel demands between future zones on as–yet unbuilt streets and highways, bicycle planning attempts to provide for bicycle use based on existing land uses, assuming that the present impediments to bicycle use are removed. These desire lines are, in fact, well represented by the traffic flow on the existing system of streets and highways. In all of this, the underlying assumption is that people on bikes want to go to the same places as do people in cars (within the constraints imposed by distance), and the existing system of streets and highways reflects the existing travel demands of the community. Furthermore, most adults have a mental map of their community based on their experience as motor vehicle operators. Thus, they tend to orient themselves by the location of major streets and highways. Again, it is important to note that the resulting map may not be a representation of where bicyclists are now, but is instead a reflection of where bicyclists wish to go. The actual travel patterns of group B/C bicyclists are heavily influenced by their perception of the bicycling environment they face. Uncomfortable or threatening bicycling conditions will cause these bicyclists to alter route choice from their most preferred alignment, choose a different travel mode, or not make the trip at all. Thus, the task of the transportation planner for bicycling is to ask, “Where are the bicyclists now?” and “Where would they be if they could go where they preferred?” Although this use of existing traffic flows is a useful overall predictor of bicyclists’ desire lines, a few special situations may require adjustments to the corridor map:
Evaluate and Select Specific Route Alternatives. The corridor identification procedure identifies desire lines for bicycle travel between various locations. The next step is to select specific routes within these corridors that can be designed or adapted to accommodate group B/C bicyclists and provide access to and from these locations. The aim is to identify the routes that best meet the performance criteria established in the first step of this planning process. Typically, this step and the selection of appropriate design treatments are highly interactive processes. The practicality of adapting a particular route to accommodate group B/C bicyclists may vary widely depending upon the type of design treatment selected. For example, a less direct route may become the best option if comparatively few inexpensive and easily implemented design improvements are required.Therefore, steps 4 and 5 should be approached as an iterative loop in which both route selection and design treatment are considered together to achieve a network that is highly advantageous to the user, is affordable, has few negative impacts on neighbors and other nonusers, and can be readily implemented. Therefore, steps 4 and 5 should be approached as an iterative loop in which both route selection and design treatment are considered together to achieve a network that is highly advantageous to the user, is affordable, has few negative impacts on neighbors and other nonusers, and can be readily implemented. In summary, the selection of a specific route alternative is a function of several factors, including:
A more inclusive list of factors to be considered in the selection of a specific route is presented in the AASHTO Guide.(1)
Select Appropriate Design Treatments. Guidelines for selecting an appropriate design treatment are presented in lesson 13 of this course. In overview, the principal variables affecting the applicability of a design treatment are:
Evaluate the Finished Plan Against the Established Performance Criteria. Will the proposed network meet the criteria established at the start of the planning process? If it does not meet most of these criteria, or it inadequately meets a few critical goals, either the proposal will require further work, or the performance criteria must be modified. In the latter case, the planning process as a whole should be reviewed to determine if previously discarded routes should be reconsidered. There may now be more preferred options in light of the newly modified criteria. This reality check is important. Many well–considered proposals fail when it is determined that the finished product no longer meets its established objectives.(2)
4.5 Forecasting Bicycle and Pedestrian Travel DemandThe bicycling and walking modes have experienced decades of neglect in mainstream travel demand forecasting. As cities and towns begin the work of redeveloping their transportation systems to support bicycling and walking, the list of needed improvements far outstrips available dollars. Planners have begun to look for ways to set priorities—one of which is predicting demand. The question that planners have begun to ask is this: If we build this bikeway (or walkway, etc.), how many people can we expect to use it? Finding the answer is the fundamental aspect of predicting demand. Transportation planners have been asking (and answering) this question for motor vehicular travel since the late 1960s, when the first travel demand models were developed. By contrast, bicycle and pedestrian researchers are only just beginning to scratch the surface on these topics. For bicycles and pedestrians to have a seat around the transportation table, it is important to acknowledge that some level of analysis must be done for these modes. Transportation planners have a responsibility to ensure that public funds are being spent wisely—in locations where a larger number of people will benefit from new facilities. Finally, there is a growing trend to quantify the air quality benefits (and congestion relief) that can be expected as a result of congestion mitigation and air quality (CMAQ) projects. For bike and pedestrian facilities, this means coming up with some way to determine how many auto trips will be shifted to biking and walking trips. While the science of predicting bicycle and pedestrian travel demand has not yet been developed to the same level as motor vehicle planning, there are a number of methods that planners have developed over the years to help quantify which locations have higher levels of demand. When planning bicycle and/or pedestrian facilities, it is important to remember that current volumes usually do not reflect demand for two reasons:
There are two methods of determining demand for pedestrian and bicycle facilities: the intuitive approach versus the use of demand forecasting models. The intuitive approach is less time consuming; however, it does not yield precise results. This type of planning analysis is also called a sketch plan. A sketch plan typically focuses on proximity between origins and destinations, since distance is a primary factor in the initial decision to take a walking or bicycling trip. According to the 1995 Nationwide Personal Transportation Survey (NPTS), the majority of pedestrian trips are 0.4 km (0.25 mi) or less, with 1.6 km (1 mi) generally being the limit that most people are willing to travel on foot. In other words, most people are willing to take a five to ten minute walk at a comfortable pace to reach a destination. The majority of bicycle trips are 4.8 km (3 mi) or less—or about a 15–minute bike ride.(3) National Household Travel Survey (NHTS) data also show that land use patterns and population density have a big impact on trip distance. Higher–density communities with mixed land use patterns will have higher levels of walking because destinations are more likely to be located within walking distance of homes and businesses.(4) For an intuitive (i.e., sketch plan) approach, destinations throughout the study area that would attract bicyclists and pedestrians are shown on a base map. Routes are selected that serve higher concentrations of destination points or that serve destinations that typically yield high numbers of bicyclists and pedestrians, such as universities, downtown areas, shopping centers, major employment centers (hospitals, business parks, major industries, and corporations, etc.), schools, and parks. Route selection and prioritization can be done via graphical representation; the intent is to identify locations that serve multiple destinations and higher population densities (population densities can be obtained from census data). This methodology can be accomplished using GIS, or it can be done by hand. Public involvement is important to the success of the intuitive method. It is particularly important to gain input from a wide variety of local citizens (representing different geographic areas) who represent all ages and abilities. The other method of estimating latent bicycle and pedestrian travel demand is to adjust conventional motor vehicle travel demand theory so that it applies to bicycle and pedestrian travel. By using a gravity model to measure latent bicycle and pedestrian travel demand, the planner can achieve results that are more precise than the intuitive approach. Another advantage to this approach is that it complements the type of analysis that is typically done for motor vehicle and transit travel simulation. This can be particularly important in cases where bicycle improvements are competing for similar funding mechanisms as other modes, since most TIPs make funding decisions based upon quantifiable results. Bicycle and pedestrian travel demand modeling can be done on a system–wide basis, or at the corridor level. Further information on more precise bicycle and pedestrian travel demand methods is provided in the FHWA Guidebook on Methods to Estimate Non–Motorized [sic] Travel.(5)
4.6 Using Models to Evaluate Roadway Conditions for Bicycling and WalkingLevel of service (LOS) is a framework that transportation professionals use to describe existing conditions (or suitability) for a mode of travel in a transportation system. The traffic planning and engineering discipline has used LOS models for motor vehicles for several decades. Motor vehicle LOS is based on average speed and travel time for motorists traveling in a particular roadway corridor. In the 1990s, new thinking and research contributed to the development of methodologies for assessing levels of service for other travel modes, including bicycling, walking, and transit (see figure 4–3).
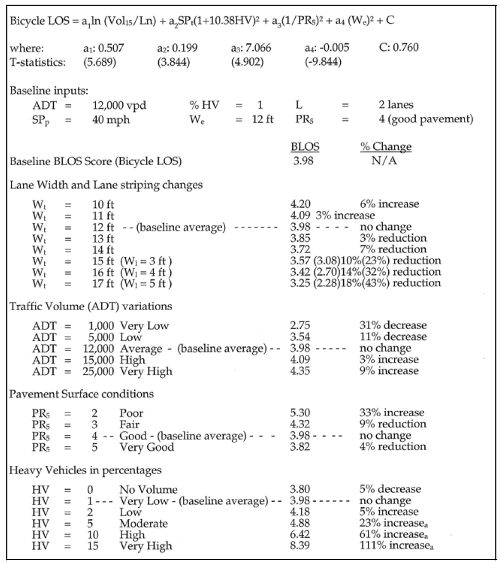
Specific methodologies for bicycle LOS have been developed and used by a number of cities, counties, and States since the mid–1990s. There are two models that have been established and are widely used for evaluating bicycling conditions in the United States: one that was developed by FHWA and the other developed and tested by the Florida DOT. When considering LOS in a multimodal context, it is important to note that LOS measures for motor vehicles and bicycles are based on different criteria and are calculated using different inputs. Motor vehicle LOS is primarily a measure of speed, travel time, and intersection delay. Bicycle LOS is a more complex calculation that represents the level of comfort a bicyclist experiences in relation to motor vehicle traffic. Bicycle LOSBicycle LOS is an evaluation of bicyclists’ perceived safety and comfort with respect to motor vehicle traffic while traveling in a roadway corridor. It identifies the quality of service for bicyclists or pedestrians that currently exists within the roadway environment. In order to evaluate bicycle LOS, a statistically–calibrated mathematical equation is used to estimate bicycling conditions in a shared roadway environment. It uses the same measurable traffic and roadway factors that transportation planners and engineers use for other travel modes. With statistical precision, this modeling procedure clearly reflects the effect on bicycling suitability or compatibility of factors such as roadway width, bike lane widths and striping combinations, traffic volume, pavement surface condition, motor vehicle speed and type, and on–street parking. The form of the bicycle LOS model is provided as shown below in figure 4–4. Figure 4–4. Equation. Bicycle LOS.
The bicycle LOS score resulting from the equation is prestratified into service categories A, B, C, D, E, and F (A being the best and F, the worst), according to the ranges shown in table 4–1 that reflect users’ perceptions of the road segments’ LOS for bicycle travel. This stratification is conducted in accordance with the linear scale established during the research project that identified bicycle participants’ aggregate responses to roadway and traffic stimuli. Table 4–1. Bicycle level LOS categories.
The model is particularly responsive to the factors that are statistically significant. An example of its sensitivity to various roadway and traffic conditions is shown in figure 4–5. Because the model represents the comfort level of a hypothetical typical bicyclist, some bicyclists may feel more comfortable and others may feel less comfortable than the bicycle LOS calculated for a roadway. A poor bicycle LOS grade does not mean that bicycles should be prohibited from using a roadway. ApplicationThe bicycle LOS model is used by planners, engineers, and designers throughout the United States and Canada in a variety of planning and design applications. Applications include:
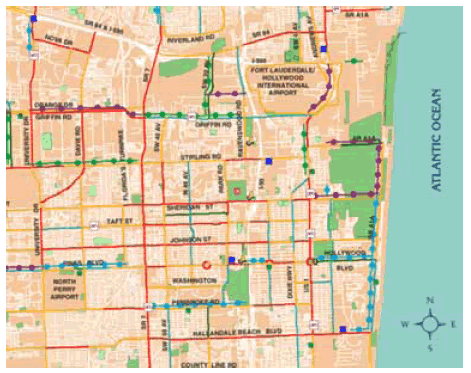
4.7 MappingThere are four basic types of bicycle maps:
The first three are used mainly by bicycle riders; the fourth, by a wide variety of interested parties. Urban Bicycle MapUsed primarily by local utilitarian bicyclists, newcomers, and visitors, this type of map is intended to help cyclists choose routes they feel comfortable riding and to encourage first–time riders to make trips by bicycle (see figure 4–6). All streets should be shown. A simple color code indicates the presence and types of bicycle facilities. It also warns bicyclists of roads they should use with caution. The accompanying text should provide information on traffic laws, safety tips, and the proper use of bikeways.
Other useful information includes enlargements of difficult intersections, steep hills, weather data, parking facilities, bike shops, important destinations, and landmarks, etc. However, too much detail creates a cluttered effect; simplicity makes it easier to find needed information. Bicycle GuideThe intended audience is recreational and touring riders interested in medium– to long–distance trips. The major concerns when choosing a route are traffic volume and roadway conditions. Color coding indicates bicycle level of service; a solid line indicates the presence of shoulders wide enough for bicycle travel. The map should include State highways and county roads. The level of detail is less than that on an urban map. Other information to be included are distances, grades, weather data (especially prevailing wind directions), and camping facilities. Text should be used for information on local history, landmarks, viewpoints, etc. Description of loop tours is useful to riders planning day trips. Local bicyclists should ride the loops in order to assess conditions. A written description of the route that lists landmarks and turns is helpful. Since bicycle trips often cross jurisdictional boundaries, counties are encouraged to coordinate when creating regional maps that cover natural geographical areas within easy reach of multiple population centers. Other Useful TipsGood maps are clear and simple—too many symbols and details create confusion. Only needed information should be included:
It is usually better to create a new map. If available graphics capabilities don’t allow this, existing maps can be used by adding and deleting information. Other important considerations include the following:
4.8 Student ExerciseFind bicycle and/or pedestrian planning guidelines for your city, county, or State. Also find plans from another region with comparable characteristics. What are the major elements of your local plan? From the plans, what can you determine is important to the area? Compare the two sets of plans and evaluate your plan’s strengths and weaknesses.
4.9 References and Additional ResourcesThe references for this lesson are:
Additional resources for this lesson include:
FHWA-HRT-05-091 |
||||||||||||||||||||||||||||||||||||||||||||||||||||||||||||||||||||||||||||||||||||||||||||||||||||||||||||||||||||||||||||||||||||||||||||||||||||||||||||||||||||||||||||||||||||||||||||||||||||||||||||||||||||||||||||||||||||||||||||||||||||||||||||||||||||||||||