U.S. Department of Transportation
Federal Highway Administration
1200 New Jersey Avenue, SE
Washington, DC 20590
202-366-4000
Federal Highway Administration Research and Technology
Coordinating, Developing, and Delivering Highway Transportation Innovations
 |
| This report is an archived publication and may contain dated technical, contact, and link information |
|
Publication Number: FHWA-HRT-06-125
Date: November 2006 |
Pedestrian and Bicyclist Intersection Safety IndicesFinal ReportPDF Version (2.25 MB) PDF files can be viewed with the Acrobat® Reader®
CHAPTER 5. DATA COLLECTIONThe collection of intersection data and the videotaping of sites were performed with the help of local data collectors in each city. The data collection effort was completed by reducing the video footage and gathering crash data on the sites. The following sections detail the process and results of the collection of physical characteristics, crash data, behavioral data, and subjective safety ratings.
PHYSICAL CHARACTERISTICSData were collected on the intersection geometry, traffic control, and facilities for pedestrians and bicyclists. These data were used in the regression analysis as objective, independent factors that would predict the safety index of an intersection. In addition to the variables listed below, a sketch of the intersection was made for each pedestrian and bicycle site to illustrate the intersection configuration. See Appendix A for the complete data collection forms and instructions. The following variables were identified by team members as having a potentially significant impact on pedestrian and bicyclist safety: Pedestrian Study Site Variables
Bicycle Study Site Variables
CRASHESThe most commonly used measure of safety for a site is crash history. When dealing with intersections, crash data are normally gathered for the intersection as a whole. This research, however, required more specific crash data, since the base unit is a single crosswalk (for pedestrians) or a single approach (for bicyclists). Therefore, data were compiled for crashes occurring on or near the particular crosswalk or approach, rather than a total number for the intersection. Totaling crashes in this manner yielded data that corresponded to the particular crosswalk or approach. State and city departments of transportation provided listings of crashes involving pedestrians or bicycles for each study site in their jurisdiction. In most cases, the accompanying crash information database did not have sufficient location information to pinpoint the position of the crash at the intersection. It was therefore necessary to obtain copies of the police-recorded crash reports and examine the sketch and narrative. Table 1 summarizes the crosswalk-specific and approach-specific crash data for pedestrian and bicycle sites. The crashes are noticeably few in number. Pedestrian and bicyclist crashes are rare events in general at a given location—made even rarer in this study since only a portion of the crashes at an intersection were considered. Table 1 . Summary of Crash Data
BEHAVIORAL DATA: CONFLICTS AND AVOIDANCE MANEUVERSThe behaviors of motorists, bicyclists, and pedestrians during interactions were studied in order to gather additional information on intersection safety. The behavioral safety measures used in this research were conflicts, a sudden action taken to avoid a collision, and avoidance maneuvers, any movement made because of an interaction between parties. These two behavior types were clearly distinguished for the bicycle study and therefore were analyzed separately; they were not as clearly distinguished for the pedestrian study and therefore were analyzed together as a combined group. This is discussed in detail below. Data were collected by videotaping each site. Pedestrian and bicycle study sites were recorded for approximately 1 hour (h) 45 min each. Data collection was conducted on weekdays during daylight hours (i.e., 8:00 a.m. to 6:00 p.m.). Scheduling was done to avoid data collection during rain or extreme temperatures. An observer later watched the video and coded conflicts and avoidance maneuvers as they occurred. The study observed a total of 4,128 pedestrian events over 90 h and 3,831 bicyclist events over 129 h. To collect data at pedestrian sites, the video camera was positioned on top of a stepladder in a location where the entire crosswalk could be viewed (Figure 2). Video footage was also taken parallel to the crosswalk to be used for the rating survey later.
Figure 2. Video camera position for pedestrian data collection.
For bicycle sites, the video camera was positioned on a stepladder next to the roadway. The video camera was located across the intersection from the leg of interest (Figure 3). This position provided a view of the entire length of the leg of interest and allowed the bicyclists to be filmed as they came toward the camera. To provide video footage for those who would rate the safety of the intersection, additional footage was taken opposite the initial position to film in the direction of the bicyclists’ travel. This position provided a more realistic viewpoint for the evaluators.
Figure 3. Video camera positions for bicyclist data collection.
Definitions of Conflicts and Avoidance ManeuversA conflict is a sudden change of direction or speed performed by either party in order to avoid a collision. This could include braking or swerving on the part of motorists and bicyclists. It is assumed that if one or both of the parties had not taken action, a collision would have occurred. An avoidance maneuver is any change in speed or direction by a motorist, pedestrian, or bicyclist in response to the presence of another party. An avoidance maneuver is not necessarily a sudden movement and it is not necessarily assumed that a collision would have occurred had no action been taken. Examples of these are a pedestrian changing course to walk around a vehicle or a vehicle yielding to a crossing pedestrian. While these definitions are clearly defined on paper, the classification of these interactions in the field is unclear at times, especially for interactions between pedestrians and motorists. The “traditional” definition of a traffic conflict involves a vehicle braking or weaving to avoid a collision. In past research, conflicts have sometimes been rated as mild, moderate, or severe, depending on the perceived nearness to a collision. Avoidance maneuvers are generally used to count “interactions” or observed behaviors that may be representative of safety or operational problems for the purposes of assessing locations and/or for evaluating roadway treatments. Although conflict and avoidance measures have been used in traffic safety research and literature, no studies are known that have developed a clear relationship between pedestrian and bicycle crashes versus conflicts or avoidance maneuvers. While certain types of conflicts and avoidance maneuvers certainly indicate risky behavior or represent events that are similar to certain collision events, it can sometimes be difficult to clearly distinguish conflicts from avoidance maneuvers in terms of which events correspond to a greater risk of a pedestrians or bicyclist collision. Since bicycles operate in a similar manner as vehicles (i.e., smooth rolling motion and faster speeds), it was reasonably clear to the observer when an interaction was a conflict or an avoidance maneuver. Thus, in the analysis and bicycle model development, these behaviors were analyzed separately. However, pedestrian interactions with motorists were more difficult to classify. For example, if a vehicle braked suddenly to avoid a collision with a pedestrian, the interaction would likely be classified as a conflict, since brake lights can be observed and the vehicle’s change in speed is dramatic. On the other hand, if a pedestrian stops abruptly to avoid a vehicle, it is often more difficult to tell if the interaction could have led to a collision. Furthermore, it is not always clear whether a pedestrian is fully aware of an oncoming vehicle or narrowly avoided being struck. Given this fuzzy line between pedestrian conflicts and avoidance maneuvers, the two interaction types were grouped together as a single measure of safety in the analysis and pedestrian model development.
Pedestrian and Motorist Conflicts and Avoidance ManeuversPedestrian events were watched for interactions between the crossing pedestrian and right-turning, left-turning, or through vehicles. Interactions with cross-street traffic were included in the observation. Right-turning vehicles included those turning right on red. The pedestrian study observed 911 motorist behaviors and 184 pedestrian behaviors. As discussed above, a behavior could be a conflict or an avoidance maneuver, since they were analyzed as a single group. The average rate, calculated on a per site basis, was 16.1 interactions per hour of observation. Table 2 and Table 3 display the types of interactions coded in the pedestrian study and the number of times each type was observed.
Table 2 .Pedestrian conflicts and avoidance maneuvers.
Table 3 . Motorist conflicts and avoidancemaneuvers at pedestrian events
Bicycle Conflicts and Avoidance ManeuversAvoidance Maneuvers. The bicyclist study observed 1,898 avoidance maneuvers. Since it was possible that a bicyclist could be involved in more than one avoidance maneuver during their transit through the intersection, up to four avoidance maneuvers were coded for each bicyclist event. The average rate, calculated on a per site basis, was 18.6 avoidance maneuvers per hour of observation. For each avoidance maneuver, the observer noted the response of the bicyclist and the motorist separately. Table 4 and Table 5 display the types of avoidance maneuvers coded in the bicyclist study and the number of times each type was observed. These types of avoidance maneuvers were originally used in the study of bike lanes versus wide curb lanes (Hunter, et al., 1999).
Table 4 . Bicyclist avoidance maneuvers.
Table 5 . Motorist avoidance maneuvers at bicyclist events.
Conflicts. Bicyclist events were watched for conflicts between the bicyclist and vehicles, pedestrians, or other bicyclists. During the 129 h of observation and 3,831 bicyclist events, 17 conflicts involving bicyclists were noted. Fifteen conflicts were bicyclist-vehicle conflicts, and two were bicyclist-pedestrian conflicts. See Appendix B for further information on these conflicts.
SAFETY RATINGSIn addition to objective measures of safety, this study sought to obtain evaluative measures of safety in the form of ratings. People who were knowledgeable in pedestrian or bicycle matters viewed the sites and gave ratings according to their perceived level of safety for a pedestrian or bicyclist. Similar to conflicts and avoidance maneuvers, these data can be collected relatively quickly and in large quantities. The following sections detail the process of creating the survey of sites and obtaining safety ratings from evaluators. Survey DesignA survey was designed that would give evaluators enough information about the sites for them to provide safety ratings. The survey was designed as a Web site, where site data could be viewed and ratings could be submitted online. Given the need to distribute the survey to a large number of people around the Nation, an online format was determined to be the best format for the survey. Two Web sites were created—one for the pedestrian safety survey and one for the bicyclist safety survey. The survey presented an illustration and a video clip for each site (Figure 5 and Figure 5, Figure 6 and Figure 7). The illustration showed basic intersection features such as sidewalks, crosswalks, bike lanes, traffic lane configuration, traffic control, and the direction of traffic flow. The video clip was designed to give the evaluator a pedestrian-eye view of the crosswalk or a bicyclist-eye view of the intersection approach. See Appendix C for more information on the survey Web site.
Figure 4. Illustration for pedestrian survey.
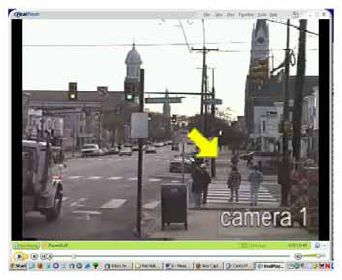
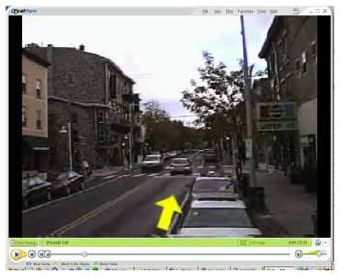
Figure 5. Video clip for pedestrian survey.
Figure 6. Illustration for bicyclist survey.
Figure 7. Video clip for bicyclist survey.
The video clips allowed evaluators to obtain a feel for traffic speeds and volumes, as well as other intersection features not displayed in the illustration. The ambient sound of the intersection was included in the video clip. The pedestrian survey consisted of 68 video clips that were 40 seconds (s) long. Each clip was composed of one or two camera angles, typically shot parallel to the crossing of interest (Figure 4 and Figure 5). A yellow arrow indicated the pedestrian crossing of interest. The bicyclist survey consisted of 67 video clips that were 30 s long. Each clip was composed of one camera angle, which was positioned on the leg of interest and pointed toward the intersection (Figure 6 and Figure 7). A yellow arrow was shown in the first 5 s of bicyclist video to indicate the direction that bicyclists would go. The number of vehicles shown in each clip was proportional to a 15-min vehicle count to ensure that a selected period did not show an abnormally high or low amount of traffic. Evaluators were asked to view the illustration and video as if they were a pedestrian on the crosswalk or a bicyclist on the approach. They rated the sites on a scale of 1 to 6, according to their sense of safety and comfort. If the conditions were such that they felt very comfortable as a pedestrian or bicyclist and highly likely to walk or ride at the site, they were instructed to give a rating of “1”. If the conditions were such that they felt very uncomfortable as a pedestrian or bicyclist and highly unlikely to walk or ride at the site, they were instructed to give a rating of “6”. They were also given the option of “Not Enough Information” if they believed that they had insufficient information from the illustration and/or video to make an informed rating. Evaluators in the pedestrian survey gave one rating per crosswalk. Evaluators in the bicyclist survey gave separate ratings for each movement that a bicyclist could make at the intersection—through, right, and left. The time needed to complete the surveys was approximately 2 h for the pedestrian survey and 2.5 h for the bicycle survey. Participants could take as much time as they wanted to rate each site, and the video clips could be replayed if needed. Several measures were taken to avoid survey bias. The research team did not want all evaluators to have the sites presented to them in the same order in case that would affect the ratings of the first few sites (because of unfamiliarity with the survey) or the last few sites (because of fatigue). Five different orders of sites were created to give each site an opportunity to be near the beginning, middle, and end of the survey order. The orders were assigned sequentially to evaluators so that there were equal numbers of evaluators for each order. The online format provided the option for evaluators to go back and redo previous ratings if they decided any particular rating had been incorrectly given (or needed an iterated revision). Because of the format of the survey, it is unknown how many evaluators revised earlier answers; however, this option was presented clearly in the instructions and was available on each rating page. The online design also allowed evaluators to logout and log back in later, thereby breaking up the survey into chunks instead of having to complete it all at once. See Appendix D for a summary of lessons learned by the research team in creating the online surveys. Pilot SurveyThe research team initially ran the pedestrian and bicyclist surveys as pilot tests using HSRC staff. Six sites were used for the pedestrian pilot survey and 15 sites were used for the bicyclist pilot survey. Feedback from these pilots indicated where additional information should be supplied to the evaluators and what technical issues (i.e., Web browser, streaming video player, etc.) might be faced by evaluators. Statistical analysis of the bicyclist pilot survey results revealed that left-turn ratings differed significantly from through and right ratings. This difference indicated that evaluators in the national survey should rate each movement separately. Survey AudienceSurvey participants were sought through announcements on various e-mail lists. The intended audience was composed of people who were experienced and knowledgeable about pedestrian or bicyclist matters. Table 6 and Table 7 show how the participating evaluators were related to pedestrian or bicyclist matters.
Table 6 .Pedestrian survey participants.
Table 7 . Bicyclist survey participants.
As is seen in the tables above, survey participants came from a variety of fields. The majority of the pedestrian survey participants were engineers, planners, or ped/bike coordinators. Although blind and visually impaired pedestrians could not take the survey because of the illustration and video-based format, six participants were orientation and mobility specialists, who were instructed to take the survey with the concerns of blind individuals in mind. A large portion of the participants in the bicyclist survey were those who described themselves as bicycling advocates. This generally meant that they cycled frequently and took part in organizations that advocated bicycling. The inclusion of these advocates was initially of concern because there might be some bias in advocate ratings. However, a statistical comparison of advocate ratings and non-advocate ratings showed that there was no significant difference between the mean ratings of both groups. The survey was designed so that evaluators could stop whenever they chose, even if they had not given ratings to all of the sites. If an evaluator completed ratings for at least 10 sites, it was assumed that the evaluator had proceeded through enough sites to acclimate to the survey process and provide good data. There were 76 evaluators for the pedestrian survey and 141 evaluators for the bicyclist survey. Ratings from evaluators who completed fewer than 10 sites were discarded. Ratings DataPedestrian sites received an average of 62 ratings each and bicycle sites received an average of 97 ratings each. The evaluators rated the sites on a scale of 1 through 6. Sites that were rated higher numerically were considered by the evaluator to be more uncomfortable and less safe than sites with low ratings. Table 8 shows the average rating and range of ratings for each group of sites. The average ratings for the sites varied between 2.0 and 2.8. The ranges of ratings spanned between three and four points on the scale, but the highest average rating was 5.1 for pedestrian sites and 4.4 for bicycle sites.
Table 8 . Summary of site average ratings.
The figures below show the distribution of ratings at each site group. The pedestrian sites in Figure 8 have the largest range of ratings and are the most spread out. This seems to indicate that there was a large range of opinions about the safety of crosswalks in contrast to the bicyclist site ratings, which are more tightly grouped. The bicycle through and right movements in Figure 9 and Figure 10 are grouped around the lower end of the ratings, whereas the left-turn ratings in Figure 11 are grouped in the middle of the scale and are slightly more diverse. Evaluators considered left turns generally less safe than a through or right movement and were slightly more varied in their opinions.
Figure 8. Ratings distribution at pedestrian sites.
Figure 9. Ratings distribution for through movements at bicycle sites.
Figure 10. Ratings distribution for right turns at bicycle sites.
Figure 11. Ratings distribution for left turns at bicycle sites.
FHWA-HRT-06-125 |
|||||||||||||||||||||||||||||||||||||||||||||||||||||||||||||||||||||||||||||||||||||||||||||||||||||||||||||||||||||||||||||||||||||||||||||||||||