U.S. Department of Transportation
Federal Highway Administration
1200 New Jersey Avenue, SE
Washington, DC 20590
202-366-4000
Federal Highway Administration Research and Technology
Coordinating, Developing, and Delivering Highway Transportation Innovations
 |
| This report is an archived publication and may contain dated technical, contact, and link information |
|
Publication Number: FHWA-HRT-06-130
Date: April 2007 |
Pedestrian and Bicyclist Intersection Safety IndicesUser GuidePDF Version (3 MB) PDF files can be viewed with the Acrobat® Reader®
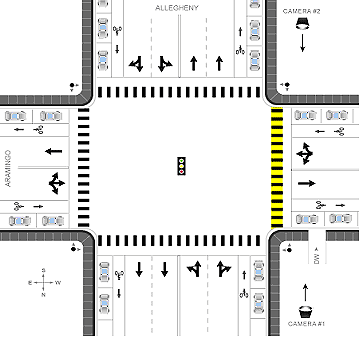
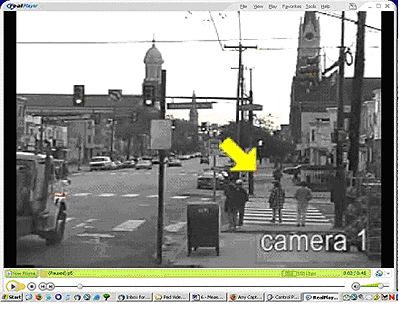
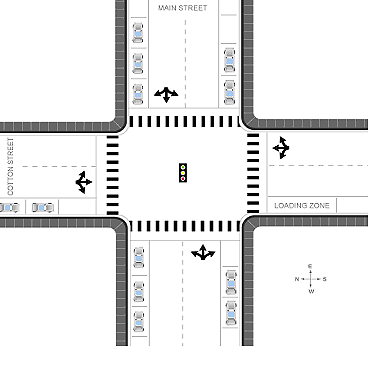
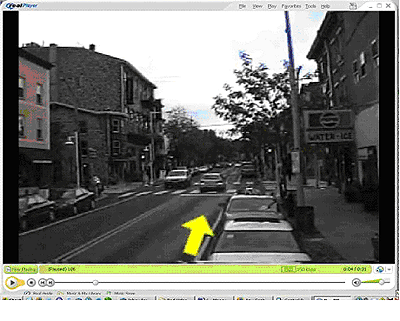
CHAPTER 2. DEVELOPMENTThe Federal Highway Administration (FHWA) developed Ped ISI and Bike ISI on the basis of two measures—safety ratings (expert opinion of the safety of sites) and observed behaviors (observed interactions between pedestrians and motorists or bicyclists and motorists). These different measures provided a multifaceted approach to determining the relative safety of a pedestrian crossing or bicycle approach leg. The research studied 68 pedestrian crossings at signalized and unsignalized intersections in Miami, FL, Philadelphia, PA, and San Jose, CA and 67 bicycle approaches at signalized and unsignalized intersections in Eugene, OR, Gainesville, FL, Philadelphia, PA, and Portland, OR. The results of the study were used to develop Ped ISI and Bike ISI. Safety Measure: RatingsExperts in pedestrian and bicyclist issues viewed videos of the pedestrian crossings and bicycle approaches and rated the sites according to their perceived level of safety for a pedestrian or bicyclist. The researchers created a survey instrument designed to provide evaluators enough information about the sites to develop safety ratings. The survey presented an illustration and a video clip for each site. Evaluators were asked to view each illustration and video as if they were pedestrians crossing at the crosswalk (Figure 1 and Figure 2) or bicyclists approaching the intersection (Figure 3 and Figure 4).
Figure 1. Sample illustration for pedestrian survey.
Figure 2. Sample video clip for pedestrian survey.
Figure 3. Sample illustration for bicycle survey.
Figure 4. Sample video clip for pedestrian survey. The evaluators rated the sites on a scale of 1 to 6, according to their sense of safety and comfort. If the conditions were such that they felt very comfortable as pedestrians or bicyclists and highly likely to walk or ride at the site, they were instructed to give a rating of "1." If the conditions were such that they felt very uncomfortable as pedestrians or bicyclists and highly unlikely to walk or ride at the site, they were instructed to give a rating of "6." They also had the option of "not enough information" if they believed that they had insufficient information from the illustration and/or video to make an informed rating. Each evaluator in the pedestrian safety survey gave one rating per crosswalk. Each evaluator in the bicyclist safety survey gave one rating for each movement that a bicyclist could make at the intersection (e.g., through, left, and/or right). Safety Measure: Observed Behaviors at InteractionsResearchers videotaped each site and watched later to record behaviors during interactions between pedestrians and motorists or bicyclists and motorists. Recorded behaviors included changes in speed or direction by a pedestrian, bicyclist, or motorist in response to the presence of another party. For example, researchers would record instances when a pedestrian stopped before or during a crossing because of an oncoming vehicle and when a right–turning motorist slowed or stopped to avoid a bicyclist. In total, researchers recorded 1,898 bicyclist–motorist interactions and 1,095 pedestrian–motorist interactions.
FHWA-HRT-06-130 |