U.S. Department of Transportation
Federal Highway Administration
1200 New Jersey Avenue, SE
Washington, DC 20590
202-366-4000
Federal Highway Administration Research and Technology
Coordinating, Developing, and Delivering Highway Transportation Innovations
 |
| This report is an archived publication and may contain dated technical, contact, and link information |
|
Publication Number: FHWA-HRT-06-130
Date: April 2007 |
Pedestrian and Bicyclist Intersection Safety IndicesUser Guide PDF Version (3 MB) PDF files can be viewed with the Acrobat® Reader®
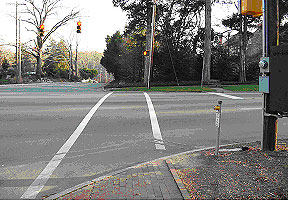
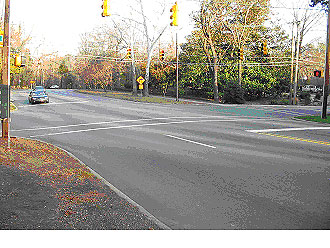
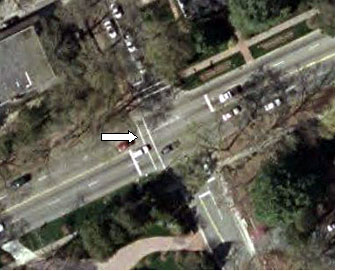
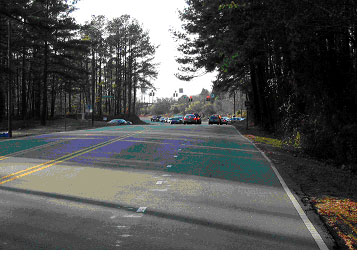
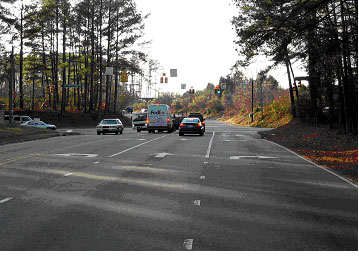
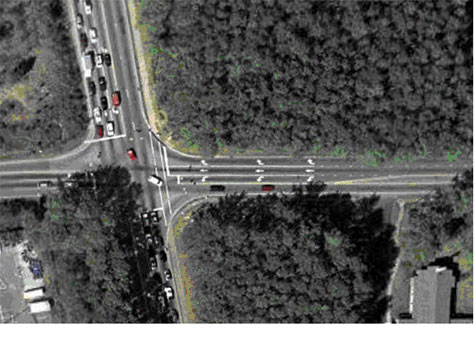
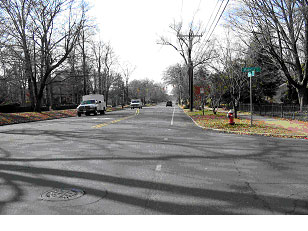
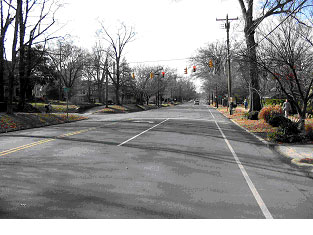
CHAPTER 4. EXAMPLES OF PED ISI AND BIKE ISI APPLICATIONSThe following section provides several examples which illustrate how to apply Ped ISI and Bike ISI at various sites. Each example has several site photos and a list of intersection characteristics. The example calculation of the safety index value is done with the spreadsheet calculators that accompany the User Guide. An example of using the quick reference tables is performed with the pedestrian example 1 and bicycle example 1. Pedestrian ExampleThe example for Ped ISI is a four-leg, signalized intersection in a mostly residential area. The crossing of interest is on the southwest leg. Figure 11, Figure 12, and Figure 13 show onstreet and overhead photos of the site, with the crossing of interest pointed out with a white arrow.
Figure 11. Crosswalk view of pedestrian example intersection.
Figure 12. Diagonal view of pedestrian example intersection.
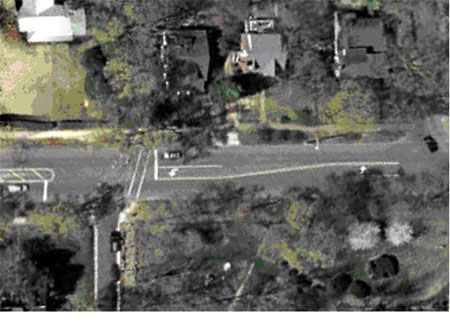
Figure 13. Overhead view of pedestrian example intersection (image courtesy of the United States Geological Survey). This crossing location has the following characteristics:
Once these characteristics are entered into the spreadsheet calculator, the resulting Ped ISI value is 2.7 (Figure 14).
Figure 14. Spreadsheet calculation of Ped ISI value. Using the Ped ISI model equation, the calculation is as follows: Ped ISI = 2.372−1.867SIGNAL−1.807STOP + 0.335THRULNS + 0.018SPEED + 0.006(MAINADT*SIGNAL) = 0.238COMM Ped ISI = 2.372−1.867*1−1.807*0 + 0.335*4 + 0.018*42 + 0.006(22*1) = 0.238*0 Ped ISI = 2.7 Notice that the ADT value must be entered in thousands (i.e., 22 instead of 22,000) for the equation. The spreadsheet calculator allows the user to enter the ADT as a whole value. Another way to determine the Ped ISI value is to go directly to the quick reference tables of Ped ISI values in Appendix B. These tables are provided for various combinations of traffic control and area type. For the example above, Table 9 in Appendix B corresponds to a signalized crossing in a noncommercial area (Figure 15). Going into that table with 4 through lanes, 85th percentile speed of 67.6 km/h (42 mi/h) (use the column of the nearest value, i.e., 64.4 km/h (40 mi/h)), and 22,000 ADT (use the row with 20,000 ADT), the Ped ISI value is 2.7.
1 mi/h = 1.6 km/h Figure 15. Quick reference table—pedestrian (signalized and noncommercial area).
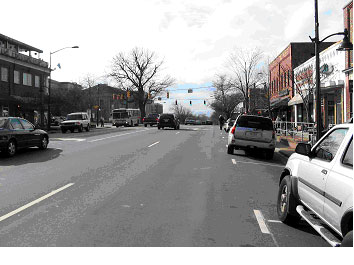
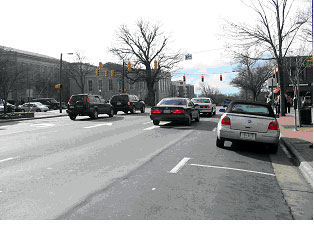
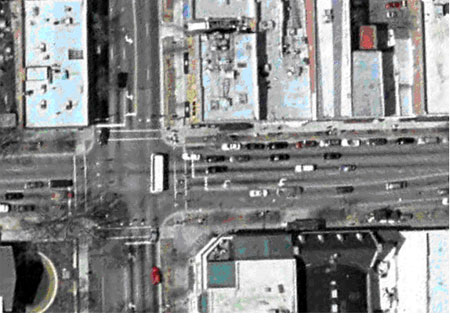
Bicycle Example 1Example 1 for Bike ISI is the westbound approach of a four-leg, signalized intersection. Figure 16, Figure 17, and Figure 18 show onstreet and overhead photos of the approach of interest (indicated by arrow).
Figure 16. Street view of bicycle example 1.
Figure 17. Street view of bicycle example 1.
Figure 18. Overhead photo of bicycle example 1 (image courtesy of the United States Geological Survey).
This approach has the following characteristics:
Once these characteristics are entered into the spreadsheet calculator, the resulting Bike ISI values are 4.0 for through movement, 2.1 for right turns, and 3.2 for left turns (Figure 19).
1 mi/h = 1.6 km/h Figure 19. Spreadsheet calculation of safety index values for bicycle example 1. Using the Bike ISI model equations, the calculations are as shown in Table 3: Table 3. Bike ISI model equations.
Using the quick reference tables for bicycle example 1, the following results are found: "Through" safety index value Since there are four "through" bicycle tables (Tables 14, 15, 16, and 17 in Appendix B), it is necessary to start with Table 15 for "Signalized Intersection" and "No Bike Lane" (shown here in Figure 20 , full-size table available in Appendix B). Across the top of the table, the user would select the column for "35 mph or more," "No parking," "1 Right-Turn Lane," and "Yes" for potential turning vehicles. Down the side of the table, it is necessary to interpolate the Main and Cross ADT values. The table shows that the through safety index value will lie between 3.7/3.9 and 3.9/4.1 (the exact calculation performed in Figure 19 above shows that the actual value is 4.0).
1 mi/h = 1.6 km/h Figure 20. Quick reference table—bicycle through (signalized with no bike lane). "Right turn" safety index value There is only one table for right turn safety index values, Table 18, (shown here in Figure 21, full-size table available in Appendix B). Across the top of the table, the user would select the column for "4 Cross Street Through Lanes," "No" onstreet parking, and "0" RT Cross Lanes (lanes to cross to make a right turn). Down the side of the table, it is necessary to interpolate the Main ADT values. The table shows that the through safety index value will lie between 1.9 and 2.2 (the exact calculation performed in Figure 19 above shows that the actual value is 2.1).
Figure 21. Quick reference table—bicycle right turn. "Left turn" safety index value Since there are four "left turn" bicycle tables (Tables 19, 20, 21, and 22 in Appendix B), it is necessary to start with Table 20 for "Signalized Intersection" and "No Bike Lane" (shown here in Figure 22, full-size table available in Appendix B). Across the top of the table, the user would select the column for "35 mph or more," "3" LT Cross lanes (lanes to cross to make a left turn), and "No" onstreet parking. Down the side of the table, it is necessary to interpolate the Main ADT values. The table shows that the through safety index value will lie between 3.0 and 3.2 (the exact calculation performed in Figure 19 above shows that the actual value is 3.2).
1 mi/h = 1.6 km/h Figure 22. Quick reference table—bicycle left turn (signalized with no bike lane).
Bicycle Example 2Example 2 for Bike ISI is the westbound approach of a three-leg, signalized intersection. Figure 23, Figure 24, and Figure 25 show onstreet and overhead photos of the approach of interest (indicated by arrow).
Figure 23. Street view of bicycle example 2.
Figure 24. Street view of bicycle example 2.
Figure 25. Overhead view of bicycle example 2 (image courtesy of the United States Geological Survey).
This approach has the following characteristics:
Once these characteristics are entered into the spreadsheet calculator, the resulting Bike ISI values are 1.3 for through movements, 1.6 for right turns, and 2.7 for left turns (Figure 26). These values can also be obtained from Tables 14, 18, and 19 in Appendix B.
1 mi/h = 1.6 km/h Figure 26. Spreadsheet calculation of bike ISI values for bicycle example 2.
Bicycle Example 3Example 3 for Bike ISI is the westbound approach of a four-leg, signalized intersection. Figure 27, Figure 28, and Figure 29 show onstreet and overhead photos of the approach of interest (indicated by arrow).
Figure 27. Street view of bicycle example 3.
Figure 28. Street view of bicycle example 3.
Figure 29. Overhead view of bicycle example 3 (image courtesy of the United States Geological Survey). This approach has the following characteristics:
Once these characteristics are entered into the spreadsheet calculator, the resulting Bike ISI values are 4.0 for through movements, 2.3 for right turns, and 3.4 for left turns (Figure 30). These values can also be obtained from Tables 15,18, and 20 in Appendix B.
Figure 30. Spreadsheet calculation of bike ISI values for bicycle example 3. FHWA-HRT-06-130 |