Evaluation of Shared Lane Markings
CHAPTER 4. CAMBRIDGE, MA, EXPERIMENT
INTRODUCTION
In Cambridge, MA, the experiment was a before-after evaluation of sharrows placed at a 10-ft spacing from the curb to help prevent dooring crashes with parked motor vehicles. The objective was to determine whether the 10-foot spacing would have a positive effect on where cyclists and motorists were positioned compared with no sharrows. Assuming parked vehicles use 7 ft of space, this placement would result in the center of the sharrows being 3 ft from the parked vehicles. The 10-ft spacing would determine whether an alternative to the 11-ft spacing recommended in the 2009 version of the MUTCD would be effective.(1) An 11-ft spacing assumes that a motorist will move around a bicyclist. However, in congested urban situations, motorists frequently are not able to move into an adjacent lane, so they may track over the sharrow at 11 ft from the curb, resulting in bicyclists not being able to see the sharrows, as well as the markings wearing away.
The experiment was conducted on Massachusetts Avenue, a four-lane divided street with approximately 29,000 vehicles per day, parallel parking on both sides of the street, and a speed limit of 30 mi/h. The street is a busy transit corridor, and parked motor vehicle turnover is frequent. The number of peak hour bicyclists ranges from approximately 150 bicyclists in the morning peak to 200 bicyclists in the evening peak. The sharrows were placed 10 ft from the curb with approximately 200 ft of spacing on both sides of the street over approximately 2,500 ft before and after the immediate vicinity of where data were being collected (near Lancaster and Garfield streets). Information on the sharrows and the study was discussed at the city's bicycle advisory committee, the Cambridge Bicycle Committee, and posted on the city Web site, but no other direct outreach was made to road users. Figure 5 shows a view of Massachusetts Avenue in the before condition, and figure 6 shows the typical cross section sketch of Massachusetts Avenue, representing the before and after conditions. The cross section for Massachusetts Avenue in the study area is variable and is a few inches wider in the outbound direction (away from Boston) near Garfield Street. Other than the addition of the sharrows, no changes were made to the street.
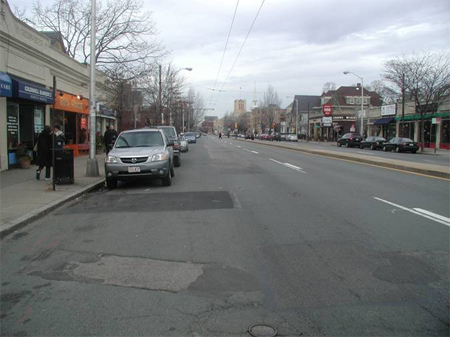
Figure 5. Photo. Massachusetts Avenue in the before condition.
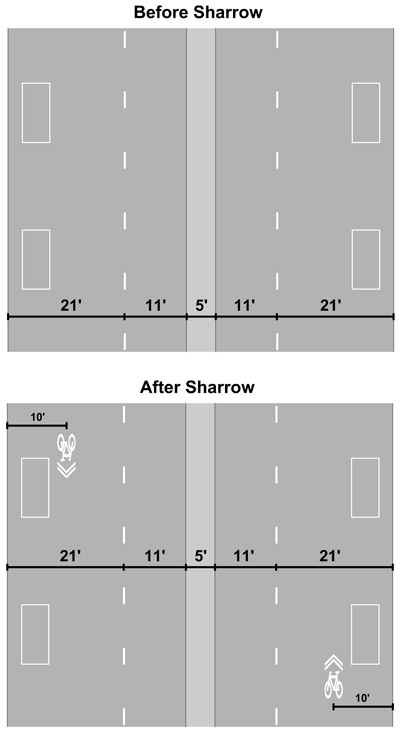
Figure 6. Illustration. Cross section view of Massachusetts Avenue before and after sharrow installation.
DATA COLLECTION AND REDUCTION
Local data collectors videotaped bicyclists riding along Massachusetts Avenue before and after placement of the sharrows along the street. Inbound traffic (toward Boston) was videotaped near Lancaster Street, and outbound traffic (away from Boston) was videotaped near Garfield Street. Videotaping was performed at various times of the day on weekdays when it was not raining. The before data were collected in fall 2007 and spring and summer 2008. The after data were collected in fall 2008. Overall, approximately 50 hours of videotape were collected.
Approximately 200 images were obtained from the videotapes for both the inbound and outbound directions for the following before and after conditions (total of more than 1,600 images): (1) bicycle to parked motor vehicle with a following motor vehicle present, (2) bicycle to parked motor vehicle with no following motor vehicle, (3) bicycle to passing motor vehicle, and (4) motor vehicle in the travel lane to parked motor vehicle with no bicycles present. All of these spatial measures were from tire to tire. SigmaScan® was used to examine images from the videotapes to determine the necessary spacing measures.(13).
Data for two other elements were also collected during the before and after periods. Free-flowing speeds of motor vehicle traffic were obtained with radar, and the distances from the curb for both the front and rear tires of parked motor vehicles were measured.
Besides obtaining the spacing images described previously, the videotapes were coded to collect information about the bicyclists and to examine the operations of bicycles and motor vehicles when a motor vehicle was following or passing a bicycle in the presence of parked motor vehicles, as well as interactions between bicycles and parked motor vehicles (e.g., existing open doors, near dooring events, or motorists pulling into or out of a parking space). Researchers systematically selected a pro rata share from each before and after videotape to accumulate the desired number of bicyclists and events, amounting to approximately 350 bicyclists in both the before and after periods and balanced by the inbound versus the outbound direction.
RESULTS
The results pertain to a number of variables and are derived from the spacing images extracted from the videotapes and from the coding of the bicycle and motor vehicle interactions. A total of 351 bicyclists followed by motorists or involved with parked motor vehicles were systematically selected in the before period, and 359 were selected in the after period. Bicyclist interactions with motorists were coded. Totals deviating from these numbers represent missing values, and chi-square tests were used to compare the distributions.
Bicyclist Data
Males accounted for 62 percent of the bicyclists, and females accounted for 38 percent. There was no difference in the before versus after periods. A total of 69 percent of bicyclists wore a helmet and 31 percent did not, and there was no difference in the before versus after periods.
Motor Vehicle Data
Table 1 shows the proximity of motor vehicles to bicycles by period. The table provides the frequencies with row and column percentages in parentheses. Such a table layout will be used throughout this report. In the before period, examination of the column percentages shows that 6 percent of motor vehicles were following bicycles, 73 percent were passing, and 21 percent were involved in another maneuver (the vast majority of which were parked vehicle events). In the after period, 14 percent of motor vehicles were following bicycles, 79 percent were passing, and 7 percent were involved in another maneuver. Following means that the motor vehicles did not attempt to overtake and pass the bicyclist, and passing means that the bicyclist was actually passed by the motor vehicle. The other parked vehicle events had a primary influence on the changes in this distribution. The differences were statistically significant (p < 0.0001).
Table 1. Motor vehicle proximity to bicycles, Cambridge, MA.
Motor Vehicle Proximity |
Before Period |
After Period |
Total |
Following |
21
(6.0)1 |
51
(14.2) |
72
(10.1) |
Passing |
256
(72.9) |
284
(79.1) |
540
(76.1) |
Other |
74
(21.1) |
24
(6.7) |
98
(13.8) |
Total |
351
(49.4)2 |
359
(50.6) |
710
(100.0) |
Table 2 shows whether motor vehicles changed lanes when overtaking bicycles. In the before period, 11 percent of motor vehicles completely changed lanes, 37 percent moved partway into the next lane, 27 percent stayed in the lane behind the bicycle ("No movement"), and 24 percent were involved in a parked vehicle event ("Not applicable"). In the after period, 3 percent of motor vehicles completely changed lanes, 22 percent moved partway into the next lane, 65 percent stayed in the lane behind the bicycle, and 9 percent were involved in a parked vehicle event. The differences were statistically significant (p < 0.0001). When parked motor vehicle events were removed, the differences remained statistically significant (p < 0.0001).
Table 2. Motor vehicle lane changes, Cambridge, MA.
Method |
Before Period |
After Period |
Total |
Changed lanes |
40
(11.4)1 |
11
(3.1) |
51
(7.2) |
Moved partway |
131
(37.3) |
80
(22.3) |
211
(29.7) |
No movement |
95
(27.1) |
235
(65.5) |
330
(46.5) |
Not applicable |
85
(24.2) |
33
(9.2) |
118
(16.6) |
Total |
351
(49.4)2 |
359
(50.6) |
710
(100.0) |
In the before period, 94 percent of motor vehicle overtaking events were considered to be performed safely. In the after period, the percentage increased to 98 percent, and the differences were statistically significant (p = 0.002).
Bicycle Data
In the after period, 94 percent of bicyclists rode over the sharrows (see figure 7), 4 percent did not, and the position could not be determined for 1 percent of bicyclists.
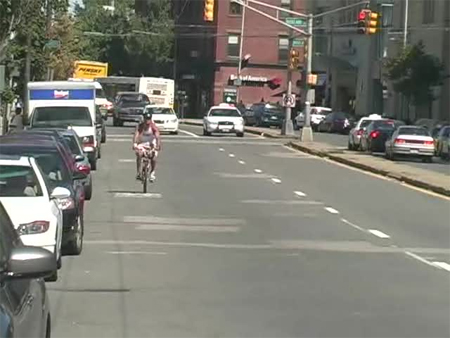
Figure 7. Photo. Bicyclist riding over the sharrows.
In the before period, 8 percent of the bicyclists were considered to be near the center of the lane, and the percentage decreased to 5 percent in the after period. Similarly, 13 percent of the bicyclists were considered to have taken the lane (i.e., moved to a position so that a motor vehicle could not pass) in the before period, and the percentage decreased to 8 percent in the after period. The differences were statistically significant (p = 0.0187) and likely reflected the 94 percent of bicyclists who rode over the sharrow.
Table 3 shows the frequency of the distribution of parked motor vehicle events by period. Possible dooring events (i.e., the parked motor vehicle door was opened close to the time the bicyclist was passing) decreased from 4 percent in the before period to less than 1 percent in the after period. Figure 8 shows an example of a potential dooring event. Existing open doors decreased from 5 percent in the before period to 2 percent in the after period. Motor vehicles pulling into or out of parking spaces decreased from 11 percent in the before period to 4.5 percent in the after period. No parked vehicle events increased from 78 percent in the before period to 93 percent in the after period. There were no "other" events in the after period; most of these constituted double-parked motor vehicles in the before period. The differences were statistically significant (p < 0.0001).
Table 3. Parked motor vehicle events, Cambridge, MA.
Event |
Before Period |
After Period |
Total |
Existing open door |
16
(4.6)1 |
8
(2.2) |
24
(3.4) |
Pulling in or out of parking space |
39
(11.1) |
16
(4.5) |
55
(7.8) |
Possible dooring |
13
(3.7) |
1
(0.3) |
14
(2.0) |
Other event |
8
(2.3) |
0
(0.0) |
8
(1.1) |
No parked motor vehicle events |
275
(78.4) |
334
(93.0) |
609
(85.8) |
Total |
351
(49.4)2 |
359
(50.6) |
710
(100.0) |
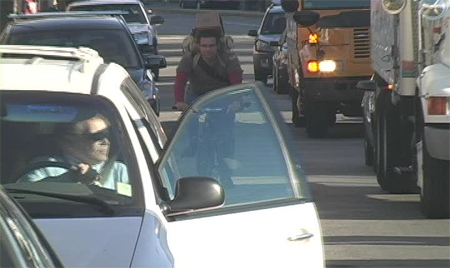
Figure 8. Photo. Potential dooring event.
Interactions Between Bicycles and Motor Vehicles
Table 4 shows the distributions of avoidance maneuvers and conflicts by period. In the before period, 76 percent of the bicycle-motor vehicle interactions resulted in avoidance maneuvers (change in speed or direction to avoid the other party), and less than 1 percent resulted in conflicts (sudden change in speed or direction to avoid the other party). Conversely, 37 percent of the interactions resulted in avoidance maneuvers, and less than 1 percent resulted in conflicts in the after period. Having neither an avoidance maneuver nor conflict (the "None" category) increased from 24 percent in the before period to 63 percent in the after period. Combining the avoidance maneuvers and conflicts and comparing them with "None" to produce a valid chi-square test shows that the differences were statistically significant (p < 0.0001). This indicates that there was a more segregated flow after placement of the sharrows, with less maneuvering between bicycles and motor vehicles.
Table 4. Avoidance maneuvers and conflicts, Cambridge, MA.
Interaction |
Before Period |
After Period |
Total |
Avoidance maneuver |
266
(75.8)1 |
131
(36.5) |
397
(55.9) |
Conflict |
2
(0.6) |
3
(0.6) |
5
(0.7) |
None |
83
(23.7) |
225
(62.7) |
308
(43.4) |
Total |
351
(49.4)2 |
359
(50.6) |
710
(100.0) |
Table 5 shows the number of times bicyclists and motorists yielded in the before and after periods while interacting with each other. Bicyclist yielding (i.e., changed direction or speed to give way to a motor vehicle) decreased from 23 percent in the before period to 7 percent in the after period. Motorist yielding (i.e., changed direction or speed to give way to a bicycle) increased from 5 percent in the before period to 10 percent in the after period. The differences were statistically significant (p < 0.0001).
Table 5. Bicyclist and motorist yielding behavior, Cambridge, MA.
Yielding behavior |
Before Period |
After Period |
Total |
Bicyclist |
80
(22.9)1 |
26
(7.3) |
106
(15.0) |
Motorist |
19
(5.4) |
34
(9.5) |
53
(7.5) |
Neither |
251
(71.7) |
298
(83.2) |
549
(77.5) |
Total |
350
(49.4)2 |
358
(50.6) |
708
(100.0) |
Table 6 shows the full distribution of bicyclist responses during their interaction with motorists by period. The coding scheme was described previously in chapter 3 of this report. Bicyclists were able to keep moving safely 90 percent of the time in the after period as compared to 73 percent in the before period. Slight direction changes (typically a slight lateral movement) decreased from 17 percent in the before period to 6 percent in the after period. Major direction changes (typically a rapid shift to avoid a motor vehicle, object, pavement discontinuity, etc.) decreased from 3 percent in the before period to less than 1 percent in the after period. Bicyclists continued riding unsafely in 2 percent of the after period interactions compared to less than 1 percent in the before period. Comparing the "Kept moving safely" responses and the "Slight direction change" responses with all other rows combined resulted in the distributions being statistically significant (p < 0.0001).
Table 6. Bicyclist responses during interactions with motor vehicles, Cambridge, MA.
Bicyclist Response |
Before Period |
After Period |
Total |
Kept moving safely |
256
(73.1)1 |
322
(89.7) |
578
(81.5) |
Kept moving unsafely |
2
(0.6) |
7
(2.0) |
9
(1.3) |
Slowed, stops pedaling |
14
(4.0) |
4
(1.1) |
18
(2.5) |
Slight direction change |
61
(17.4) |
23
(6.4) |
84
(11.9) |
Major direction change |
12
(3.4) |
2
(0.6) |
14
(2.0) |
Full stop |
3
(0.9) |
1
(0.3) |
4
(0.6) |
Not applicable |
2
(0.6) |
0
(0.0) |
2
(0.3) |
Total |
350
(49.4)2 |
359
(50.6) |
709
(100.0) |
Table 7 shows the full distribution of motorist responses during their interaction with bicyclists by period. Motorists completely changed lanes in 12 percent of the interactions in the before period and 3 percent in the after period. Motorists had slight direction changes (typically a slight lateral movement) in 38 percent of the interactions in the before period and 22 percent in the after period. Motorists had no changes in 44 percent of the interactions in the before period and 65 percent in the after period. Motorists slowed in 5 percent of the interactions in the before period and 10 percent in the after period. Comparing the rows "Changed lanes," "Slight direction change," "No change," and "Slows" with all other rows combined resulted in the distributions being statistically significant (p < 0.0001).
Table 7. Motorist responses during interactions with bicyclists, Cambridge, MA.
Motorist Response |
Before Period |
After Period |
Total |
Changed lanes |
41
(11.7)1 |
11
(3.1) |
52
(7.4) |
Slight direction change |
132
(37.7) |
77
(21.6) |
209
(29.6) |
Brakes |
1
(0.3) |
0
(0.0) |
1
(0.1) |
Full stop |
2
(0.6) |
2
(0.6) |
4
(0.6) |
Major direction change, swerve |
1
(0.3) |
1
(0.3) |
2
(0.3) |
Slowed |
19
(5.4) |
35
(9.8) |
54
(7.7) |
No change |
154
(44.0) |
230
(64.6) |
384
(54.4) |
Total |
350
(49.6)2 |
356
(50.4) |
706
(100.0) |
Spacing Data
Bicycle to Parked Motor Vehicle
Assuming parked vehicles use 7 ft of space, placement of sharrows at 10 ft from the curb would result in the center of the sharrows being 3 ft from parked motor vehicles. This could potentially result in bicyclists riding near or within the approximate 30-inch door zone of parked motor vehicles. Table 8 shows the average spacing between bicycles in the travel lane and parked motor vehicles (tire to tire) along with the results of ANOVA that tested the differences in the average spacing. Researchers also looked at the percentage of spacing values within 30 and 40 inches to consider the effect of sharrows on the number of bicycles within or near the door zone.
Table 8. Bicycle to parked motor vehicle, Cambridge, MA.
Motor Vehicle Present |
Direction |
Analysis of Average Spacing |
Analysis of the Percentage
Within 30 inches |
Analysis of the Percentage
Within 40 inches |
Number of Observations |
Average Spacing (inches) |
Results of
ANOVA Test |
Percent |
Results of
Chi-Square Test |
Percent |
Results of
Chi-Square Test |
Before |
After |
F(df1,df2) |
p-Value |
Before |
After |
Chi-Square |
p- Value |
Before |
After |
Chi-Square |
p-
Value |
Before |
After |
Yes |
Outbound and inbound |
40.1 |
42.3 |
5.06
(1,406) |
0.025 |
12.8 |
13.2 |
0.02 |
0.893 |
58.2 |
41.0 |
11.95 |
< 0.001 |
196 |
212 |
Yes |
Outbound |
42.7 |
43.1 |
0.07
(1,205) |
0.791 |
8.0 |
11.2 |
0.61 |
0.434 |
44.0 |
38.3 |
0.69 |
0.434 |
100 |
107 |
Yes |
Inbound |
37.4 |
41.5 |
10.29
(1,199) |
0.002 |
17.7 |
15.2 |
0.22 |
0.637 |
72.9 |
43.8 |
17.41 |
< 0.001 |
96 |
105 |
No |
Outbound and inbound |
45.8 |
45.0 |
0.35
(1,404) |
0.553 |
5.5 |
11.2 |
4.24 |
0.039 |
37.5 |
44.7 |
2.15 |
0.143 |
200 |
206 |
No |
Outbound |
46.5 |
45.1 |
0.72
(1,203) |
0.398 |
6.0 |
9.9 |
0.88 |
0.347 |
32.0 |
43.8 |
3.03 |
0.082 |
100 |
105 |
No |
Inbound |
45.1 |
44.9 |
0.01
(1,199) |
0.931 |
5.0 |
12.9 |
3.82 |
0.051 |
43.0 |
45.5 |
0.13 |
0.716 |
100 |
101 |
When a following motor vehicle was present, there was an increase in spacing of about 2 inches (from 40.1 to 42.3 inches) when data from both directions were combined. This increase was statistically significant (p < 0.05). However, most of this increase was for the inbound direction, where the increase was about 4 inches (from 37.4 to 41.5 inches). The percentage of spacing values within 40 inches decreased from about 58 to 41 percent when both directions were combined; thus, 59 percent of bicyclists were riding more than 40 inches from parked vehicles after sharrow placement. For the inbound direction, the percentage within 40 inches decreased from about 73 to 44 percent; thus, more than 56 percent were riding more than 40 inches from parked vehicles after sharrow placement. These percentage reductions were statistically significant. There was little change in the percentage with 30 inches.
When a motor vehicle was not present (i.e., bicyclists could choose their riding space), the change in average spacing between a bicyclist and a parked vehicle was negligible, approximately 45 inches before and after with outbound and inbound directions combined. The percentage of spacing values within 30 inches increased from 5.5 to 11.2 percent when data from both directions were combined, which was statistically significant. This may be a reflection of a number of bicyclists riding some distance from parked vehicles in the before period gravitating toward or riding over the sharrows in the after period. For the inbound direction, the percentage within 30 inches increased from 5.0 to 12.9 percent, which was statistically significant. When the percentage within 40 inches was examined, the outbound direction showed an increase from 32 to 43.8 percent, which was marginally significant (p = 0.082).
Bicycle to Passing Motor Vehicle
Table 9 shows the results from the analysis of spacing between bicycles and passing motor vehicles. Comparison of the mean spacing values showed little difference between the before and after periods (approximately 68 inches). In terms of direction, spacing for the inbound direction showed the largest increase in the after period (about 1.1 inches), but the change was not statistically significant. Additionally, in the inbound direction, the percentage of spacing values within 40 inches decreased from about 7 percent in the before period to 1 percent in the after period, and this difference was marginally significant (p = 0.071). None of the other changes was statistically significant.
Table 9. Bicycle to passing motor vehicle, Cambridge, MA.
Direction |
Analysis of Average Spacing |
Analysis of the Percentage
Within 40 inches |
Analysis of the Percentage Within 50 inches |
Number of Observations |
Average Spacing (inches) |
Results of ANOVA Test |
Percent |
Results of Chi-Square Test |
Percent |
Results of Chi-Square Test |
Before |
After |
F(df1,df2) |
p-Value |
Before |
After |
Chi-Square |
p-Value |
Before |
After |
Chi-Square |
p-Value |
Before |
After |
Outbound and inbound |
68.2 |
68.5 |
0.04
(1,438) |
0.838 |
3.8 |
2.5 |
0.55 |
0.457 |
10.4 |
8.5 |
0.46 |
0.496 |
240 |
200 |
Outbound |
68.7 |
68.3 |
0.05
(1,238) |
0.823 |
1.4 |
4.0 |
0.70 |
0.402 |
7.1 |
9.0 |
0.74 |
0.390 |
140 |
100 |
Inbound |
67.5 |
68.6 |
0.29
(1,198) |
0.590 |
7.0 |
1.0 |
3.26 |
0.071 |
15.0 |
8.0 |
1.52 |
0.217 |
100 |
100 |
Motor Vehicle in Travel Lane to Parked Motor Vehicle
Table 10 shows the results from the analysis of the spacing between motor vehicles in the travel lane and parked motor vehicles when no bicycles were present. The introduction of the sharrows seems to have been associated with a significant increase in this spacing. For both outbound and inbound directions combined, the spacing increased 14 inches (from 80.9 to 95.0 inches). The increase in spacing was more pronounced in the inbound direction with a shift of 16 inches away from parked vehicles (from 77.4 to 93.6 inches) compared to the outbound direction, which experienced a shift of 12 inches away from parked motor vehicles (from 84.5 to 96.5 inches). All of these differences were statistically significant (p < 0.001). This result demonstrates that the sharrows were effective in moving motor vehicles in the travel lane away from parked motor vehicles.
Table 10. Motor vehicles in travel lane to parked motor vehicles, Cambridge, MA.
Direction |
Average Spacing (inches) |
Results of ANOVA Test |
Number of Observations |
Before |
After |
F(df1,df2) |
p-Value |
Before |
After |
Outbound and inbound |
80.9 |
95.0 |
113.92(1,398) |
< 0.001 |
200 |
200 |
Outbound |
84.5 |
96.5 |
44.95(1,198) |
< 0.001 |
100 |
100 |
Inbound |
77.4 |
93.6 |
74.60(1,198) |
< 0.001 |
100 |
100 |
Distance between Tires of Parked Motor Vehicles and the Curb
Table 11 shows the results from the analysis of the distance between the back and front tires of parked motor vehicles and the curb. When both directions were combined, there was little change in the distance between the tires and the curb after the introduction of the sharrows. However, in the outbound direction, the distance between the back tire and the curb increased by an average of almost 2.3 inches, and this increase was statistically significant (p = 0.038). The distance between the front tire and the curb increased by about 1.3 inches, but this increase was not statistically significant. In the inbound direction, the distance between the back tire and the curb decreased by about 0.7 inches, and the distance between the front tire and the curb decreased by about 1.5 inches. These reductions in the inbound direction were not statistically significant.
Table 11. Distance between tire and curb, Cambridge, MA.
Direction |
Distance Between Back Tire
and Curb |
Distance Between Front Tire
and Curb |
Number of Observations |
Average Distance (inches) |
Results of ANOVA Test |
Average Distance (inches) |
Results of ANOVA Test |
Before |
After |
F(df1,df2) |
p-Value |
Before |
After |
F(df1,df2) |
p-Value |
Before |
After |
Outbound and inbound |
9.0 |
9.7 |
0.63(1,196) |
0.430 |
9.2 |
9.0 |
0.07(1,196) |
0.798 |
115 |
83 |
Outbound |
8.1 |
10.4 |
4.45(1,84) |
0.038 |
8.6 |
9.9 |
1.65(1,84) |
0.203 |
46 |
40 |
Inbound |
9.6 |
8.9 |
0.39(1,110) |
0.534 |
9.7 |
8.2 |
1.53(1,110) |
0.219 |
69 |
43 |
Analysis of Speed Data
Table 12 shows the average speeds of motor vehicles before and after sharrows. When speed data from both directions were combined, the implementation of the sharrows was associated with about a 1.1-mi/h decrease in average speed. In the outbound direction, the reduction was about 2.7 mi/h, whereas in the inbound direction, there was an increase of about 0.5 mi/h.
Table 12. Average speeds before and after sharrows, Cambridge, MA.
Direction |
Before |
After |
Average Speed (mi/h) |
Number of Observations |
Average Speed (mi/h) |
Number of Observations |
Outbound and inbound |
28.6 |
496 |
27.5 |
129 |
Outbound |
30.0 |
246 |
27.3 |
73 |
Inbound |
27.2 |
250 |
27.7 |
56 |
Figure 9 shows a histogram of the speed data for the before and after periods. The speed data in the before period is right-skewed. In the after period, the distribution is unusual and seems more like a modal distribution with one peak around 23 mi/h and another peak around 30 mi/h.
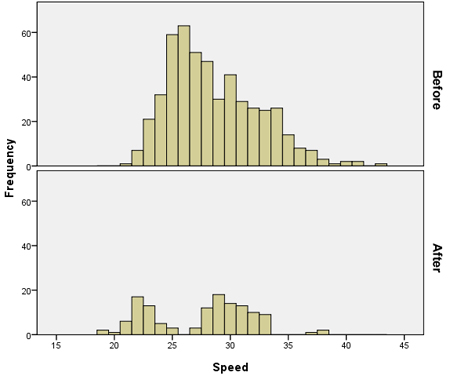
Figure 9. Graph. Speed data in Cambridge, MA.
For statistical analysis, the speed data were divided into three categories (0–25 mi/h, 26–31 mi/h, and > 30 mi/h) and examined through chi-square tests. The results shown in table 13 indicate that for the outbound and inbound combined row and separate outbound row, a larger percentage of speeds are in the first category (i.e., 0–25 mi/h) after the implementation of the sharrows. The chi-square tests confirmed that the distribution was indeed different in the after period in these two situations. This was not apparent until the data were analyzed near the end of the study, and another set of data was not collected. The speed distributions in the before and after periods for the inbound direction are much closer, and the chi-square test did not show a statistically significant difference.
Table 13. Analysis of speed data, Cambridge, MA.
Speed Category
(mi/h) |
Outbound and Inbound Direction |
Outbound Direction |
Inbound Direction |
Before |
After |
Before |
After |
Before |
After |
Count |
Percent |
Count |
Percent |
Count |
Percent |
Count |
Percent |
Count |
Percent |
Count |
Percent |
0–25 |
120 |
24.2 |
47 |
36.4 |
33 |
13.4 |
29 |
39.7 |
87 |
34.8 |
18 |
32.1 |
26–30 |
232 |
46.8 |
47 |
36.4 |
105 |
42.7 |
21 |
28.8 |
127 |
50.8 |
26 |
46.4 |
> 30 |
144 |
29.0 |
35 |
27.1 |
108 |
43.9 |
23 |
31.5 |
36 |
14.4 |
12 |
21.4 |
Total |
496 |
100.0 |
129 |
100.0 |
246 |
100.0 |
73 |
100.0 |
250 |
100.0 |
56 |
100.0 |
Chi-square |
8.322 |
24.918 |
1.71 |
p-value |
0.0156 |
< 0.0001 |
0.425 |
SUMMARY
The following results include highlights from the data analysis of bicycles interacting with motor vehicles, comparing the after period to the before period:
- The percentage of motorists who made no movement to change lanes when overtaking a bicycle increased from 27 to 66 percent.
- The percentage of safe overtaking movements by motorists (approached and passed the bicyclist without difficulty) increased from 94 to 98 percent.
- A total of 94 percent of the bicyclists rode over the sharrows.
- The percentage of bicyclists who took the lane decreased from 13 to 8 percent.
- When a bicyclist was approaching, existing open vehicle doors decreased from 5 to 2 percent; opening of doors decreased from 4 to 0.3 percent, and motor vehicles pulling in or out of parking spaces decreased from 11 to 4.5 percent. No actual dooring events occurred in either the before or after period.
- The percentage of avoidance maneuvers decreased from 76 to 37 percent.
- The percentage of motor vehicles making no movement (i.e., continuing to follow) when following bicycles increased from 44 to 65 percent.
- The percentage of bicyclists who yielded (i.e., changed direction or speed to give way to a motor vehicle) decreased from 23 to 7 percent.
- The percentage of motorists who yielded (i.e., changed direction or speed to give way to a bicycle) increased from 5 to 10 percent.
- The percentage of bicyclists who kept moving safely increased from 73 to 90 percent.
- The percentage of bicyclists who made slight direction changes decreased from 17 to 6 percent.
- The percentage of motorists who made complete lane changes deceased from 12 to 3 percent.
- The percentage of motorists who made slight direction changes decreased from 38 to 22 percent.
- The percentage of motorists who slowed increased from 5 to 10 percent.
- The percentage of motorists who made no change while following a bicyclist increased from 44 to 65 percent.
All of these differences were independent of inbound and outbound direction. Taken together, the results portray a more segregated flow with less lateral movement of bicycles and motor vehicles.
Results from the spacing analysis in the presence of a following motor vehicle in the after period included the following:
- The distance from bicycles in the travel lane to parked motor vehicles increased from 40.1 to 42.3 inches when both directions were combined. For the inbound direction, the distance increased from 37.4 to 41.5 inches. For the outbound direction, the distance increased from 42.7 inches in the before period to 43.1 inches in the after period.
- The percentage of bicyclists who rode within 40 inches (near the door zone) of parked motor vehicles decreased, mostly in the inbound direction from 73 to 44 percent. The change in the outbound direction was from 44 percent in the before period to 38 percent in the after period.
- The percentage of bicyclists who rode within 30 inches (in the door zone) of parked vehicles showed no change (13 percent before and after).
In the absence of a following motor vehicle in the after period, spacing results were as follows:
- The change in distance between a bicyclist and a parked motor vehicle was negligible (approximately 45 inches before and after).
- The percentage of bicyclists who rode within 40 inches of parked motor vehicles increased from 37.5 to 45 percent, although this may reflect the high percentage of bicyclists gravitating toward or riding over the sharrow.
When motorists passed bicyclists in the after period, spacing results were as follows:
- The mean spacing values showed little difference (approximately 68 inches in the before and after periods).
- The overall percentage of spacing distance between passing motor vehicles and bicyclists within 40 inches decreased from 3.8 to 2.5 percent.
When motor vehicles in the travel lane tracked next to parked motor vehicles in the absence of bicycles in the after period, spacing results were as follows:
- The spacing increased 16 inches in the inbound direction (from 77.4 to 93.6 inches), increased 12 inches in the outbound direction (from 84.5 to 96.5 inches), and increased 14 inches combined (from 80.9 to 95.0 inches).
The distance between the tires of parked motor vehicles and the curb showed little change from the before period to the after period (approximately 9 inches before and after). However, in the outbound direction, the distance between the back tire and the curb increased by an average of 2.3 inches, and this increase was statistically significant (p = 0.038).
Overall, there appeared to be safety effects associated with the installation of the sharrows 10 ft from the curb on Massachusetts Avenue. Perhaps the most important effect was the 14-inch increase in spacing between motor vehicles in the travel lane and parked motor vehicles, which would increase the operating space for bicyclists. Other spacing results were variable. The distance from a bicycle in the travel lane to a parked motor vehicle increased, although the effect was present only in the inbound direction. The percentage of bicyclists who rode within 40 inches (near the door zone) of parked motor vehicles when a following motor vehicle was present decreased. When motorists passed bicyclists in the after period, the mean spacing values showed little difference, but the percentage of spacing distances within 40 inches decreased. The largest effects shown for the spacing variables were for the inbound direction. Even after review of data and discussions with the Cambridge staff, the reasons for the before-after differences in behavior between the two sides of the street were not immediately apparent. It is possible that the slightly wider street cross section in the outbound direction had an effect, as well as the increase in distance from the rear tire of parked motor vehicles to the curb.
A number of variables related to the interaction of bicycles and motor vehicles also showed positive effects. The overall results reflect more segregated flow with less lateral movement of bicycles and motor vehicles (see figure 10). The figure shows motor vehicles tracking behind each other while giving operating space to a bicyclist in the after period. It might be inferred that motorists in the after condition were traveling in a lane location to give bicyclists sufficient room and did not need to change lanes in order to pass safely.
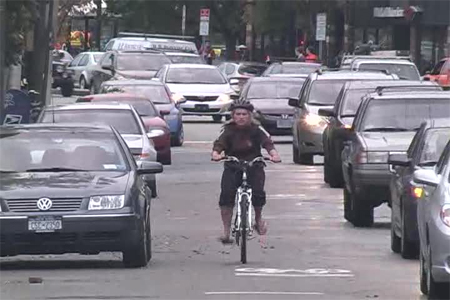
Figure 10. Photo. Operating space for a bicyclist in the after period.
|


