Evaluation of Shared Lane Markings
CHAPTER 6. SEATTLE, WA, EXPERIMENT
INTRODUCTION
Seattle, WA, is in the process of placing sharrows as approved in the bicycle plan adopted in fall 2007. Based on this plan, the city is expected to have up to 100 mi of streets with sharrows in a variety of situations. Some streets have the sharrows on both sides of the street, including sharrows to prevent dooring from parked vehicles. The city was interested in experimenting with placing sharrows in the center of the lane on a downhill portion (3.6 percent grade) of Fremont Street, a popular street for bicycle commuters. Fremont Street is a two-lane street with parking on both sides, a speed limit of 30 mi/h, and approximately 10,000 vehicles per day (see figure 18). The distance from the curb to the centerline was 20 ft on both sides. Sharrows had previously been installed at the traditional 11-ft spacing from the curb on a four-lane section of the street with parking on both sides for approximately 2,000 ft prior to this downhill section.
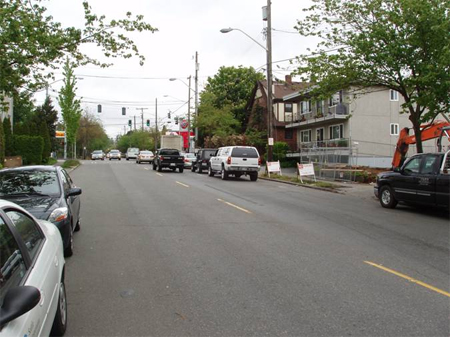
Figure 18. Photo. Fremont Street in the before condition.
The remainder of the street change was to shift the center line of the street and to place a 5-ft bicycle lane on the uphill portion of the street (right side of figure 18). Parking would remain on both sides of the street. Since bicycles travel close to the same speed as motor vehicles on the downgrade (left side of figure 18), the hypothesis was that placing the sharrow in the center of the lane would potentially encourage bicyclists to take the lane, removing them from the door zone.
The cross section changes are shown in figure 19. In after period 1, the bike lane including a parking stripe was added, and the center line of the street was shifted approximately 2.5 ft to the left. In after period 2, the sharrows were installed 12.25 ft from the curb and spaced 100 to 200 ft (varied due to intersecting side streets) over approximately 1,000 ft between N 46th and N 42nd streets. The city also added a parking stripe along the downhill side, although this was not part of the original experiment. Parking turnover is infrequent on the street in the early morning hours when the data were collected. No public educational information was provided regarding sharrow placement.
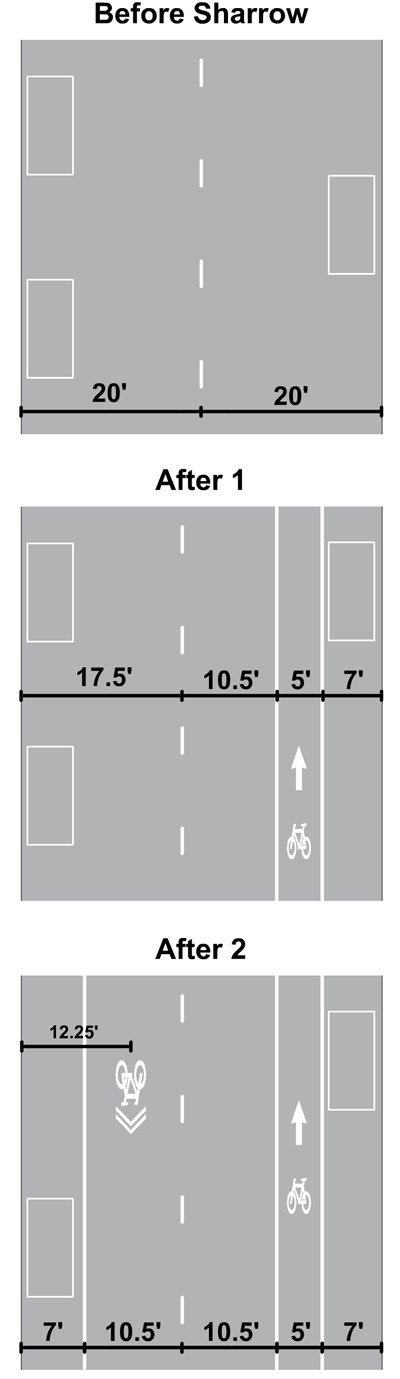 . .
Figure 19. Illustration. Cross section view of Fremont Street before and after sharrow installation.
DATA COLLECTION AND REDUCTION
Local data collectors videotaped bicyclists riding along Fremont Street during three time periods: (1) from June to August 2008 before any changes were made to the street, (2) from September to November 2008 after moving the centerline 2.5 ft to the left and placing the bicycle lane in the uphill direction (see figure 19, After 1), and (3) from June to July 2009 after sharrow installation in the downhill direction. Downhill traffic was videotaped at a midblock location south of N 46th Street. Videotaping was performed on weekdays when it was not raining during early morning commute times. After the videotaping was complete, SigmaScan® was used to examine images from the videotapes to determine the spacing measures of interest.(13) Approximately 150–200 images were obtained for the downhill direction for the three conditions. The categories of images were as follows: (1) bicycle to parked vehicle without being affected by a following motor vehicle and (2) passing motor vehicle to parked motor vehicle with no bicycles present. It was rare for motor vehicles to pass bicycles on this downhill section; thus, the distance between bicycles and passing motor vehicles was not obtained. The videotapes were also used to code other variables pertaining to the interactions of bicycles and motor vehicles.
RESULTS
The results pertain to a number of variables and are derived from the spacing images extracted from the videotapes as well as from the coding of the bicycle and motor vehicle interactions. Weather was a factor in the data collection, and less time was spent collecting data during after period 1. However, approximately 130–240 images were extracted for each of the three phases for a total of 411 images. When coding the interactions between bicycles and motor vehicles, researchers obtained 153 observations in the before period, 108 in after period 1, and 150 in after period 2. Totals in the subsequent tables deviating from these numbers represent missing values. Chi-square tests were used to compare the distributions.
Bicyclist Data
Table 32 shows the gender of bicyclists by period. Overall, 77 percent of the bicyclists were male, and 23 percent were female. There were no differences by period. Helmet use was 99 to 100 percent in each period.
Table 32. Gender of bicyclists, Seattle, WA.
Gender |
Before Period |
After Period 1 |
After Period 2 |
Total |
Male |
118
(77.1)1 |
83
(76.9) |
115
(76.7) |
316
(76.9) |
Female |
35
(22.9) |
25
(23.2) |
35
(23.3) |
95
(23.1) |
Total |
153
(37.2)2 |
108
(26.3) |
150
(36.5) |
411
(100.0) |
Motor Vehicle Data
Table 33 shows the proximity of motor vehicles to bicycles. Overall, 62 percent of motor vehicles were following bicycles, 35 percent were passing, and 3 percent were involved in another movement (e.g., a parked motor vehicle event). The differences were not statistically significant.
Table 33. Motor vehicle proximity to bicycles, Seattle, WA.
Proximity |
Before Period |
After Period 1 |
After Period 2 |
Total |
Following |
85
(55.6)1 |
75
(69.4) |
95
(63.3) |
255
(62.0) |
Passing |
61
(39.9)1 |
31
(28.7) |
52
(34.7) |
144
(35.0) |
Other |
7
(4.6)1 |
2
(1.9) |
3
(2.0) |
12
(2.9) |
Total |
153
(37.2)2 |
108
(26.3) |
150
(36.5) |
411
(100.0) |
Table 34 shows whether motor vehicles changed lanes when overtaking bicycles. Overall, less than 1 percent of motor vehicles completely changed lanes, 30 percent moved partway into the next lane, 67 percent stayed in the lane behind the bicycle (no movement), and 3 percent were involved in a parked vehicle event ("Not applicable"). Comparing "Moved partway" versus "No movement" for a valid chi-square test showed that the differences were not statistically significant.
Table 34. Motor vehicle changed lanes, Seattle, WA.
Method |
Before Period |
After Period 1 |
After Period 2 |
Total |
Changed lanes |
0
(0.0)1 |
0
(0.0) |
2
(1.3) |
2
(0.5) |
Moved partway |
40
(26.1) |
33
(30.6) |
49
(32.7) |
122
(29.7) |
No movement |
105
(68.6) |
73
(67.6) |
97
(64.7) |
275
(66.9) |
Not applicable |
8
(5.2) |
2
(1.9) |
2
(1.3) |
12
(2.9) |
Total |
153
(37.2)2 |
108
(26.3) |
150
(36.5) |
411
(100.0) |
Overall, 97 percent of motor vehicle overtaking events were considered to be performed safely. The differences were not statistically significant.
Bicycle Data
In after period 2, 15 percent of bicyclists rode over the sharrow, while 85 percent did not. Figure 20 shows the typical position of a bicyclist riding downhill. The travel lanes were narrowed to 10.5 ft wide in after period 2. The horizontal lines on the street are grids used as calibrators for the determination of spacing data. There was no evidence that the grids had any effect on bicycle position.
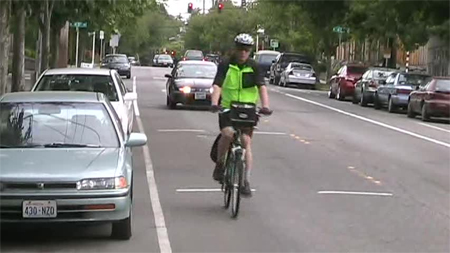
Figure 20. Photo. Typical position of bicyclist after sharrow installation.
Table 35 shows the bicycle riding position. In the before period, 73 percent rode proximate to parked vehicles (i.e., usually within 2 to 3 ft). This decreased to 49 percent in after period 1 as more bicyclists moved toward the center of the lane with the narrower travel lane. In after period 2, with the sharrows in place, 75 percent of the bicyclists rode proximate to parked vehicles. The differences were statistically significant (p < 0.0001).
Table 35. Bicycle riding position, Seattle, WA.
Bicycle Riding Position |
Before Period |
After Period 1 |
After Period 2 |
Total |
Near parked vehicle |
111
(72.6)1 |
53
(49.1) |
113
(75.3) |
277
(67.4) |
Near center
of lane |
42
(27.5) |
55
(50.9) |
37
(24.7) |
134
(32.6) |
Total |
153
(37.2)2 |
108
(26.3) |
150
(36.5) |
411
(100.0) |
Similar results are found in table 36, showing whether bicyclists took the lane. In the before period, 28 percent of the bicyclists were considered to have taken the lane. The percentage increased to 51 percent in after period 1 and decreased to 27 percent in after period 2. The differences were statistically significant (p < 0.0002).
Table 36. Bicyclist took lane, Seattle, WA.
Bicyclist Took Lane |
Before Period |
After Period 1 |
After Period 2 |
Total |
No |
110
(72.3)1 |
53
(49.1) |
110
(73.3) |
273
(66.4) |
Yes |
42
(27.6) |
55
(50.9) |
40
(26.7) |
137
(33.3) |
Total |
152
(37.1)2 |
108
(26.3) |
150
(36.6) |
410
(100.0) |
Table 37 shows the distribution of parked motor vehicle events. As parking turnover was low on Fremont Street during commute time, these events were infrequent, with slightly more occurrences in the before period than in both after periods. Comparing "None" to the other events, the differences were not statistically significant. Figure 21 shows a possible dooring event in the before period if the bicyclist had been riding in the door zone.
Table 37. Parked motor vehicle events, Seattle, WA.
Event |
Before Period |
After Period 1 |
After Period 2 |
Total |
Existing open door |
2
(1.3)1 |
1
(0.9) |
0
(0.0) |
3
(0.7) |
Pulling in or out |
3
(2.0) |
1
(0.9) |
1
(0.7) |
5
(1.2) |
Possible dooring |
2
(1.3) |
0
(0.0) |
0
(0.0) |
2
(0.5) |
None |
146
(95.4) |
106
(98.2) |
149
(99.3) |
401
(97.6) |
Total |
153
(37.2)2 |
108
(26.3) |
150
(36.5) |
411
(100.0) |
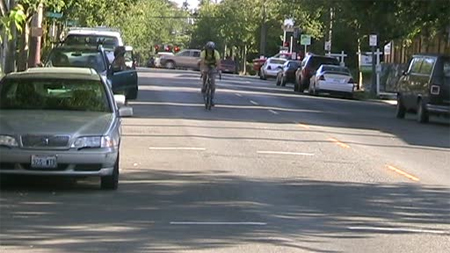
Figure 21. Photo. Potential dooring in before period.
Interactions Between Bicycles and Motor Vehicles
Table 38 shows the distribution of avoidance maneuvers. The results show that there were no conflicts. Across all periods, 38 percent of bicycle/motor vehicle interactions resulted in avoidance maneuvers (change in speed or direction to avoid the other party). The differences were not statistically significant.
Table 38. Avoidance maneuvers, Seattle, WA.
Interaction |
Before Period |
After Period 1 |
After Period 2 |
Total |
Avoidance maneuver |
61
(39.9)1 |
41
(38.0) |
54
(36.0) |
156
(38.0) |
None |
92
(60.1) |
67
(62.0) |
96
(64.0) |
255
(62.0) |
Total |
153
(37.2)2 |
108
(26.3) |
150
(36.5) |
411
(100.0) |
Table 39 shows the number of times bicyclists and motorists yielded in the before and after periods while interacting with each other. Bicyclist yielding (changed direction or speed to give way to a motor vehicle) was infrequent and decreased across all periods. Motorist yielding (changed direction or speed to give way to a bicycle) was also infrequent and decreased across the periods. The differences were statistically significant (p = 0.0487).
Table 39. Yielding behavior of bicyclists and motorists, Seattle, WA.
Yielding Behavior |
Before Period |
After Period 1 |
After Period 2 |
Total |
Bicyclist |
5
(3.3)1 |
3
(2.8) |
1
(0.7) |
9
(2.2) |
Motorist |
20
(13.1) |
7
(6.5) |
8
(5.3) |
35
(8.5) |
Neither |
128
(83.7) |
98
(90.7) |
141
(94.0) |
367
(89.3) |
Total |
153
(37.2)2 |
108
(26.3) |
150
(36.5) |
411
(100.0) |
Table 40 shows the full distribution of bicyclist responses during their interaction with motorists. Bicyclists were able to continue riding safely 92 percent of the time in the before period, 84 percent in after period 1, and 98 percent in after period 2. Slight direction changes occurred 8 percent of the time in the before period, 16 percent in after period 1, and 1 percent in after period 2. Comparing the "Kept moving safely" category with the "Slight direction change" category resulted in statistically significant differences (p < 0.0001). The major chi-square contribution resulted from more slight direction changes than expected in after period 1 and less slight direction changes than expected in after period 2. This would be associated with more bicyclists taking the lane when the lane width was first narrowed to install the bicycle lane in after period 1.
Table 40. Bicyclist responses during interactions with motor vehicles, Seattle, WA.
Bicyclist Response |
Before Period |
After Period 1 |
After Period 2 |
Total |
Kept moving safely |
140
(91.5)1 |
91
(84.3) |
147
(98.0) |
378
(92.0) |
Slowed, stopped pedaling |
0
(0.0) |
0
(0.0) |
1
(0.7) |
1
(0.2) |
Slight direction change |
12
(7.8) |
17
(15.7) |
2
(1.3) |
31
(7.5) |
Braked |
1
(0.7) |
0
(0.0) |
0
(0.0) |
1
(0.2) |
Total |
153
(37.2)2 |
108
(26.3) |
150
(36.5) |
411
(100.0) |
Table 41 shows the full distribution of motorist responses during their interaction with bicyclists. Motorists had slight direction changes in 28 percent of the interactions across all periods, had no changes in 64 percent, and slowed in 6 percent. Comparing these three rows showed no statistically significant differences in the distributions.
Table 41. Motorist responses during interactions with bicyclists, Seattle, WA.
Motorist Response |
Before Period |
After Period 1 |
After Period 2 |
Total |
Changed lanes |
0
(0.0)1 |
0
(0.0) |
2
(1.3) |
2
(0.5) |
Slight direction change |
40
(26.1) |
32
(29.6) |
44
(29.3) |
116
(28.2) |
Braked |
2
(1.3) |
1
(0.9) |
1
(0.7) |
4
(1.0) |
Full Stop |
2
(1.3) |
0
(0.0) |
1
(0.7) |
3
(0.7) |
Slowed |
11
(7.2) |
6
(5.6) |
7
(4.7) |
24
(5.8) |
No change |
98
(64.1) |
69
(63.9) |
95
(63.3) |
262
(63.8) |
Total |
153
(37.2)2 |
108
(26.3) |
150
(36.5) |
411
(100.0) |
Spacing Measures
Table 42 shows the results of the analysis of the average spacing between bicycles and parked motor vehicles (without an influential moving motor vehicle present) and the analysis of the average spacing between motor vehicles in the travel lane and parked vehicles during the before period, after period 1, and after period 2. The average spacing between bicycles and parked vehicles did not change very much across the periods. The slight increase from the before period to after period 1 is likely associated with more bicyclists moving toward the center of the lane after the centerline was shifted and the lane narrowed to accommodate the bicycle lane addition in the uphill direction. The slight decline in spacing in after period 2 was likely associated with 15 percent of the bicyclists riding over the sharrows in this area. With low parking turnover during the morning commute, the bicyclists seemed comfortable riding somewhat proximate to the parked motor vehicles. As would be expected, the average spacing between passing motor vehicles and parked motor vehicles decreased dramatically due to the change in the roadway configuration.
Table 42. Analysis of average spacing data, Seattle, WA.
Measure |
Average Spacing (inches) |
Results of ANOVA Test |
Number of Observations |
Before Period |
After Period 1 |
After Period 2 |
F(df1,df2) |
p- Value |
Before Period |
After Period 1 |
After Period 2 |
Bicycle to parked vehicle |
45.82 |
47.48 |
44.50 |
1.53(2,531) |
0.217 |
240 |
145 |
149 |
Motor vehicle to parked vehicle |
69.78 |
51.38 |
51.96 |
243.22(2,484) |
<0.001 |
198 |
131 |
158 |
Table 43 shows the results obtained when the distribution of spacing between bicycles and parked motor vehicles was compared in the before and after periods. The percentage of spacing values within 30 inches (within the door zone) increased from about 6 percent in the before period to about 12 percent in the two after periods. Chi-square tests indicated that the change in this distribution was marginally significant (p = 0.054). The percentage of spacing values within 40 inches also seems to have increased slightly in the two after periods, but this change was not statistically significant.
Table 43. Distribution of the percentage of spacing between bicycles and parked vehicles, Seattle, WA.
Percentage |
Before Period |
After Period 1 |
After Period 2 |
Chi-Square |
p-Value |
Within 30 inches |
5.8 |
11.7 |
12.2 |
5.86 |
0.054 |
Within 40 inches |
36.3 |
38.6 |
43.6 |
2.11 |
0.348 |
SUMMARY
Data analysis results from bicycles interacting with motor vehicles across all periods are as follows:
- There was no change in the percentage of motorists following (62 percent) and passing (35 percent) bicyclists.
- There was no change in whether a motorist changed lanes when overtaking a bicyclist. When motorists passed bicyclists, 30 percent of them tended to move partway to the opposing lane.
- There was no difference in the safety of the manner in which motorists were following and passing bicyclists. Overall, 97 percent of the movements were performed safely.
- A total of 15 percent of the bicyclists rode over the sharrow during after period 2.
- A significantly higher percentage of bicyclists were shifting toward the center of the lane and taking the lane during after period 1 when the travel lane was narrowed to accommodate the addition of the bike lane in the uphill direction (from 28 percent in the before period to 51 percent in after period 1).
- There were few bicycle/parked motor vehicle events, as parking turnover was low during morning commute time.
- There was no difference in the percentage of avoidance maneuvers (38 percent overall) across periods.
- The percentage of bicyclists who yielded (changed direction or speed to give way to a motor vehicle) decreased from slightly more than 3 percent in the before period to slightly less than 3 percent in after period 1 and to less than 1 percent in after period 2.
- The percentage of motorists who yielded (changed direction or speed to give way to a bicycle) decreased from 13 percent in the before period to 6.5 percent in after period 1 and to 5 percent in after period 2.
- The percentage of bicyclists who kept moving safely (basically no change in speed or direction) decreased from 92 percent in the before period to 84 percent in after period 1 and increased to 98 percent in after period 2.
- The percentage of bicyclists who made slight direction changes increased from 8 percent in the before period to 16 percent in after period 1 and decreased to 1 percent in after period 2.
- There were no differences in motorist responses to bicyclists across all periods. Overall, motorists made no changes in 64 percent of the interactions.
Results from the spacing analysis in the absence of motor vehicles included the following:
- The average spacing between bicycles and parked vehicles did not change much across the periods. The spacing values were 45.8 inches in the before period, 47.5 inches in after period 1, and 44.5 inches in after period 2.
- The percentage of spacing values within 30 inches (within the door zone) increased from about 6 percent in the before period to about 12 percent in the two after periods, which was a marginally significant increase.
- The percentage of spacing values within 40 inches was 36 percent in the before period, 39 percent in after period 1, and 44 percent in after period 2. The changes were not significant.
Results for the distance of motor vehicles in the travel lane from parked motor vehicles in the after period were as follows:
- The average spacing between motor vehicles in the travel lane and parked motor vehicles decreased about 18 inches due to the change in the roadway configuration (the lane had been narrowed by 2.5 ft).
This sharrow experiment in Seattle, WA, was intended to encourage bicyclists to ride in the center of the lane in a downhill situation on a narrow street. The results do not show an effect directly attributable to the sharrow itself because only 15 percent of the bicyclists rode over the sharrow. However, the percentage of bicyclists riding in the center of the lane increased from 27 percent in the before period to 51 percent in after period 1 after the effective lane width had been narrowed by about 2.5 ft in the shift of the centerline to accommodate the addition of the uphill bike lane. Surprisingly, the percentage of bicyclists riding in the center of the lane in after period 2, after the sharrows were installed, reverted to 25 percent. Coupled with this is the lack of change in spacing between bicycles and parked motor vehicles across all three periods. In addition, the percentage of bicyclists riding within 30 inches of parked vehicles increased from about 6 percent in the before period to about 12 percent for both after periods.
Conversely, the average spacing between bicycles and parked vehicles was about 15 inches outside of the door zone, and the percentage actually riding within the door zone was quite small for all three phases. All of the videotape data were collected during the early morning commute time, and the bicyclists riding the street appeared to be aware that the probability of a door opening or a motor vehicle pulling into or out of a parking space would be low. In addition, the videotapes show motorists yielding to trailing bicyclists when pulling into a parking space or turning right and looking in the side mirror once parked to see whether a bicyclist was coming before opening the door.
From the videotapes, the impression was that the bicyclists were mainly experienced commuters. The typical location of the bicyclists in the street was outside of the door zone but not quite in the center of the roadway. Many rode close to the outside edge of the sharrow in after period 2. It is apparent that they were aware of following motor vehicles and that they were ready to move to the center of the roadway if necessary to prevent being squeezed next to parked vehicles. This was especially noticeable once the downhill lane had been narrowed in after period 1.
It is possible that the narrowing of the lane in the downhill direction in after period 1 had more of an effect than the subsequent sharrow placement on the interactions of bicyclists and motorists. In the before period, motorists may have been more inclined to pass a bicyclist if the opportunity was present. As a result, more motorists appeared to be driving faster and then had to slow for bicyclists. This led to more motorist yielding (reducing speed or changing direction) during the before period. Once the downhill lane was narrowed, the percentage of both bicyclists and motorists who yielded to the other decreased both in after period 1 and then slightly more in after period 2. The same was true for the percentage of bicyclists who kept riding safely. The value decreased from 92 percent in the before period to 84 percent during after period 1 and increased to 98 percent in after period 2. Similarly, the percentage of bicyclists who made slight direction changes (e.g., moved to the left) increased from 8 percent in the before period to 16 percent in after period 1 and decreased to 1 percent in after period 2. Thus, the flow of bicycles and motor vehicles was smoother in after period 2.
Sharrows had been placed along a four-lane portion of Fremont Street for approximately 2,000 ft prior to the downhill section. The placement was the recommended 11-ft spacing from the curb to prevent dooring by parked motor vehicles. It is possible that the nominal position of bicyclists was thus attained prior to the downhill section of Fremont Street and that the placement of the sharrow in the center of the street was unexpected. In addition, no public education was provided with the introduction of the sharrows on the downhill section. Although insufficient for truly representative comparison data, it would have been useful to have gathered videotape data at an upstream location to ascertain the spacing of bicyclists from parked motor vehicles on the section of the street prior to the steep downgrade.
It would seem that sharrows used in downhill situations such as this one would work by having bicyclists track over the marking and more readily ride in the center of the lane. For whatever reasons, that effect was not achieved for this application in Seattle, WA. This may have been due to the fact that experienced bicyclists were already staying out of the door zone in the before period, coupled with the realization that they could control the lane without actually being in the middle of the lane. Having experienced motorists who were used to driving with bicyclists in the travel lanes could also be a factor. It is recommended that additional trials with sharrows in the center of the lane should be evaluated in other locations.
|


