U.S. Department of Transportation
Federal Highway Administration
1200 New Jersey Avenue, SE
Washington, DC 20590
202-366-4000
Federal Highway Administration Research and Technology
Coordinating, Developing, and Delivering Highway Transportation Innovations
 |
| This report is an archived publication and may contain dated technical, contact, and link information |
|
Publication Number: FHWA-HRT-10-068
Date:November 2010 |
Crosswalk Marking Field Visibility Study
CHAPTER 6. DATA ANALYSIS
CROSSWALK RATING
POSTDRIVE TASK–MARKING PREFERENCE
CROSSWALK RATINGThe participants rated each crosswalk on how easy it was to see. The ratings given were A through F (with no E), with A being excellent or very easy to see and F being completely unacceptable or very hard to see, as shown in figure 32 . These ratings were recorded along with participant comments and explanations of the response, when available. The ratings were summarized to make the following comparisons:
In addition, the average scores were compared to the illuminance present at the sites and the retroreflectivity of the markings.
Comparison Among Study Site Markings Figure 66 summarizes the average crosswalk ratings by marking type. The graph suggests that continental and bar pairs received similar ratings, with slightly more A ratings for continental than for bar pairs. Transverse markings were observed to receive more C ratings than continental and bar pairs. Transverse markings were the only marking type to receive D and F ratings.
Figure 66. Graph. Rating by marking type for study sites.
Figure 67 through figure 69 summarize crosswalk ratings for the three marking types subdivided by the time of the day (day or night). As illustrated in figure 67 and figure 68, similar ratings were given to the bar pairs and continental markings during both daytime and nighttime conditions. For example, the bar pairs had about 55 percent A ratings in both day and night (see figure 67 ). A variation in day and night ratings, however, is observed for transverse markings (see figure 69 ). The transverse markings received better ratings in the night than in the day. Several participants commented about sun glare or shadow issues during the daytime at the study sites.
Figure 67. Graph. Rating by light level for study sites bar pairs marking.
Figure 68. Graph. Rating by light level for study sites continental marking.
Figure 69. Graph. Rating by light level for study sites transverse marking.
To compare among marking patterns, table 31 was generated to summarize the crosswalk ratings for the three marking types. It contains the same information shown in figure 67 through figure 69 . Within both daytime and nighttime conditions, continental and bar pairs were given better ratings than transverse markings. For example, 54 percent of the participants gave the bar pairs an A rating and 67 percent gave the continental markings an A rating; however, only 26 percent gave an A rating for transverse markings during the nighttime. The subdivision of ratings by light level does reveal that transverse markings received different ratings during the day than at night. Bar pairs and continental markings however, received similar ratings in both the daytime and nighttime. Table 31. Rating by light level.
Table 32 summarizes crosswalk ratings for the three marking types subdivided by light level (day or night) and age group. Age groups did not influence the type of ratings given to the different marking patterns; continental and bar pairs were given better ratings than transverse markings by both young (younger than 55) and old (55 or older) participants. Table 31 illustrates that transverse markings received better ratings during nighttime. Table 32 illustrates that the finding does not vary for young or old participants. In both cases, transverse markings had better ratings during nighttime conditions than during daytime conditions. Table 32. Rating by age group and light level.
A chi–square test for homogeneity was conducted to compare the proportion of participants giving A, B, or C ratings for each marking type. In some combinations, the proportion of participants was subdivided by marking type and light (day or night). The test hypothesis was that the proportions of ratings received by each marking type for the given runs were same. This hypothesis was rejected when the calculated p–value for the test statistic (calculated chi square) was lower than the test significance level (0.05). The test results were the same as the observations made in figure 66 through figure 69 and table 31 and found the following:
The odds ratio for continental and bar pairs were estimated for nighttime ratings to further understand their association. The odds ratio shows whether the probability of an event is the same for two groups. An odds ratio of 1 implies that the event is equally likely in both groups. For nighttime ratings for continental markings when compared to the bar pairs, the estimated odds of getting a rating of A is 45 percent higher and that of getting a rating of C is 64 percent lower. This implies that continental markings have a higher likelihood of receiving a better rating when compared to the bar pairs markings. This result is same as the observation made for table 31.
Comparison Among Existing Markings There were no existing sites with bar pairs markings, hence only continental and transverse markings at the study sites were compared to the existing intersection and midblock sites. All the midblock crosswalks had warning signs, which participants said helped them detect the crosswalks. Transverse markings at the intersection of Kimbrough at Penberthy and those at the midblock on Kimbrough were used for this comparison. Continental markings at the intersection of Kimbrough and Olsen and those at the midblock on Tom Chandler were also used. The ratings for continental markings on Olsen are thought to be affected by a dip in the pavement, based on participants' comments. Also, the ratings for continental midblock markings on the clockwise route on Tom Chandler are thought to be affected by the smaller available viewing distance from the turn onto the street. Therefore, the data for these sites are not included in the evaluations. Marking Type, Light Level, and Location Table 33 summarizes the ratings given to the existing markings at intersection and midblock sites by light level (day or night). As shown in the table, continental markings received better ratings than transverse markings at existing intersection and midblock crosswalks during both daytime and nighttime. During daytime, both the continental and transverse midblock markings received better ratings than the continental and transverse intersection markings. The advance pedestrian warning signs associated with the midblock locations could have contributed to the better ratings for the midblock locations as compared to the intersections. During nighttime, transverse markings were also found to have better ratings at the midblock location compared to the intersection location. Nighttime ratings of existing continental markings, however, were slightly better for the intersection site than for the midblock site. Near the continental midblock crossing are intramural soccer fields with bright lights that may have influenced the driver's ratings. Table 33. Existing marking ratings by location and light level.
Marking Type, Age Group, Light Level, and Location Table 34 summarizes the ratings given to continental and transverse existing markings subdivided by age group, location of the marking (intersection or midblock), and light level (day or night). The table illustrates that at intersection and midblock existing sites, young (younger than 55 years) and old (55 years or older) participants gave higher ratings to continental markings than transverse markings during both daytime and nighttime. Overall, younger participants gave better ratings to both existing marking types than older participants.
Table 34. Existing marking rating by light level, age group, and location.
Comparison Between New and Existing Markings The ratings given to the continental and transverse study sites were compared with those given to sites with existing markings. Bar pairs were not included since there were no existing sites with bar pairs markings. Table 35 summarizes the ratings given to the transverse and continental markings by location (intersection or midblock) and light level (day or night). The summary supports all the findings previously discussed, with emphasis on the following:
Table 35. Comparison of existing marking ratings with new marking (study sites) ratings by light level.
Comparison of Rating to Illuminance and Retroreflectivity An average score was calculated for each study site based on the nighttime ratings received. The score assigned to each rating is shown in table 36. Table 36. Score assigned to each rating.
The score for each rating was multiplied with the nighttime proportion of participants giving that rating for a site to calculate the average score of the site. The illuminance readings at the site were compared to this average score. Figure 70 shows the log of illuminance along with the average score for each study site on the clockwise route. Figure 71 shows the log of illuminance along with the average score for each study site on the counterclockwise route. The sites were grouped by the type of marking such that the initial three columns are the bar pairs sites, the middle three columns are the continental sites, and the final three columns are the transverse sites. For the clockwise route shown in figure 70, all but the southbound Agronomy bar pairs crosswalk had a log of illuminance value of nearly 1 or greater. The counterclockwise route had two sites with very low illuminance values–northbound Agronomy at the bar pairs site and northbound Discovery at the transverse site. For each of these locations, a decrease in the average nighttime score is not seen. The graphs show that the average score curve does not follow the same trend as log illuminance. This implies that there is no noticeable effect of illuminance on the nighttime ratings of the study sites.
Figure 70. Graph. Average crosswalk score with illuminance level at the site (clockwise route).
Figure 71. Graph. Average crosswalk score with illuminance level at the site (counterclockwise route).
The retroreflected luminance (RL) values were much higher than the minimum required, as shownin figure 72 and figure 73 . So, the RL values of all the sites are believed to be practically the same.Figure 72 shows the average RL along with the average score for each study site on the clockwise route, and figure 73 shows the counterclockwise route. The graphs show that the average score curve does not follow the same trend as the average RL. This implies that there is no noticeable effect of retroreflectivity on the nighttime rating given at a study site.
Figure 72. Graph. Average crosswalk score with retroreflectivity level at the site (clockwise route).
Figure 73. Graph. Average crosswalk score with retroreflectivity level at the site (counterclockwise route).v
Summary of Crosswalk Ratings In summary, the observations show that the ratings for continental and bar pairs are consistent over various comparison groups, with better ratings for bar pairs and continental markings than for transverse markings.
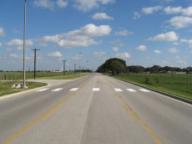
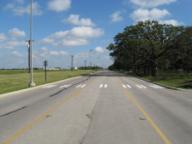
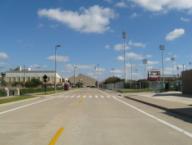
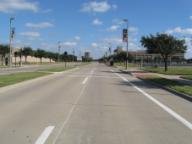
POSTDRIVE TASK–MARKING PREFERENCETable 37 shows the results from the postdrive task of marking preference. Drivers' preference for the continental or bar pairs markings was supported by the results of the postdrive task. The photo of the continental markings was selected as the favorite by 54 percent of the participants. The second photo of continental markings showed the markings at a greater distance and was selected as the favorite by 22 percent of the participants. The bar pairs markings photo was the favorite for 23 percent of the participants. The photos of the transverse markings were almost always selected as either fourth or fifth out of the five photos, representing 97–100 percent of the participants. Table 37. Results from postdrive task–marking preference.
FHWA-HRT-10-068
|
||||||||||||||||||||||||||||||||||||||||||||||||||||||||||||||||||||||||||||||||||||||||||||||||||||||||||||||||||||||||||||||||||||||||||||||||||||||||||||||||||||||||||||||||||||||||||||||||||||||||||||||||||||||||||||||||||||||||||||||||||||||||||||||||||||||||||||||||||||||||||||||||||||||||||||||||||||||||||||||||||||||||||||||||||||||||||||||||||||||||||||||||||||||||||||||||||||||||||||||||||||||||||||||||||||||||||||||||||||||||||||||||||||||||||||||||||||||||||||||||||||||||||||||||||||||||||||||||||||||||||||||||||||||||||||