|
Limited information exists on the effects of pedestrians and bicycles at signalized intersections. Chapter 9 of the HCM provides an adjustment for pedestrians conflicting with right turns, and suggests applying this factor for left turns from one-way streets. The HCM makes no provision for dealing with the effect of pedestrians on left turns in other situations. While this may be acceptable with large opposing volumes (Figure 2), it certainly underestimates the effect of pedestrians on left turns when opposing traffic volumes are low (Figure 3). The HCM suggests in Chapter 14 that, to adjust for bicycles, one may consider one bicycle as one pedestrian. The result is an incomplete, theoretically unconnected framework for pedestrian-bicycle adjustments.
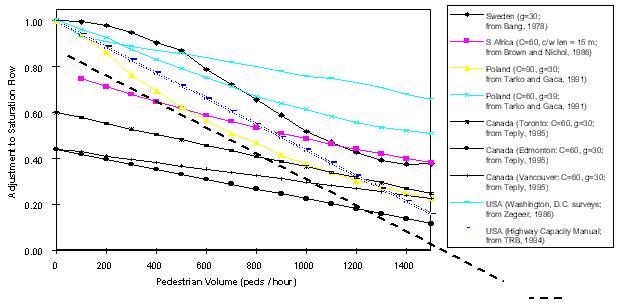
To give a sense of the differences between the HCM and other adjustment factors worldwide, values of the right-turn saturation flow adjustment factor from various sources were compared (Figure 4). The South African model shown technically covers left turns, but vehicles keep to the left in that country. Each value represents the additional adjustment to right-turning flow due to pedestrians (i.e., beyond the saturation flow adjustment due to turn radius). Of all the methods represented, only the Swedish model and one of the Polish models flatten out with higher pedestrian volumes. The remaining models are roughly parallel above 600 pedestrians/h, with the exception of the HCM, which falls at a steeper rate. The range of adjustments was quite striking: The difference between Zegeer's method and Canada's model fro Edmonton excees 0.5 across all pedestrian volumes. While pedestrian or driver behavior may explain some of this variance, a difference of 50 percent seems rather high
The range of values represented in the literature, the lack of an intuitive lessening of additional pedestrian impact at higher pedestrian volumes in the HCM procedure, and the large variation between the HCM and competing methods together call for a reexamination of the effect of pedestrians on turning vehicles. These reasons are in addition to the lack of an adjustment of left-turning saturation flow due to pedestrians. These concerns highlight a need for a congruent, theoretically sound framework for all pedestrian adjustments. In addition, the complete absence of a bicycle adjustment factor is obviously problematic, given the increasing bicycle volumes in the United States.
|
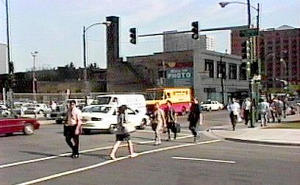
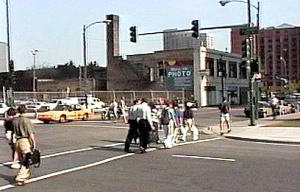
Figure 2: Opposing traffic screens pedestrians from the view of left-turning drivers at this intersection in Chicago, Illinois
|