U.S. Department of Transportation
Federal Highway Administration
1200 New Jersey Avenue, SE
Washington, DC 20590
202-366-4000
Federal Highway Administration Research and Technology
Coordinating, Developing, and Delivering Highway Transportation Innovations
 |
| This report is an archived publication and may contain dated technical, contact, and link information |
|
Publication Number: FHWA-HRT-98-106
Date: February 1998 |
Capacity Analysis of Pedestrian and Bicycle FacilitiesRecommended Procedures for the "Signalized Intersections" Chapter of the Highway Capacity Manual
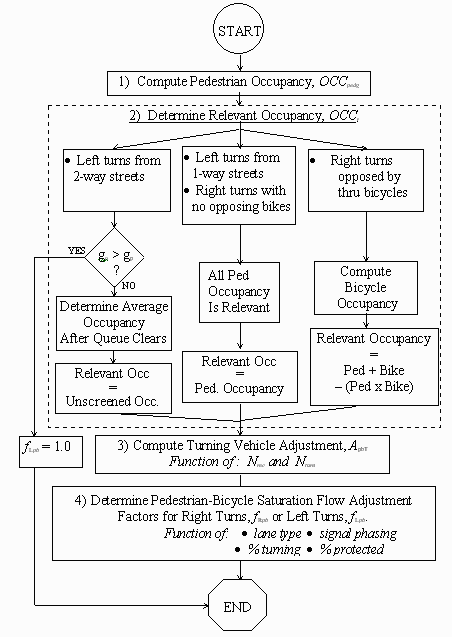
4. PROPOSED REVISIONS TO HCM CHAPTER 9 PROCEDURES4.1 Overview of Recommended Procedure for Determining fLpb and fpb This section summarizes the recommended procedure for calculating the value of an adjustment factor that describes the effect of pedestrians and bicycles on lane group saturation flow. For left turns, the adjustment is termed fLpb; for right turns, the adjustment is termed fRpb. The procedure consists of four basic parts that correspond to the four phases of the data reduction methodology described earlier. They are: Part 1: Determine average pedestrian occupancy, OCCpedg, during the entire pedestrian green; Part 2: Find relevant conflict zone occupancy, OCCr , by adjusting OCCpedgas needed for opposing traffic (left turns) or conflicting bicycles (right turns); Part 3: Compute permitted phase saturation flow adjustment just for turning vehicles due to pedestrian and bicycle interference, ApbT; and Part 4: Determine saturation flow adjustment factor for the lane group fLpb for left turns and fRpbt. for right turns. Table 2 contains two groups of parameters that comprise all of the input requirements needed to determine fLpb and fRpb. The first group lists several qualitative intersection parameters, while a second group contains quantitative parameters needed to complete the procedure. Within each group, the table lists the parameters in the order the procedure first needs them. While one will need between 9 and 13 input parameters, depending on the situation, the proposed procedure does not require any additional field data collection. In other words, the procedure requires no (zero) new input parameters beyond those needed for the current HCM. The following paragraphs provide an overview of each of the four parts. To aid the user, Figure 7 provides a flowchart, which serves as a visual outline to the procedure. In addition, Table 3 provides a list of symbols used in the computation of fLpb and fRpb. TABLE 2 Input Requirements for Determination of f Rpb and f Lpb Qualitative Parameter
Turn direction (left or right)
TABLE 3 List of symbols used in determination of fRpb and fLpb
The first part of the procedure determines the average occupancy of the conflict zone over the entire pedestrian green phase, OCCpedg . Practitioners can utilize existing counts by converting them to an hourly flow rate using the equations listed. Alternatively, if one counted pedestrians for an entire hour of pedestrian green time for a movement, the user could then enter the resulting count as the pedestrian volume/h green (V pedg) without conversion. If possible, data collectors should only count those pedestrians who conflict with turning vehicles.
The second part determines the relevant occupancy of the conflict zone from the perspective of the turning driver, OCC r. Follow the appropriate group of steps depending on the potential for interference by either opposing vehicles (left turns) or bicycles (right turns), if any. Of course, even an Aunopposed@ left turn can still experience a substantial reduction in turning capacity (Figure 8). In addition, based on field observations at California, Oregon, and Florida, if bicycle traffic weaves with right-turning traffic in advance of the stop-bar, the interaction between bicycles and right-turning vehicles is completely independent of the interaction with pedestrians, and one should ignore the bicycle volume when analyzing the signalized intersection. In other words, while weaving between bicycles and right turns may take place some distance upstream from the intersection, the interaction between pedestrians and right turns will occur at the intersection itself. The third part determines the adjustment to turning vehicle saturation flow during the permitted phase due to pedestrian or bicycle interference, A pbt. Use the effective (i.e., A as actually used @ number of turning lanes (N turn ) and receiving lanes (N rec ), which may or may not match those suggested by traffic control devices. For example, vehicles may consistently turn from an outer lane illegally, or double-parked vehicles may block a turn or receiving lane. The fourth part determines the actual saturation flow adjustment factor, f Rpb or fLpb. This factor represents the adjustment to saturation flow for a lane group containing turning vehicles subject to pedestrian and/or bicycle interference. One can A grossly estimate @ the proportion of right turns using the protected phase (P RTA ) as the proportion of the green phase that is protected, as suggested in the HCM on page 9-18 (TRB, 1994). Also, one can A grossly estimate @ the proportion of left turns using the protected phase (P LTA) as equal to (1- permitted phase f LT ) / 0.95. |