Capacity Analysis of Pedestrian and Bicycle Facilities
Recommended Procedures for the "Signalized Intersections" Chapter of the Highway Capacity Manual
5. EXAMPLE PROBLEMS
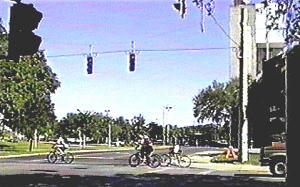 |
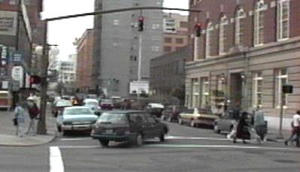
| Figure 12: Through Bicycles delay right-turning vehicle in Gainesville, Florida |
Table 13 provides several examples of the proposed procedure. For each example, the signal timing is held constant, with an effective pedestrian green time, gp, of 30 s, an overall effective green time (applied to bicycles as well as opposing vehicles), g, of 30 s, and a cycle length, C, of 60 s. To facilitate comparisons, the examples are grouped in pairs. Examples 1a and 1b refer to right turns, while Examples 2a, 2b, 2c, and 2d pertain to the opposed left turn case, which is not addressed in the current HCM.
Examples 1a and 1b compare the effect on right turns of adding a moderate bicycle volume, Vbike, to a constant pedestrian volume, Vped, of 500 pedestrians/h. Example 1a contains no bicycles, while Example 1b adds 175 bicycles/h (Figure 12). With conflicting bicycles, the saturation flow adjustment, fRpb, decreases from 0.50 to 0.43, and the capacity, c, decreases from 291 to 247 vehicles/h. Of note here, as the overall relevant occupancy, OCCr, increased from 50 to 57 percent with the additional bicycles, the difference between the existing and proposed methods decreased from 232 to 205 vehicles/h.
Table 13 Examples showing impact of proposed adjustment factors on capacity
Table 13 (continued) Examples showing impact of proposed adjustment factors on capacity
Table 13 (continued) Examples showing impact of proposed adjustment factors on capacity
Examples 2a and 2b compare the effect on left turns of varying the number of receiving lanes for a constant, medium-high pedestrian volume, Vped, of 1000/h, and moderate opposing volume, Vo, of 600 vehicles/h. While both examples use a single left-turn lane, Example 2a contains one receiving lane while Example 2b adds a second receiving lane (Figure 13). With the additional receiving lane, the saturation flow adjustment, fLpb, increases from 0.78 to 0.87, and the capacity, c, increases from 535 to 595 vehicles/h. In addition, as the number of receiving lanes increased, the difference between the existing and proposed methods decreased from 149 to 89 vehicles/h.
Examples 3a and 3b compare the effect on left turns of varying the number of receiving lanes for a constant, high pedestrian volume, Vped, of 2000/h, and moderate opposing volume, Vo, of 600 vehicles/h. While both examples use a single left-turn lane, Example 3a contains one receiving lane while Example 3b adds a second receiving lane. With the additional receiving lane, the saturation flow adjustment, fLpb, increases from 0.71 to 0.83, and the capacity, c, increases from 486 to 565 vehicles/h. In addition, as the number of receiving lanes increased, the difference between the existing and proposed methods decreased from 198 to 119 vehicles/h.
Each of these examples shows a slight to moderate decrease in capacity using the new approach. Since the existing HCM does not consider the effect of pedestrians on opposed left turns, the resulting decrease in capacity is obviously not surprising. However, even though the pedestrian volume doubled from Example 2 to Example 3, the capacity only slightly decreased, because opposing traffic is screening the conflict zone for much of the time. In addition, since the proposed method only applies during the permitted phase, the capacity of a protected-only approach will not change under the proposed procedure. Finally, it is possible for the proposed method to predict more capacity than the existing HCM methodology if the pedestrian volume reaches a certain level.
 |
| Figure 13: Turning driver having two receiving lanes to choose from in Portland, Oregon. |
Figures 14, 15, and 16 offer an example that illustrates the potential impact of using fpb on level of service (LOS). Figure 14 depicts an intersection with vehicle volumes as shown for the eastbound, westbound, and southbound approaches. A total of 500 pedestrians/h use the crosswalk on the southbound approach, conflicting with right turns from the eastbound approach and left turns from the westbound approach. The intersection uses a simple two-phase signal as shown, with 30 s of green allocated to the major street and a 60-s cycle length.
The existing HCM procedure predicts that all movements and approaches for this example operate at LOS B (Figure 15). However, the current procedures underestimate the effect of pedestrians on right turns in many cases, including this example, and they ignore the effect of pedestrians on left turns. The revised procedure predicts that the major approaches will fall to LOS C, as will the intersection as a whole (Figure 16). The westbound left-turn lane group, in fact, drops from LOS B with the existing method to LOS E for the proposed method.
 |
| Figure 14: Example sketch |
|
|
Figure 15: Existing HCM method of capturing the effect of pedestrians on lane groups containing turning vehicles
|
|
|
Figure 16: Impact of proposed method for capturing the effect of pedestrians on lane groups containg turning vehicles
|
|