Capacity Analysis of Pedestrian and Bicycle Facilities
Recommended Procedures for the "Bicycles" Chapter of the Highway Capacity Manual
2. UNINTERRUPTED BICYCLE FACILITIES
This section focuses on the operational analyses of uninterrupted bicycle facilities, including exclusive off–street bicycle paths, mixed–use off–street paths, and designated bicycle lanes (or paved shoulders). The concept of "frequency of events" is proposed as the service measure of effectiveness for all three types of uninterrupted bicycle facilities. Events, for these procedures, are bicycle maneuvers required by a bicyclist on a path, including passings (same direction encounters) and meetings (opposite direction encounters) as presented by Botma (1995).
The total frequency of events on a facility for these procedures is related to the service volumes of bicycles using or projected to be using the facility, and does not have to be observed directly. Botma has determined the relationship between service volumes of bicycles and the frequencies of passings and meetings under a variety of conditions with the use of field studies and simulation. These relationships are based on certain assumptions regarding the mean speeds and speed distributions of bicycles and pedestrians, which are listed with the various procedures. The speeds of pedestrians and bicycles and their variability affect the number of passings and meetings that occur. If an analyst has detailed information available regarding local pedestrian and bicycle speeds, alternate volume/frequency relationships can be developed (Botma, 1995). However, the development of alternate equations will not be covered here.
A "lane" for bicycles throughout the recommended procedures is considered to be approximately 1.0 m (3.3 ft). However, the actual width of a bicycle facility is much less important than the number of effective bicycle lanes the facility operates with for these analyses. Each additional effective lane being used by bicyclists dramatically increases capacity irrespective of the width of the facility. While this report assumes that 2.1– to 2.4–m (7– to 8–ft) paths and 3–m (10–ft) paths will typically operate with two and three effective lanes, respectively, a particular facility may operate with a different number of effective lanes. Therefore, it is imperative that the number of effective bicycle lanes be observed in the field where possible prior to conducting these analyses.
Pending the development of metric standards for bicycle facilities, it is expected that most of the existing 2.4–m– (8–ft–) wide bicycle facilities conforming to current American Association of State and Highway Transportation Officials (AASHTO) English unit standards (AASHTO, 1991) will operate as two–lane facilities. However, due to the additional width, one should keep in mind that the LOS derived using the two–lane procedures may be on the conservative side. Unfortunately, until further research is conducted regarding these procedures in the United States, it is impossible to quantify the effect of minor differences in path width for a given number of effective bicycle lanes. However, it is the opinion of the research team that the procedures contained in this document will apply to most of the current existing 2.4–m (8–ft) bicycle facilities in the United States.
When using the following procedures, the analyst should note that bicycle flows have different peaking characteristics than motor vehicles. Bicycle volumes peak more abruptly, especially in the vicinity of college and university campuses. Daily volumes, or even hourly volumes, may not appear to be very substantial until this peaking is considered. One study in Madison, Wisconsin (Hunter and Huang, 1995), measured peak hour volumes as 10 to 15 percent of total daily volume at various locations. Another study in the state of Washington (Niemeier, 1996), conducted primarily in the Seattle area, measured peak hour factors between 0.52 and 0.82 at various locations. The applicability of these particular observations to other areas is unknown, but it is obvious from these numbers that failure to account for peaking characteristics when determining flow rates will often result in overly optimistic estimates of LOS.
The two–lane path procedures have also been extended to three–lane paths using the three–lane volumes reported by Botma (1995) and the same weights between passings and meetings as for two–lane paths. Botma only reported frequencies for two–lane paths in his article because he was unsure of the extension to three lanes. Therefore, the three–lane facility analyses presented here should be used with caution. While it is expected that a two–way path with 3–m (10–ft) lanes will operate with more than two effective lanes, the exact relationship between number of lanes and lane width is not yet known for U.S. conditions, and may depend on local bicyclist behavior.
Perhaps the most important thing to note when using the uninterrupted bicycle facility procedures is that LOS "F" is not equivalent to capacityfor the facility. An unacceptable number of events is always reached prior to capacity, and, in some cases, capacity can be almost twice the volume at which LOS F is reached. The procedures in this document are based on frequencies of events and perceived LOS, not on the carrying capacity of the facility.
2.1 Exclusive Off–Street Bicycle Paths
Exclusive off–street bicycle paths are separated from motor vehicle traffic and do not allow pedestrians. These facilities are often constructed to serve areas not served by city streets or to provide recreational opportunities for the public, as illustrated in Figure 1. These bicycle facilities accommodate the highest volumes of bicycles among the three types of uninterrupted facilities addressed in this document, and provide the best LOS because the bicycles are not forced to share the facility with other modes traveling at much higher or lower speeds.
The following equations, which were originally presented by Botma (1995), are proposed for computing the total frequency of events on exclusive bicycle paths. The equations are set up for two–way bicycle paths. For one–way exclusive bicycle paths, a value of zero would be used for the bicycle volume traveling in the opposite direction of that being evaluated.
| Fpass= 0.188 (Vbike-sm) |
[1] |
| Fmeet= 2 (Vbike-op) |
[2] |
| Ftotal= 0.5(Fmeet) + Fpass |
[3] |
where:
F pass = frequency of passing in events/h;
F meet = frequency of meeting in events/h;
F total = total weighted frequency of events in events/h;
V bike-sm = bike volume in the same direction being analyzed in bikes/h; and
V bike-op = bike volume in the opposite direction being analyzed in bikes/h.
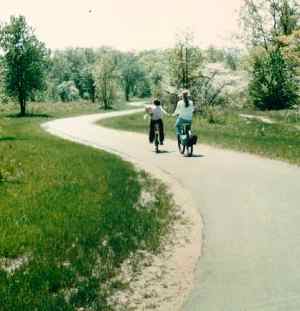 |
| FIGURE 1: Exclusive bicycle path |
The frequencies of meetings and passings resulting from these equations are based on the assumption that bicycle speeds on paths are normally distributed with a mean of 18 km/h (11.2 mi/h) and a standard deviation of 3 km/h (1.9 mi/h). These values are reasonable, based on the information reported in the Bicycle Literature Review Section of the Research Reportfor this project (Rouphail et al., 1997). If the observed mean speed or standard deviation of speed differs from these values, equations 1, 2, and 3 cannot be used. Consult Table 5 and Example 3 (described later) for such situations.
Tables 1 and 2, which are based on Botma's work, are then proposed to convert the total frequency of events to LOS. Service volumes for a 50:50 directional split are provided in the tables for reference. If a 50:50 directional split for the facility an be assumed, the LOS can be obtained directly by using the service volumes in the tables. For splits other than 50:50, Equations 1 through 3 can be used in combination with Tables 1 and 2.
TABLE 1 Level of Service (LOS) for two-lane, two-way exclusive bicycle paths (2.1- to 2.4-m paths)
| LOS |
Total frequency of events (events/h) |
Two-lane service volume (bikes/h) in both directions (50:50 split) |
| A |
< 40 |
65 |
| B |
< 60 |
105 |
| C |
< 100 |
170 |
| D |
< 150 |
250 |
| E |
< 195 |
325 |
| F |
≥ 195 |
------ |
| SOURCE: Adapted from Botma, 1995. |
TABLE 2 Level of Service (LOS) for three-lane, two-way exclusive bicycle paths (3–m paths)
| LOS |
Total frequency of events (events/h) |
Three-lane service volume (bikes/h) in both directions (50:50 split) |
| A |
< 90 |
150 |
| B |
< 140 |
230 |
| C |
< 210 |
350 |
| D |
< 300 |
500 |
| E |
< 375 |
630 |
| F |
≥ 375 |
------ |
| SOURCE: Adapted from Botma, 1995. |
All the service volumes given in this section for exclusive paths assume "ideal" conditions. Lateral obstructions, extended sections with appreciable grades, and other local factors may reduce the LOS for a facility. Unfortunately, such factors have not been sufficiently documented to date to make a quantitative assessment of their effects.
2.2 Mixed–Use, Off-Street Paths
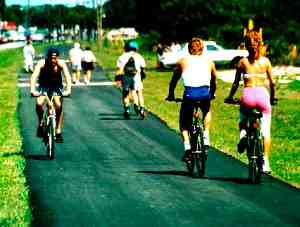 |
| FIGURE 2: Mixed–use off–street bicycle path |
Mixed-use, off-street paths, like exclusive bicycle paths, are separated from motor vehicle traffic. However, mixed-use paths allow others to use the path, including pedestrians, rollerbladers, rollerskaters, skateboarders, and those in wheelchairs and any other imaginable mode of non-motorized transportation, as illustrated in Figure 2. Mixed-use paths are often constructed for the same reasons as exclusive bicycle paths: to serve areas not served by city streets or to provide recreational opportunities for the public. Mixed-use paths are also very common on university campuses in the United States because motor vehicle traffic and parking are often heavily restricted. In the United States, there are very few paths limited exclusively to bicycles. Most off-street paths in this country fall into the mixed-use path category.
On mixed–use facilities, the presence of pedestrians can be detrimental to bicycle capacity because they move at much lower speeds. However, it is very difficult to establish a single bicycle/pedestrian equivalent value because the relationship between the two modes differs depending on their respective volumes, directional splits, and other conditions.
Note that the LOS on a mixed–use facility is not necessarily the same from the viewpoint of pedestrians and bicycles. Pedestrian LOS on mixed–use paths is discussed separately in the pedestrian chapter of the Research Reportfor this project (Rouphail et al., 1997).
The following equations, which were originally presented by Botma (1995), are proposed for computing the total frequency of events on mixed–use bicycle paths. The equations are set up for two–way bicycle paths. For the rare case of one–way mixed–use bicycle paths (i.e., a 100/0 directional split), the analyst would enter a value of zero for both the bicycle and pedestrian volumes traveling in the opposite direction of that being evaluated.
| Fpass = 3 (V ped–sm) + 0.188 (V bike–sm) |
[4] |
| F
meet = 5 (V ped–op) + 2 (V bike–op) |
[5] |
| F total = 0.5(F meet) + F pass |
[6] |
where:
F pass = frequency of passing in events/h;
F meet = frequency of meeting in events/h;
F total = total weighted frequency of events in events/h;
V ped-sm = pedestrian volume in the same direction being analyzed in ped/h;
V ped-op = bike volume in the opposite direction being analyzed in ped/h;
V bike-sm = bike volume in the same direction being analyzed in bikes/h; and
V bike-op = bike volume in the opposite direction being analyzed in bikes/h.
As in the previous section, the frequencies of meetings and passings resulting from these equations are also based on the assumption that bicycle speeds are normally distributed with a mean of 18 km/h (11.2 mi/h), and that pedestrian speeds are normally distributed with a mean of 4.5 km/h (2.8 mi/h). Slower average pedestrian speeds would cause an increase in the frequency of both passings and meetings.
The frequency of events for mixed-use paths for several different bicycle volumes and directional splits has been computed at selected pedestrian volumes for the convenience of the user. These are presented in Table 3. Alternatively, the user may utilize Equations 4 through 6 to compute the total frequency of events. Once computed, the number of events is entered in Table 4 to estimate the prevailing LOS.
TABLE 3 Total frequency of events for mixed-use paths
| Bike vol both dir (bikes/h) |
Directional split of bikes (same:opp) |
Total frequency of events (events/h)
Two-way pedestrian volumes of |
| |
|
0 (ped/h)* |
20 (ped/h)* |
40 (ped/h)* |
80 (ped/h)* |
| 100 |
30:70 |
76 |
131 |
186 |
296 |
| 100 |
40:60 |
68 |
123 |
178 |
288 |
| 100 |
50:50 |
59 |
114 |
169 |
279 |
| 100 |
60:40 |
51 |
106 |
161 |
271 |
| 100 |
70:30 |
43 |
98 |
153 |
263 |
| 200 |
30:70 |
151 |
206 |
261 |
371 |
| 200 |
40:60 |
135 |
190 |
245 |
355 |
| 200 |
50:50 |
119 |
174 |
229 |
339 |
| 200 |
60:40 |
103 |
158 |
213 |
323 |
| 200 |
70:30 |
86 |
141 |
196 |
306 |
| 400 |
30:70 |
303 |
358 |
413 |
523 |
| 400 |
40:60 |
270 |
325 |
380 |
490 |
| 400 |
50:50 |
238 |
293 |
348 |
458 |
| 400 |
60:40 |
205 |
260 |
315 |
425 |
| 400 |
70:30 |
173 |
228 |
283 |
393 |
| 800 |
30:70 |
605 |
660 |
715 |
825 |
| 800 |
40:60 |
540 |
595 |
650 |
760 |
| 800 |
50:50 |
475 |
530 |
585 |
695 |
| 800 |
60:40 |
410 |
465 |
520 |
630 |
| 800 |
70:30 |
345 |
400 |
455 |
565 |
| * 50:50 directional split assumed for pedestrians |
| SOURCE: Adapted from Botma, 1995. |
It is important to note that all the service volumes given in this section for mixed-use paths assume "ideal" geometric and traffic conditions. Lateral obstructions, extended sections with appreciable grades, and other local factors may reduce the LOS for a facility. Unfortunately, such factors have not been sufficiently documented to date to make a quantitative assessment of their effects.
TABLE 4 Bicycle Level of Service (LOS) for mixed-use paths
| LOS |
Total frequency of events (events/h) for two-lane paths (2.1- to 2.4-m paths) |
Total frequency of events (events/h) for three-lane paths (3-m paths) |
| A |
< 40 |
< 90 |
| B |
< 60 |
< 140 |
| C |
< 100 |
< 210 |
| D |
< 150 |
< 300 |
| E |
< 195 |
< 375 |
| F |
≥ 195 |
≥ 375 |
| SOURCE: Adapted from Botma, 1995. |
2.3 On-Street Bicycle Facilities
Bicycle lanes are lanes on a street designated exclusively for the use of bicycles. These lanes are separated from motor vehicle traffic by pavement markings, as illustrated in Figure 3. Bicycle lanes are normally placed on streets where bicycle use is fairly high and the separation of bicycles from motor vehicle traffic is warranted. For additional information about the planning for on-street bicycle facilities, the user is referred to a study by Harkey et al. (1998).
Paved shoulders are part of the cross section of the street, but not part of the traveled way for motor vehicles. Bicycles using paved shoulders are separated from motor vehicles by the right edge line (shoulder stripe). Paved shoulders are often constructed on new roadway facilities when allowed by right-of-way requirements.
Bicycles generally use paved shoulders as one-way facilities in the same direction as motor vehicle traffic, much like bicycle lanes. For the purpose of analysis, designated bicycle lanes and paved shoulders will be treated the same. The procedures in this section are appropriate for on-street facilities where there are significant distances between interruptions, such as traffic signals or STOP signs. See the Combined Bicycle Facility section of this document for a discussion of on-street bicycle lanes or paved shoulders with frequent interruptions.
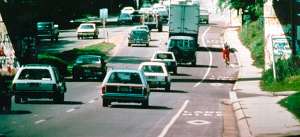 |
| FIGURE 3: Designated on-street bicycle lane |
The widths of on-street bicycle facilities vary greatly in the United States, ranging from 1.2-m (4-ft) designated bicycle lanes to 3-m- (10-ft-) wide paved shoulders. However, due to the fact that bicycles using on-street facilities can "borrow" space from the adjacent lane under low to moderate motor vehicle volumes, there are very few on-street facilities that do not operate with at least two effective lanes (allowing passing). Due to this and the fact that on-street bicycle facilities are normally provided for the exclusive use of bicycles, it is recommended that the procedures for exclusive bicycle paths presented previously in this document also be used here for on-street facilities.
It is expected that on-street bicycle lanes and paved shoulders with widths up to 1.8 m (6 ft) will operate with two effective lanes and that wider paved shoulders will operate as three effective lanes. However, heavy motor vehicle volumes, high speeds, roadway debris, or other local conditions may affect the actual width available to the bicyclists. As mentioned earlier, an observation of facility operation prior to analysis is recommended to determine the actual number of effective lanes.
One important distinction between on-street facilities and exclusive off-street facilities is the multitude of possible factors affecting LOS for on-street facilities, including adjacent motor vehicle traffic (which is often moving much faster than the bicycles), heavy vehicle traffic, commercial and residential driveways, and adjacent on-street parking. The service volumes given in this section for on-street facilities are for "ideal" conditions. The factors mentioned here, in addition to lateral obstructions, extended sections with appreciable grades, and other local factors, may reduce the LOS for a facility. Unfortunately, such factors have not been sufficiently documented to date to make a quantitative assessment of their effects. One possible approach to determining LOS for on-street bicycle facilities is to quantify the impact of prevailing geometric and traffic conditions on the average and standard deviation of bicycle speeds on the facility. Under this framework, the expectation is that friction with vehicular traffic, parked vehicles, and driveway density would result in a lower mean speed and higher standard deviation than on a comparable off-street path. To illustrate this effect, Table 5 gives the number of events and corresponding LOS for a range of bicycle volumes and average and standard deviations of bicycle speeds. As indicated in the table, the number of events
increases (and LOS drops) as speed decreases and standard deviation increases. For example, with a bicycle flow rate of 200 bicycles/h, the LOS may vary from A to E depending on the observed values of mean and standard deviation of bicycle speeds. With proper calibration of these two parameters, the proposed methodology could, therefore, be equally applied to on-street bicycle facilities. The standard deviation of speeds describes the variation in speeds about the average or mean bicycle speed for the facility. The standard deviation will be relatively smaller for those facilities used primarily by commuters, and relatively larger for recreational facilities.
TABLE 5 Effect of bicycle mean and standard deviation of speeds on events and Level of Service (LOS) for one-way, on-street bicycle facilities
| Bicycle flow rate (bike/h) |
Standard deviation a (km/h) |
Number of events and LOS |
| Bicycle mean speed (km/h) |
| 12 |
13 |
14 |
15 |
16 |
17 |
18 |
19 |
20 |
| 100 |
1.5 |
28(A) |
26(A) |
24(A) |
--- |
21(A) |
20(A) |
19(A) |
18(A) |
17(A) |
| 100 |
3.0 |
56(B) |
52(B) |
48(B) |
23(A) |
42(B) |
40(B) |
38(A) |
36(A) |
34(A) |
| 100 |
4.5 |
85(C) |
78(C) |
73(C) |
68(C) |
63(C) |
60(C) |
56(B) |
53(B) |
51(B) |
| 200 |
1.5 |
56(B) |
52(B) |
48(B) |
45(B) |
42(B) |
40(B) |
38(A) |
36(A) |
34(A) |
| 200 |
3.0 |
113(D) |
104(D) |
97(C) |
90(C) |
85(C) |
80(C) |
75(C) |
71(C) |
68(C) |
| 200 |
4.5 |
169(E) |
156(E) |
145(D) |
135(D) |
127(D) |
119(D) |
113(D) |
107(D) |
102(D) |
| 300 |
1.5 |
85(C) |
78(C) |
73(C) |
68(C) |
63(C) |
60(C) |
56(B) |
53(B) |
51(B) |
| 300 |
3.0 |
169(E) |
156(E) |
145(D) |
135(D) |
127(D) |
119(D) |
113(D) |
107(D) |
102(D) |
| 300 |
4.5 |
254(F) |
234(F) |
218(F) |
203(F) |
190(E) |
179(E) |
179(E) |
160(E) |
152(E) |
aStandard deviation of bicycle speeds. If standard deviation data are unavailable, use the following default values:
1.5 km/h for facilities used primarily by commuters
2.0 km/h for facilities used by various user types
4.5 km/h for facilities used primary by recreational users
|
| SOURCE: Adapted from Botma, 1995. |
|


