U.S. Department of Transportation
Federal Highway Administration
1200 New Jersey Avenue, SE
Washington, DC 20590
202-366-4000
Federal Highway Administration Research and Technology
Coordinating, Developing, and Delivering Highway Transportation Innovations
 |
| This report is an archived publication and may contain dated technical, contact, and link information |
|
Publication Number: FHWA-RD-98-165
Date: July 1999 |
Guidebook on Methods to Estimate Non-Motorized Travel: Overview of Methods2.0 Introduction to Non-Motorized Travel Forecasting
2.1 Dimensions of Travel BehaviorThe objective of travel demand forecasting is to predict changes in travel behavior and transportation conditions as a result of proposed transportation projects, policies, and future changes in socioeconomic and land use patterns. For non-motorized forecasting in particular, the objective is generally to predict the change in the number or characteristics of bicycle, pedestrian, or vehicle-trips as a result of facility improvements or policy changes which are designed to make bicycling or walking more attractive. In addition to affecting overall levels of non-motorized travel, changes in non-motorized travel conditions may affect travel behavior in a variety of ways:
 Figure 2.1: A High-Quality Walking Environment May Cause Changes in the Choice of Destinations
2.2 Perspectives on Modeling Travel BehaviorA variety of forecasting methods has been developed to predict changes in travel behavior. Forecasting methods are generally founded on theoretical models and then verified by empirical studies, which describe how people change their behavior in response to changes in the major factors which influence this behavior. Travel behavior, including non-motorized behavior, may be studied or modeled from two perspectives:
Each approach has its advantages and disadvantages. Aggregate-level methods tend to be relatively easy to apply, with readily available data sources and computational methods, and can be useful for sketch-planning purposes. Disaggregate-level methods are more complicated to develop but can be much more effective at predicting behavior changes. This is because they explain individual choices rather than making generalizations based on overall population characteristics.
2.3 The Four-Step Urban Transportation Planning ProcessVariations on both the aggregate and disaggregate approaches can be developed and applied as stand-alone travel demand forecasting methods, appropriate for specific purposes. Alternatively, a set of methods can be applied in conjunction with each other to create a larger modeling framework. The four-step Urban Transportation Planning Process (UTPP) (Weiner, 1997), first developed in the 1950s to forecast automobile travel and now applied in urban areas throughout the world, is an example of such a framework. To predict how travel patterns will change as a result of future changes in land use patterns and the transportation system, this framework integrates models of various aspects of travel behavior (e.g., trip-making or mode choice) with spatial information on land use patterns and the transportation network. The UTPP is important to understand because it is widely used in transportation planning and because of its potential for integrating bicycle and pedestrian with automobile and transit travel forecasting. The basis for UTPP models is the division of the urban area into traffic analysis zones (TAZs), which may correspond to census tracts, and the definition of a network of transportation facilities connecting the zones (figure 2.1). The network is described by the time and cost of travel, for each mode, between each pair of zones. Inputs include proposed future transportation networks and forecast population and employment characteristics by zone. A four-step process is then used to forecast travel: 1. Trip generation - Total trips generated by persons that start and end in each zone are predicted, based on the population, employment, household characteristics, etc., of the zone; 2. Trip distribution - The trips are distributed among pairs of zones, usually based on a gravity model which distributes trips in inverse proportion to the distance between zones; 3. Mode choice - The trips are allocated among the available travel modes, based on relative characteristics (usually time and cost) of the modes; and 4. Network assignment - The trips are assigned to specific links (road segments) in the transportation network, generally based on the shortest time path between two zones. The different stages of the process may include both aggregate and disaggregate behavior models. In addition, these models have sometimes been modified to incorporate additional travel behavior factors, such as feedback from later steps to earlier steps (e.g., congestion influencing trip generation and mode choice) or variations in travel by time of day. The UTPP framework has primarily been applied to automobiles and transit but is increasingly being modified to include bicycles and pedestrians. Non-motorized modes can be incorporated in the models in various ways. For example, a bicycle or pedestrian network can be defined. Bicycling and walking can be included as modes in the mode choice model. The advantages and limitations of this framework for modeling non-motorized travel are discussed more fully under the specific entries on "Regional Travel Models"in Section 3.0 and in the Supporting Documentation.
2.4 Factors Specifically Influencing Bicycling and WalkingStandard travel demand modeling procedures generally predict total trip-making and mode choice based on a limited number of variables, such as household characteristics and the time and cost of competing modes. These factors, however, only partially explain the decision to bicycle or walk. Development of non-motorized travel forecasting methods requires consideration of a range of factors specific to non-motorized modes. From an individual perspective, personal factors, environmental factors, and trip characteristics interact to determine whether a trip is made by bicycle, foot, or other mode. The specific factors which are important vary depending on whether the mode being discussed is bicycling or walking. If behavior studies are performed from an aggregate-level perspective, factors must be identified which proxy for the personal and environmental factors seen from the individual's perspective. For example, median income of an area may represent household income, or average vehicle travel speeds and parking costs in a city may serve as a proxy for the time and cost of travel by automobile for a particular trip. Figure 2.2 presents a framework for how a general set of factors, including facility design factors, interact to affect non-motorized travel levels, both overall and for specific facilities (links) in a network. These factors are described in table 2.1. Regardless of whether models are developed at the disaggregate or aggregate level, it is important to remember that decision making ultimately occurs at the individual level and that a forecasting procedure should approximate the individual decision-making process as closely as possible. 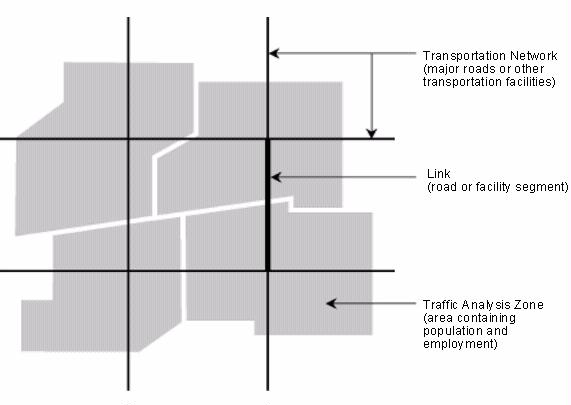 Figure 2.2: Structure of Regional Travel Model
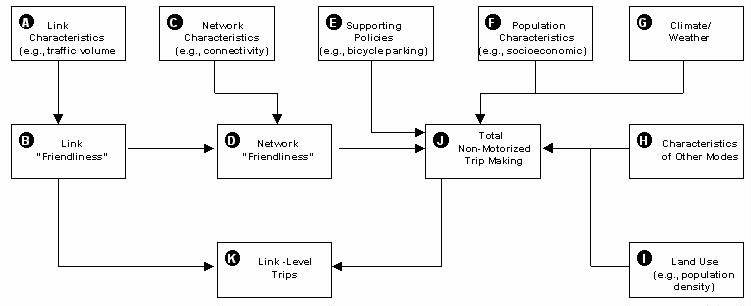 Figure 2.3: Relationship of Factors Influencing Non-Motorized Travel
Table 2.1 - Description of Factors Influencing Non-Motorized Travel.
Finally, it should be kept in mind that the factors shown in table 2.1 may influence an individual's travel behavior decisions at a variety of stages, not just on a trip-by-trip basis. For example, the individual must first decide to even consider bicycling or walking as a viable travel option. Only when this is done does the question of whether to bicycle or walk for a particular trip become relevant.
2.5 Differences in Forecasting Bicycle vs. Pedestrian TravelBicycle and pedestrian travel are collectively referred to throughout this guidebook as non-motorized travel, and each class of forecasting methods discussed is generically applicable to both. Nevertheless, significant differences exist between the two modes, both in terms of travel characteristics and factors influencing the decision process. These differences are apparent in the specific examples of the methods, most of which were developed for either bicycles or pedestrians, as discussed in the supporting documentation of this guidebook. Some of the most significant differences include: Pedestrian trips are generally shorter than bicycle trips. This is important because appropriate analysis methods may depend on the spatial scale of analysis. For example, an analysis of pedestrian conditions may consider every block in a small area, while an analysis of bicycle conditions may focus on through bicycle routes. A large percentage of pedestrian trips are actually trips to access other modes, including the automobile or transit. Bicycle trips, in contrast, are primarily stand-alone trips (although bicycle access to transit is an important type of non-motorized travel). Therefore, local pedestrian travel will largely result from automobile and transit trips rather than replacing these trips, and modeling transit vs. auto mode choice will be relevant to predicting pedestrian travel. Conversely, pedestrian access factors will be important in predicting transit vs. auto mode choice, since the quality of the environment for walking may influence the decision to use transit. Perhaps most significantly, the decision to ride a bicycle involves a greater conceptual leap than the decision to walk. Everyone is a pedestrian, but not everyone is a bicyclist. Insights from the public health and social marketing fields suggest that the decision to even consider riding a bicycle is a multi-staged process involving a variety of interacting personal, social, and environmental factors. The choice to bicycle for a particular trip depends not only on the specific characteristics of that trip but on the individual's attitude toward and willingness to bicycle. While attitudinal research gives important insights into pedestrian and transit travel choices as well, its implications are perhaps most significant for bicycle travel.
FHWA-RD-98-165 |

