U.S. Department of Transportation
Federal Highway Administration
1200 New Jersey Avenue, SE
Washington, DC 20590
202-366-4000
Federal Highway Administration Research and Technology
Coordinating, Developing, and Delivering Highway Transportation Innovations
 |
| This report is an archived publication and may contain dated technical, contact, and link information |
|
Publication Number: FHWA-RD-98-166
Date: July 1999 |
Guidebook on Methods to Estimate Non-Motorized Travel: Supporting Documentation2.10 Bicycle Travel Models: START and TRIPS
Categories: Authors and Development Dates: MVA (1995) Purpose: MVA, a British consulting firm, has developed two separate models that include non-motorized travel: 1. START, a mode choice model that includes both bicycling and walking as options. 2. TRIPS, a network model package that includes a bicycle network option called MVCycle. START is an incremental model that uses the best available representation of existing travel patterns (trips by origin/destination and mode), combined with changes in the time and monetary cost of travel to predict future travel patterns. The zonal and network structure of the MVCycle network model is based on the TRIPS road and public transport models for the region. The primary purpose of the model is to distribute future bicycle trips given a network of existing and proposed roads and bicycle facilities, and to identify major points of conflict between potential bicycle flows and existing heavy traffic flows. The current version of the model does not predict overall bicycling volumes as a result of network improvements; rather, it evaluates the network distribution of trips under an assumed overall future level of bicycling. Structure: The representation of transport supply in the START mode choice model is not very detailed, on the order of 50 zones for a regional model (compared with several hundred for a typical travel model), so considerable attention is given to modeling intrazonal as well as interzonal movements. Bicycling and walking are currently considered by entering exogenously generated changes to travel time/cost. In addition, intrazonal demand is segmented into trips above and below walking distance. Currently, zonal mode shares for each mode as determined from START can be used as inputs in developing trip tables for the TRIP model. Feedback from changes in bicycle costs based on changes in network characteristics from TRIPS can be performed manually, although costs from the TRIP model must be summarized in an aggregate format compatible with the START model zonal structure. In the future, linkages of bicycle costs are expected to be developed between the TRIPS network and the START model. The development of the bicycle network model for TRIPS consists of the following steps: 1. Development of base-year and future-year networks of bicycle facilities. 2. Development of base-year bicycle trip tables. 3. Assignment of base-year bicycle trips to the bicycle network. 4. Re-estimation of bicycle trip tables based on actual roadway counts. 5. Factoring of base-year trip tables to develop future-year trip tables. 6. Assignment of future-year trips to the future-year bicycle network. The approaches used for each step are described below. The network is evaluated separately under p.m.-peak hour and off-peak trip levels. 1. Development of base-year and future-year networks of bicycle facilities. The bicycle network is constructed using the TRIPS software package and is a modified version of the road network for the road traffic model. The network is set up to exclude motorways and to include bus lanes, pedestrian zones, off-road bicycle facilities, and other modifications as appropriate to describe the network likely to be used by cyclists. Different bicycle travel speeds are established for five different types of links (for example, 20 km/h for roads shared with motor vehicles and five km/h for walk links). Link speeds can also be modified on a link-specific basis for other factors which may affect travel speed, such as topography or frequent intersections. Also, the interaction between bicycling and public transport can be modeled by allowing carriage of bicycles on trains (i.e., including rail links in the bicycle network) and/or bicycle park-and-ride at rail stations. 2. Development of base-year bicycle trip tables. Base-year bicycle trip tables can be constructed through different methods. The method applied by the MVA to Leicester consists of the following steps: a. The car and public transit trip tables from the road and transit models were used to construct total person trip tables (bicycle and walk trip tables were not available from these models); b. A bicycle trip length distribution was developed from the local household travel survey, with trip times converted to distances using a sliding scale from 10 to 20 km/h (longer trips are assumed to be ridden by faster cyclists); c. The trip length distribution of motorized journeys was constructed, and total motorized trips were re-allocated among distance bands to so that the proportion of trips by distance band was the same as the actual proportion of bicycle trips by distance band. d. Bicycle matrices were derived from the re-allocated motorized trip matrices based on the results of the home interview survey showing that bicycle trips were 2.62 percent of motorized trips. 3. Assignment of base-year bicycle trips to the bicycle network. Bicycle trips can be assigned to the network either by the least-cost method or by using a probability model driven by the difference in cost (travel time) between alternative paths and the least-cost path. The rationale for using the probability model, rather than a simple least-cost assignment, is to "better simulate the tendency of cyclists to use alternative routes to fast and/or busy roads." The effect of motor vehicle traffic congestion on cyclists can also be evaluated by assuming that link travel time for cyclists is increased by one-third of the increase in auto travel time caused by congestion. Finally, the model allows volume and speed of traffic on each link to be used to develop travel time penalties reflecting their disutility for cyclists, although this was not done for the Leicester model. 4. Re-estimation of bicycle trip tables based on actual roadway counts. The base-year assigned travel trips were compared with actual field counts of cyclists, and the bicycle trip matrices were modified so that assigned trips more closely matched actual counts. 5. Factoring of base-year trip tables to develop future-year trip tables. In the Leicester study, the base-year trip tables were factored under the assumption that in the forecast-year bicycling would represent 12 percent of all trips. The model is intended to represent a scenario "in which measures to encourage bicycling have substantially overcome the safety/qualitative obstacles to bicycling that exist today." It would also be possible to use results from the START model mode choice assignment, or from other sources, to estimate future bicycling levels for the purpose of factoring trip tables. 6. Assignment of future-year trips to the future-year bicycle network. The factored future-year trip tables are assigned to the future-year bicycle network. This step produces potential future flows on each network link, and can be used to identify major points of conflict between bicycle flows and existing heavy traffic flows. Calibration/Validation Approach: Calibration is performed using counts of actual bicycle traffic and standard mathematical calibration techniques. Inputs/Data Needs: The following data on travel patterns were used: 1. Auto and transit trip tables from the local road and transit models. 2. Census work-trip origin/destination data at the ward level. 3. Local home interview travel survey data. In addition, counts of actual bicycle traffic were used for model calibration. A basic bicycle network can be constructed from the existing road network used for modeling purposes. Modification of this network requires some additional data collection on link characteristics relevant to cyclists. Potential Data Sources: See above. Computational Requirements: The model consists of proprietary software which can be run on a personal microcomputer. User Skill/Knowledge: A knowledge of travel modeling techniques is required. Assumptions: The model has not been used to forecast levels of bicycling as a result of network improvements. Instead, current bicycle trip distributions are increased by a uniform factor which represents an assumed future level of bicycling, under ideal conditions. Facility Design Factors: Network assignment is based on travel time, for which speeds can be varied by link. Therefore, the model is capable of evaluating the route choice (but not mode choice) impacts of modifications to an existing facility which increase travel speed, as well as the creation of a new facility. An example of the former might be construction of a bicycle-only facility parallel to a shared bicycle/pedestrian path, or elimination of traffic conflict points along a road with a bike path. The model also contains relationships which factor the link travel time so as to represent the perceived effect of volume and speed of traffic on the attractiveness of each link to cyclists. This factoring involves subjective estimates of the tradeoffs assigned by cyclists to travel time vs. route factors (volume, speed). Link travel times could also conceivably be factored based on other link attributes such as pavement quality, environmental quality, etc. Development of such factors may benefit from the development of route choice models using stated-preference survey techniques, which can be used to quantitatively estimate tradeoffs between travel time and other factors. Output Types: The output of the START model includes forecast mode shares by zone. The output of the MVCycle model includes forecast p.m.-peak and off-peak bicycle flows by facility/link. 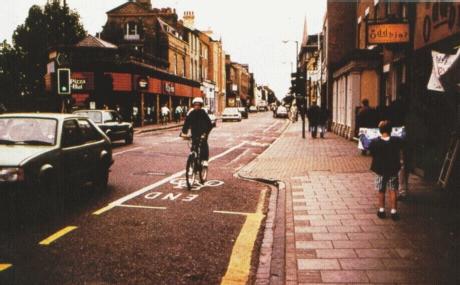 Figure 2.10 A bicycle lane that ends before an intersection. Real-World Examples: The bicycle model has been applied in Leicester, England (see MVA, 1995). Contacts/Source: MVA of Manchester, UK, has developed the TRIPS suite of programs for travel modeling, including START for travel demand forecasting and MVCYCLE for route choice for cyclists. Contact Rosemary Sharples at MVA, 26th Floor, Sunley Tower, Piccadilly Plaza, Manchester, M1 4BT, United Kingdom. Publications: MVA, Leicester Bicycle Model Study, Final Report, prepared for Leicestershire County Council, Contract No. 02/C/1428, October 1995. Evaluative Criteria: How Does It Work? Performance: No information is available. Use of Existing Resources: This approach builds on existing travel modeling efforts, and primarily utilizes existing data on travel behavior which must be collected for these efforts. Collection of additional bicycle count data is required, as is modification of the road network to include bicycle facilities and characteristics. The resources required for network modification and conducting bicycle counts increase in proportion to the accuracy desired for modeling purposes and the size of the network to be modeled. Travel Demand Model Integration: The START and TRIPS model structures for cyclists are based on the existing structures of these models for evaluating automobile and transit travel. START integrates bicycling into the mode choice model, although trip generation characteristics and changes in generalized travel cost for all modes must be developed exogenously. The bicycle network model in TRIPS uses both trip-making and network data from the auto and transit networks but as of yet does not feed generalized cost information from the bicycle network into trip generation or mode choice. Applicability to Diverse Conditions: Trip data and the network model must be developed specifically for the area being modeled. Once the model system is developed, proposed modifications to the local network can be tested. Usage in Decision-Making: Not evaluated. Ability to Incorporate Changes: Trip data and the network model must be developed specifically for the area being modeled. Once the model system is developed, proposed modifications to the local network can be tested. Ease-of-Use: Not evaluated. The latest version of TRIPS runs in a Windows environment. Comments: The following improvements have been proposed for future efforts: 1. Decreasing zone sizes for the bicycle network, and evaluating other methods of constructing trip matrices. 2. Incorporation of junction modeling to more accurately model traffic delay and evaluate the effects of bicycle priority measures at junctions. 3. Combining road traffic and bicycle assignments, i.e., assigning bicycle, auto, and transit trips simultaneously. This model bears many similarities to the QUOVADIS bicycle model (described in section 2.9) in terms of its purpose and structure. Primary differences include the methods used to estimate the base bicycle trip table; the segmentation of trips by purpose and time of day in QUOVADIS; ability to incorporate link-specific travel speeds in TRIPS; the treatment of intersection delay in QUOVADIS; and the ability of QUOVADIS to track accident statistics and calculate accessibility and safety measures. However, TRIPS has advanced recently by integrating mode choice into the modeling process.
FHWA-RD-98-166 |

