U.S. Department of Transportation
Federal Highway Administration
1200 New Jersey Avenue, SE
Washington, DC 20590
202-366-4000
Federal Highway Administration Research and Technology
Coordinating, Developing, and Delivering Highway Transportation Innovations
 |
| This report is an archived publication and may contain dated technical, contact, and link information |
|
Publication Number: FHWA-RD-98-166
Date: July 1999 |
Guidebook on Methods to Estimate Non-Motorized Travel: Supporting Documentation2.15 Bicycle Compatibility Measures
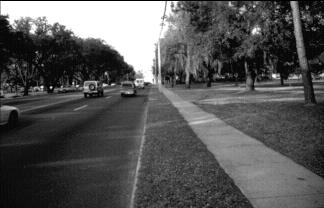
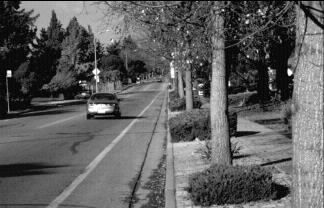
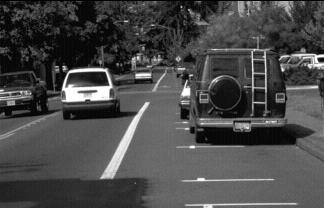
Descriptive Criteria: What is It? Categories: Authors and Development Dates: Mozer (1994); Sorton and Walsh (1994); Dixon (1995); Federal Highway Administration (1998) Purpose: Bicycle compatibility measures, including stress-level and level-of-service indicators, measure the suitability of roadways for bicycle travel. These methods describe current bicycling conditions rather than forecasting potential demand. The measures combine factors such as motor vehicle traffic volume and speeds, lane width, and pavement quality into an index of overall suitability for travel. Sorton and Walsh (1994) developed a method to determine the "stress level" for bicyclists as a function of roadway characteristics. The authors used three primary traffic variables in relation to different bicyclist skill levels. The primary traffic variables were peak-hour volume, curb-lane speed and curb-lane width; the bicyclist categories included child, youth, casual and experienced, although the authors do not recommend using the "child" category in analyses. Mozer (1994) developed an LOS measure referred to as "Pedestrian, Bicycle, Auto, Transit Level of Access" (P-BAT LOA). The purpose was to establish a multimodal level of service measure as an alternative to traditional LOS measures, which do not consider bicycle, pedestrian or transit modes. The Federal Highway Administration (1998) developed a bicycle compatibility index (BCI) to describe the compatibility of a facility for bicycling. The BCI uses a formula based on traffic volume, speed, lane width, and other indicators of bicyclist stress to rank a road segment for compatibility for bicycling, which is then equated to a level of service (LOS) rating. The BCI was developed for mid-block locations that exclude intersections to help planners evaluate the quality of existing facilities. Qualitative adjustment factors were developed to consider instances of high volumes of trucks or buses, right-turning vehicles and vehicles turning into and out of driveways. The BCI is intended to be used for operational evaluation, design, and planning. The BCI is partially based on the bicycle level of service measures developed by Sorton and Walsh (1994) and Mozer (1994), as described above. Structure: Sorton/Walsh: The following three-step process was developed to determine bicycle stress levels. 1. Select significant roadway variables that affect bicycle use. 2. Evaluate all street segments for bicycle use pertaining to these variables. 3. Analyze and rank the improvements needed for each street segment addressing the cost, political feasibility, and type of upgrade needed. Improvements should be selected after comparing the overall average stress level with the bicyclist type. The following secondary variables were used to compare the bicycle compatibility of candidate streets:
Note that the procedure should identify corridors or streets that have the highest potential for bicycle travel. Mozer: To determine the level-of-access of street segments for bicycle use, this method uses three primary factors: outside-lane width, outside-lane speeds, and outside-lane volume, and four secondary factors: quantity of bicycle traffic using a width-bicycle volume factor, volume of heavy vehicle traffic, outside-lane penetrations, and on-street parking.
FHWA: For the development of the BCI, eight independent variables related to bicyclists' comfort levels were selected along with three variables that should be considered as an adjustment factor. These variables were combined to develop the BCI as follows:
The BCI is then converted into a level of service measure on a scale of A through F, where A represents "extremely high" compatibility and F represents "extremely low" compatibility. Calibration/Validation Approach: Sorton/Walsh: The city of Madison, WI conducted a survey to validate the bicycle stress level for city streets. The primary variables (i.e., motor vehicle peak-hour volumes, curb-lane speed and curb-lane width) were studied using videotaping of selected road segments. Sixty-one survey participants were asked demographic questions and then rated specific primary variables using the video clips for each road segment. The proposed stress levels for each primary variable were then adjusted to reflect the participants' responses. Mozer: No calibration or validation approach was mentioned. FHWA: The BCI was validated using a video methodology that is similar to Sorton and Walsh but using a more comprehensive approach. The video survey interviewed 202 participants in Olympia, WA; Austin, TX; and Chapel Hill, NC. The participants were asked to rank their comfort level as bicyclists considering traffic volume, speed, and width for a variety of videotaped locations. Inputs/Data Needs: Sorton/Walsh: The three primary inputs include motor vehicle volumes, motor vehicle speed, and curb-lane widths. Mozer: Like Sorton/Walsh, the three primary inputs include outside-lane volumes, outside-lane speeds, and outside-lane widths. FHWA: The analysis uses the following inputs to create the BCI: bicycle-lane width, curb-lane width, curb- and other-lane volumes, motor vehicle speeds, type of roadside development, large truck volumes, motor vehicle parking turnover, and right-turn volume. Potential Data Sources: Sorton/Walsh: In addition, the following secondary variables could be used to compare the bicycle compatibility of candidate streets: the number of commercial driveways per mile; parking turnover; and the percentage of heavy vehicles such as trucks, buses, and recreational vehicles. Mozer: The following secondary variables are used: quantity of bicycle traffic (per width of outside lane), volume of heavy vehicle traffic (using the same percentage by road segment as Sorton/Walsh), outside-lane penetration (based on number of turning movements), and on-street parking turnover. FHWA: Some data required for the index may exist in local or state facility inventories or may already have been collected for local traffic impact studies. Additional field data collection may be required. Computational Requirements: Minimal computational requirements are needed. User Skill/Knowledge: An understanding of standard traffic data sources and collection methodologies is required. Assumptions: In general, this type of method assumes that the compatibility of the facility is adequately described by the specified factors. In practice, different individuals will assign different levels of importance to each of the factors. Also, this method only describes continuous mid-block segments and does not describe the overall compatibility of a route that includes intersections as well as segments with different characteristics. Sorton/Walsh and Mozer: The authors assume that bicyclists want to reduce their mental stress so they will choose streets with lower volumes, speeds, and curb-lane widths. Bicyclists with different skill levels will vary in their desire to minimize their stress level. The proposed stress-level rating of one through five reflects this since each level has different interpretations of acceptability for different types of users. Facility Design Factors: Sorton/Walsh: This method focuses on the facility design using volume, speed, and curb-lane width as the primary variables. The secondary variables are the number of commercial driveways per mile, parking turnover, and the percentage of heavy vehicles. Mozer: This method uses the same primary factors as Sorton/Walsh. The secondary variables differ yet still focus on the physical environment, such as the quantity of bicycle traffic, vehicle turning movements, heavy vehicle volumes, and on-street parking. FHWA: The method uses the same facility design factors as Sorton/Walsh but also includes the presence of bicycle lanes. The secondary variables include the number of driveways, parking turnover, percentage of heavy vehicles, and number of right-turning vehicles. Output Types: Sorton/Walsh: Each primary factor (motor vehicle volume, lane width, and traffic speed) is rated with a stress level of one to five. These are averaged to produce an overall stress level. Mozer: Like the Sorton/Walsh method, each primary factor is rated with a stress level, and these factors are averaged. FHWA: Each roadway segment receives a numeric BCI score, which is then converted to an A through F level-of-service measure.
Real-World Examples: Sorton/Walsh: In 1995, Slade McCalip of Orange County, NC, used this method to determine the suitability of their planned bicycle routes. Dixon (1995) developed a bicycle level of service measure for use in the Gainesville Mobility Plan Prototype, which is the draft Congestion Management System plan for Gainesville, Florida. The LOS combines the bicycle performance measures researched by Epperson/Davis and Sorton/Walsh and the specific needs of the plan. The combined approach provided the jurisdiction with a measure that considers not only on-street facilities but also off-street projects. The corridor segments with low-LOS ratings (i.e., LOS E or F) tended to correspond with the Gainesville Urban Area Bicycle Advisory Board list of priority projects. FHWA: This report used videotaping to capture images from roadway segments, which is similar to the Sorton/Walsh method. Contacts/Source: David Harkey, Donald Reinfurt, Matthew Knuiman, J. Richard Stewart, and Alex Sorton (authors), University of North Carolina, Highway Safety Research Center, 730 Airport Road, CB #3430, Chapel Hill, NC 27599. David Mozer, Calculating Multi-Mode Levels-of-Service, International Bicycle Fund, http://www.halcyon.com/fkroger/bike/los.htm. Alex Sorton, Transportation Engineering Division, Northwestern University Traffic Institute, 405 Church St., Evanston, IL, 60208. Thomas Walsh, Madison Department of Transportation, 215 Martin Luther King, Jr. Boulevard, Madison, WI, 53701-2986. Publications: Dixon, Linda, Adopting Corridor-Specific Performance Measures for Bicycle and Pedestrian Level of Service, Transportation Planning, Volume XXII, No. 2, Summer 1995. Federal Highway Administration. Development of the Bicycle Compatibility Index: A Level-of-Service Concept, Volume I: Final Report. Publication No. FHWA-RD-98-072, U.S. Department of Transportation, FHWA, McLean, Virginia, August 1998. Mozer, David, Calculating Multi-Mode Levels-of-Service, International Bicycle Fund, http://www.halcyon.com/fkroger/bike/los.htm, 1994. Sorton, Alex and Thomas Walsh, Bicycle Stress Level as a Tool To Evaluate Urban and Suburban Bicycle Compatibility, Transportation Research Record 1438, 1994. Evaluative Criteria: How Does It Work? Performance: Sorton/Walsh: The method is easy to use. Although it does not mention pavement condition factors, pavement condition seems to play an important role for cyclists' ability to ride predictably without trying to avoid cracks, potholes, utility covers, etc. Mozer: The method is similar to Sorton/Walsh. The web page information is not well written nor comprehensive. The Sorton/Walsh method seems to be better researched. FHWA: The method is a compilation of several approaches, mainly Sorton/Walsh. Although the method is new and lacks real world examples, it is the most comprehensive of all the bicycle facility methods that analyze supply and has been validated through surveys of bicyclists. Use of Existing Resources: Sorton/Walsh and Mozer: The methods use peak-hour or daily traffic counts, motor vehicle speeds, and curb-lane widths on the respective streets as well as parking turnover rates, heavy vehicle volumes, and the number of driveways. FHWA: The method uses peak-hour or daily traffic counts, motor vehicle speeds, and curb-lane widths on the respective streets as well as parking turnover rates, heavy vehicle volumes, and number of right-turning vehicles. Some of these data may be obtained from local traffic data bases or previous traffic studies, while others may require additional field data collection efforts. The method also requires an inventory of existing bike lanes. Travel Demand Model Integration: The methods have not been designed to be integrated with travel demand models. Applicability to Diverse Conditions: Sorton/Walsh: The research does not include roadways with bicycle lanes. The authors believe that the speed and width variables would drop for comparable streets that had bicycle lanes. For example, a street with a bicycle lane would not require as large a curb-lane width as a similar street without bike lanes. Mozer: The method focuses on bicycle lanes and is not sufficient for bicycle paths. FHWA: The method allows for analysis of roadways with bike lanes. Usage in Decision-Making: The methods describe current conditions for bicycling and can be used to prioritize facilities or specific facility design treatments. Ability to Incorporate Changes: The formulas are set up in a modular fashion making it easy to revise various components. Ease-of-Use: Sorton/Walsh: Orange County, NC, found the method easy to use. FHWA: The inputs and procedures are not complex, and the BCI descriptions are easy to follow. Comments: Two previous attempts to gauge the "bicycle friendliness" of a roadway include: 1. The Bicycle Safety Index Rating (BSIR) developed by Jeff Davis in 1987, addresses many of the same factors as the BCI, but is based on the subjective opinions of the surveyors (rather than objectively measurable statistics) and does not weight the relative importance of different factors. BSIR, in a slightly modified form, is also known as the Roadway Condition Index (RCI); see Horowitz (1996). 2. The Bicycle Interaction Hazard Score (IHS), developed in 1994 by Bruce Landis, was designed to employ more objectivity in assigning values to different conditions as well as addressing a greater number of conditions (Landis, 1994). Two additional authors have discussed attempts to determine roadway suitability for bicyclists. Eddy (1996) discusses how a suitability study might be done. Epperson (1994) presents a brief history of approaches to determining bicycle LOS. John Forester's comment about Sorton's (and similar) methods: "These systems are not only scientifically erroneous, they are politically dangerous. That is, they emphasize the wrong things to produce a politically popular but scientifically erroneous plan that merely aggravates the existing situation in which people are unduly frightened of the most minor of conditions and don't pay attention to those which are much more important. The effect is to instill in the public to an even greater extent the exaggerated fear of bicycling in same-direction traffic and thereby jeopardize both safe and efficient bicycling and our rights to do it." (http://www.johnforester.com) Forester feels that the only factor to consider would be pavement condition. On an Internet discussion list, other respondents on this topic mentioned the need for more focus on the following: (1) pavement conditions; (2) intersection density; (3) intersection volume; and (4) visual clutter such as signs, bus benches, and traffic control boxes.
FHWA-RD-98-166 |
|||||||||||||||||||||||||||||||||||||||||||||