Note: The 2003 Performance and Accountability Report is now on-line.
CONTENTS
Letter from the Administrator
Program Accomplishments
Financial Highlights
Performance Measures
Acronyms
FHWA Offices
NOTICE
This document is disseminated by the Federal Highway Administration in the interest of information exchange. The United States Government assumes no liability for its contents or use.
I am proud to share with you the recent progress that the Federal Highway Administration (FHWA) and its partners have made towards achieving our national goals. The program and financial highlights discussed in this Report represent demonstrable advances towards meeting the objectives that were outlined in the FHWA fiscal year (FY) 2002 Performance Plan.
Measurable progress in meeting our performance targets is reported. Activities and projects that produce the desired performance results are described. This Report serves as a complement to Moving America in the New Millennium, the first such report by the United States Department of Transportation that consolidates financial management and performance reporting for FY 2002.
In my FY 2002 Accountability Contract with Transportation Secretary Mineta, I pledged to steer Agency efforts towards achieving the following program priorities as the Federal Highway Administrator:
These are ambitious challenges that will require the cooperation of government at all levels and the support of all Americans to achieve. As this Report demonstrates, the FHWA plays a unique and important leadership role in this national effort.
Recently, we took further steps to focus our efforts during the coming year on achieving a Vital Few priorities, namely improving highway safety, congestion mitigation, and environmental stewardship and streamlining. I hope to report significant progress in these areas in FY 2003.
I encourage you to contact us if you have ideas or suggestions as to how we can improve upon our performance.
|
Sincerely,
Mary E. Peters |
As outlined in the fiscal year (FY) 2002 Performance Plan, the Federal Highway Administration (FHWA) has six strategic goals-Safety, Mobility, Productivity, Human and Natural Environment, National Security, and Organizational Excellence. In this section of the Report, our progress in achieving these goals is discussed. Additional information about the performance measures discussed herein is provided in the footnotes to each table and in the Performance Measures section beginning on page 23. Unless otherwise noted, calendar year data are reported. Highway fatalities 1.6 1.6
The rate of fatalities and injured persons in traffic-related crashes continued to decline in 2001 to 1.5 and 109 per hundred million vehicle miles traveled, respectively. The total number of injured persons declined to 3.033 million, a level not seen since 1992. However, traffic related fatalities exceeded 42,000 for the first time since 1996.
| Safety | 1998 | 1999 | 2000 | 2001 | 2002 | Target |
|---|---|---|---|---|---|---|
| Highway fatalities | 41,501 | 41,717 | 41,945 | 42,116 | See Note Below | 39,800 |
| Highway fatality rat, as fatalities per 100 million vehicle miles traveled | 1.6 | 1.6 | 1.5 | 1.5 | ||
| Highway Injuries, in thousands | 3,192 | 3,236 | 3,189 | 3,033 | 3,123 | |
| Highway injury rate, as injured persons per 100 million vehicle miles traveled | 131 | 120 | 116 | 109 |
Note: FY2002 fatality and injury data will be available in mid-2003.
Safely getting people where they need to go continues to be FHWA's top priority. To reduce highway-related crashes, injuries, and deaths, FHWA is focusing on preventing the most frequent types of fatal crashes. About 38 percent of all highway-related fatalities occur in roadway departure crashes, 20 percent occur in crashes in or near an intersection, and another 11 percent are pedestrians involved in a crash.
Highly visible roadway markings and signs, along with warning systems, can help a driver stay within their lane and avoid a roadway departure crash. During the past year, FHWA encouraged States to install rumble strips to 3 reduce these types of crashes. The agency issued an advisory for the design and installation of shoulder rumble strips and guidelines for their use on appropriate rural segments of the National Highway System (NHS). In Mississippi, different rumble strip designs were combined with pavement marking overlays and tested on rural roads.
A marking or sign with a retroreflective covering or sheeting appears much brighter and is more visible to a driver at night. To assess the visibility of retroreflective pavement markings and raised pavement markers, a simulation experiment and a field validation test were completed. The test results suggest that a greater amount of pavement marking degradation could take place when pavement markers are used.
Tests were initiated in several jurisdictions in Mississippi and Connecticut to demonstrate how speed limits should be set. During these tests, local highway authorities worked with police to demonstrate that when speed limits are appropriately set based on traffic and roadway conditions, they are able to focus on and issue citations only to motorists exceeding the revised limits. As part of these tests, citizens were advised of the revised speed limits and enforcement program.
FHWA and the States Continue to Focus on Highway Work Zone SafetyOver the past 5 years, an average of 880 persons died annually in crashes in work zones. To help highway officials address this problem, FHWA released a guide to work zone management practices that minimize driver and worker exposure in construction and maintenance work zones. Informing motorists of the dangers is another important part of FHWA's strategy. As part of Work Zone Safety Awareness Week in April, staff from the FHWA Virginia Division and the Virginia Department of Transportation hosted a Safety Break event at 10 highway rest areas. Also, FHWA co-sponsored a workshop on Making Work Zones Work Better with the Maryland State Highway Administration and the North Carolina Department of Transportation. Officials who participated learned about practices, technologies, and products that are effective and discussed their own ideas for reducing work zone fatalities. |
A national agenda for intersection safety was developed in cooperation with the Institute of Transportation Engineers (ITE) and the American Association of State Highway and Transportation Officials (AASHTO). FHWA sponsored a study of the safety effectiveness of left turn and right turn lanes for at-grade intersections, which included 280 intersection improvement projects. An informational CD, Red Light-Green Light, was produced to inform the public, especially children ages 6-12 years old, about intersection safety.
A Bicycle Safety Education Resource Center was developed that provides bicycle safety information for bicyclists of all ages, motorists, and those who teach children to ride. The Internet-based Center contains a database of 4 training materials, a guide to help interested parties identify the training needs of their audience, and information to assist in developing new safety programs.
FHWA continued to develop technologies that enhance the safety of roads, vehicles and highway users. The Interactive Highway Safety Design Model (IHSDM) is a suite of software tools that highway designers can use to assess the safety effects of specific geometric design decisions. A test of an IHSDM module that predicts the safety performance of rural two-lane highway was initiated. Tests of crash prediction models for intersections were also completed.
Pavement condition on the NHS remained the same between 2000 and 2001, with ride quality at 90.9 percent. The percent of deck area on bridges rated deficient declined to 28.6 and 30.7 percent on NHS and non-NHS bridges, respectively. However, targeted levels for improvement were not met.
Despite the efforts of FHWA and our partners, traffic congestion continued to worsen in major metropolitan areas. The percent of travel nationwide that is congested increased at a rate higher than anticipated in FY 2001. At 33.8 percent, it was 0.2 percent above the projected increase to 33.6 percent and 0.4 percent above the targeted level. There was also an increase in the percent additional travel time for a trip and the annual hours of driver delay. This increase occurred despite continued progress in deploying Intelligent Transportation Systems in major metropolitan areas.
| Mobility and Productivity | 1998 | 1999 | 2000 | 2001 | 2002 | Target |
|---|---|---|---|---|---|---|
| National Highway System (NHS) pavement condition, as percent of vehicle-miles-traveled with acceptable ride quality | 89.9 | 90.5 | 90.9 | 90.9 | See Note A. | 92.0 |
| National Highway System (NHS) bridge condition, as percent of deck area on bridges that is deficient, for all average daily traffic | 32.6 | 31.9 | 30.8 | 30.6 | 29.9 | 28.6 |
| Non-NHS bridge condition, as percent of deck area on bridges that is deficient, for all average daily traffic | 32.5 | 32.0 | 32.6 | 32.3 | 31.9 | 30.7 |
| Overall user satisfaction, as percent of total respondents (*) | - | - | 66 | - | See Note B. | 70 |
| Highway congestion, as percent of congested travel | 32.1 | 32.6 | 33.1 | 33.8 | See Note C. | 33.7 (projected at 33.9) |
| Highway congestion, as percent of additional travel time | 47.0 | 49.0 | 51.0 | 53.0 | See Note C. | |
| Highway congestion, as annual hours of delay | 29.1 | 30.6 | 31.9 | 32.0 | See Note C. | 32.2 |
(*) This measure is not included in the FY 2003 Performance Plan.
Note A: Pavement condition data for FY 2002 is not available until the fall of 2003.
Note B: This survey will be conducted again in 2003.
Note C. FY 2002 data is not available until the fall of 2003.
FHWA focuses on ensuring that pavements are safe, cost effective, long lasting, and require less maintenance by promoting enhanced preventive maintenance management systems and improved pavement preservation technology. Working with the States, the agency developed standards for pavement smoothness during highway construction, which are being considered by AASHTO as provisional standards. FHWA also published reports on hot-mixed asphalt pavements and Portland Concrete Cement pavements that highlight preferred measurement and construction practices to improve pavement smoothness.
Only a small percentage of the approximately 590,000 highway bridges are structurally deficient. Still, drivers in the United States cross deficient bridges more than one billion times each day. Last year, FHWA took several steps to improve the condition of the Nation's bridges.
By allowing States to use Highway Bridge Replacement and Rehabilitation Program (HBRRP) funds for preventative maintenance, specific actions were taken to slow the rate of bridge deterioration and extend their useful service life. Also, FHWA solicited comments through an Advanced Notice of Proposed Rulemaking (ANPRM) on ways to improve the National Bridge Inspection Standards and the HBRRP.
Through the Innovative Bridge Research and Construction (IBRC) program, 57 bridge replacement and repair projects were delivered in 41 States. These projects utilize high performance, low maintenance structural materials which provide bridges that are longer lasting and require less maintenance.
Infrastructure Improvement Projects Underway in Nevada and OhioNEVADA. The reconstruction of the Spaghetti Bowl, at the interchange of I-80 and US 395 between Reno and Sparks, began this year. The third largest improvement project in the history of Nevada involves adding lanes to the mainline and ramps, seismic retrofit for the bridges, pavement rehabilitation, and sound walls. OHIO. Another section of I-670 was opened to traffic. The new four-lane section between Grandview Avenue and State Route 315 is part of a major reconstruction and expansion project around Columbus. To reduce congestion through work zones in the remaining sections of I-670 under reconstruction, crews will build temporary pavement in the median and shoulder areas to maintain two lanes of traffic in each direction on the interstate during peak hours. |
A workshop highlighting European context sensitive design approaches was delivered to FHWA and State departments of transportation managers. Pilot workshops in accelerated highway construction for major corridor projects were delivered, and FHWA entered into a joint commitment with AASHTO to deploy this concept over the next 2 years. Agency staff also participated in workshops and technical sessions to advance the use of prefabricated bridge elements and systems.
A priority of the FHWA is to improve traffic management by continuing to promote the use of Intelligent Transportation System (ITS) technology, advocate improved management and operational practices, and build an institutional and policy underpinning for these improvements.
In conjunction with the ITS Joint Program Office, FHWA supported the completion of 77 of 244 regional ITS architectures. Regional architectures define and support local requirements but must be in conformance with the national ITS architecture to qualify for Federal aid funds.
Metropolitan areas with an integrated ITS infrastructure provide significant advantages in reducing congestion through improved operations. As such, progress in achieving greater integration serves as a leading indicator of progress in congestion mitigation. As illustrated in Figure 1, the number of areas with a medium or high level of deployment increased from 52 in FY 2001 to 57 in FY 2002. For the balance of areas with a low rating, FHWA continued to target funding and technical assistance to support their integration efforts.
FIGURE 1. Number of metropolitan areas achieving a medium or high-level of
integrated ITS infrastructure, FY 1999-2002.
(Source: Metropolitan ITS deployment tracking database.)
FHWA continued to fund the deployment of the 511 Travel Telephone Information number by awarding 40 planning grants to regions throughout the United States. In partnership with the AASHTO-led 511 coalition, the agency developed guidelines and provided technical assistance and information through various means including a national 511 Conference. The 511 telephone number was launched in 8 metropolitan areas, and will be available in an additional 5 locations in early 2003.
FHWA co-hosted a national conference on Incident Management with the AASHTO and developed a series of guidelines on incident management clearance and scene control practices. Transportation Management Centers in 12 cities expanded real-time system reliability and travel time data collection efforts, increasing the number of cities nationwide with this capability to 22. An operational test was initiated that will enable the integration of data and common operational practices between public safety dispatch centers and transportation management centers.
Developing local partnerships between transportation agencies, public safety organizations, and other critical stakeholders is key to congestion mitigation. A Primer on Regional Operations Collaboration and Coordination was completed to help regional stakeholder efforts identify the unique causes of congestion within their region and develop strategies and protocols that will address local problems.
In partnership with the AASHTO, the Transportation Research Board (TRB) and the American Planning Association (APA), FHWA took steps to increase the number of States that establish access corridor management programs. Programs were established in 25 States and eight other States are considering program changes.
Projects Initiated to Manage Traffic and Reduce Congestion in Colorado, Connecticut, Michigan, and FloridaCOLORADO. The Colorado Department of Transportation is converting existing high occupancy vehicle (HOV) lanes on I-25 in Denver to a high occupancy toll facility. While ensuring that high occupant vehicle users will not be adversely affected, the existing added capacity in the HOV lanes will be made available to single occupant vehicles using a value pricing approach. CONNECTICUT. The first of four major construction projects began on I-95 in the New Haven area. This stretch of the Interstate was designed to handle 40,000 vehicles per day. Current daily traffic volumes are averaging 120,000 vehicles per day. The initial phase involves building a new commuter rail station to reduce traffic demand through the construction period. MICHIGAN. Federal funds are being used to retime nearly 1,000 traffic signals in Oakland County. The 3 year project includes the design and installation of new timing plans, data collection, and evaluation of the improvements. FLORIDA. Work began on the Miami Intermodal Center, a facility that is designed to absorb much of the vehicle traffic that is currently a source of congestion at the Miami International Airport terminal access roadways. The Center will connect various modes of transportation to the airport and provide safe and efficient transfer for users of rail systems, buses, taxis, privately owned vehicles, and bicycles. |
An analysis of the nation's critical intermodal freight assets was completed. The Freight Analysis Framework, which identifies key freight corridors and shipment characteristics by mode, commodity type, and other characteristics, will help States improve their freight analysis capabilities and identify high-payoff infrastructure investments.
FHWA sponsored a national conference on freight security, in conjunction with the Intelligent Transportation Society of America (ITSA), and initiated two field tests on hazardous materials container security and efficiencies. Further enhancements were made to the Border Wizard Pro software that can be used to simulate all Federal inspection activities at any land border station in order to ensure safe and secure operations.
In cooperation with the National Cooperative Highway Research Program and the AASHTO, FHWA sponsored a pilot course on Transportation Asset Management (TAM) in anticipation of the release of a final course and companion guide in FY 2003. The TAM offers a more strategic approach to managing transportation infrastructure where return on investment is a critical consideration. It means getting the best results and performance in the preservation, improvement, and operation of infrastructure assets, given the resources available.
New pavement life cycle cost analysis (LCCA) software was developed for use by design engineers to calculate and compare the life cycle costs of pavement design alternatives. The Highway Economics Requirements System-State Version (HERS-ST) software was released. The HERS-ST is used to perform highway investment and performance analyses applicable to highway planning, programming, and needs assessment. Tools such as LCCA and HERS-ST enable practitioners to systematically consider the relative economic merits of choosing one investment option over another.
On-road mobile source emissions declined to 61.9 million tons in 2000, which was approximately 5 percent below the targeted level. Emissions budgets for ozone, carbon monoxide, and particulates (PM-10) were met in 98, 100, and 96.3 percent of all metropolitan areas, respectively. Wetland acreage impacted by Federal-aid highway projects was replaced at a rate of 2.7 to 1, well above the target level of 1.5.
| Human and Natural Environment | 1998 | 1999 | 2000 | 2001 | 2002 | Target |
|---|---|---|---|---|---|---|
| Project wetlands protection and recovery | 2.2 | 2.3 | 3.8 | 2.1 | 2.7 | 1.5 |
| EPA rating of environmental impact statements (*) | 3.2 | 3.1 | 3.2 | 3.3 | 3.2 | 3.4 |
| Percent nonattainment and maintenance areas meeting mobile source emissions goals, ozone | 90.3 | 93 | 97.8 | 97 | 98.0 | 98 |
| Percent nonattainment and maintenance areas meeting mobile source emissions goals, PM-10 | 96 | 100 | 100 | 94.4 | 96.3 | 86 |
| Percent nonattainment and maintenance areas meeting mobile source emissions goals, carbon monoxide | 96.4 | 96.2 | 95.7 | 100 | 100 | 96 |
| On road mobile source emissions, in million tons | 66.927 | 63.980 | 61.923 | See Note A below. | 63.100 | |
(*) This measure is not included in the FY 2003 Performance Plan.
Note A: 2001 data is not available until the fall of 2003.
FHWA collaborated with the Federal Transit Administration (FTA), the U.S. Environmental Protection Agency (EPA), other Federal environmental regulatory agencies, States, and other partners to undertake initiatives to improve transportation decisionmaking. Introducing context sensitive solutions (CSS) and integrating environmental considerations in planning are promising approaches that result in higher quality decisions, better environmental documents, greater consensus, and timelier project delivery. Through 2002, 34 States have interagency personnel funding agreements that result in faster, concurrent reviews; 29 States have adopted a merged process for wetland permitting agreements with the Army Corps of Engineers and EPA; 41 States have some level of delegated authority for historic resources; 15 States have initiated required Tribal consultation Memoranda of Understanding (MOU); and 32 States have adopted or initiated process or procedural-related agreements for streamlining.
FHWA continued to work with other agencies on joint research and implementation products for preserving wetlands, highway runoff water quality, and wildlife habitat. In cooperation with the AASHTO, FHWA developed a plan to reduce wildlife mortality along highways based on practices in five European countries. New training courses on highway runoff water quality and stream ecosystem restoration were delivered through the National Highway Institute.
The number of area transportation conformity lapses is used as a leading indicator of progress in minimizing mobile source emissions. As illustrated in Figure 2, the monthly average remained at six lapses during FY 2002. A total of 130 areas are subject to conformity requirements. FHWA consulted with the EPA on a proposed rule to allow a 1-year conformity grace period for new areas and amend requirements for updating conformity following the submittal of a Statewide Implementation Plan (SIP). Agency managers developed a policy for the implementation of the MOBILE6 emissions estimation models in conformity determinations and a SIP. The agency allowed project phases approved prior to a transportation conformity lapse to proceed during a lapse.
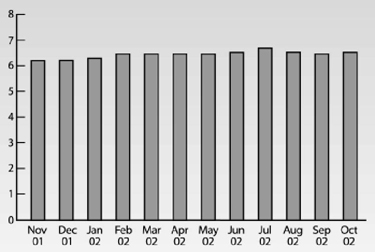
Figure 2. Monthly Number of Area Transportation Conformity Lapses, 12
month moving average, FY 2002.
(Source: FHWA Division Offices.)
Through the Congestion Mitigation and Air Quality Improvement (CMAQ) program, FHWA funded State and local government initiatives to reduce emissions through the use of alternative fuel vehicles, inspection and maintenance programs, and other transportation control measures.
FHWA collaborated with EPA and others to produce program informational brochures, including CMAQ and Public-Private Partnerships. CMAQ funding eligibility for high-speed rail projects was clarified.
A public information initiative on transportation and air quality was expanded with the addition of a new Internet site, information exchange, and community partnership program. FHWA continued to support the Alliance for Clean Air and Transportation, a national alliance of more than 20 organizations supporting public education to reduce traffic congestion and improve air quality.
Assessment of the CMAQ ProgramFuture FHWA program activities will incorporate the findings and recommendations of TRB Special Report No. 264 released last year, titled The Congestion Mitigation and Air Quality Improvement Program: Assessing 10 Years of Experience. A TRB committee reviewed current CMAQ projects, selected five metropolitan area projects for more indepth study, and met with project sponsors, interest groups, and others knowledgeable about the program. They concluded that a broad range of transportation planners, operating agency staff, air quality officials, and interest groups believe the CMAQ program is valuable and support its continuation. Based on the findings, the committee recommended that the CMAQ program be continued with a high priority given to programs and projects that address air quality improvement, rather than congestion mitigation. They also recommended that the program be broadened to address all pollutants regulated under the Clean Air Act, not just the transportation-related pollutants for which the EPA has set National Ambient Air Quality Standards; and that Congress consider authorizing the use of CMAQ funds for areas in violation of standards for fine particulate matter and ozone. The recommendations for further project and program evaluation received considerable attention. During FY 2003, FHWA will work with Congress and the States to reauthorize the CMAQ program and develop a program evaluation plan. |
The condition of the Strategic Highway Network (STRAHNET) continues to improve. After the events of September 11, more effort has been focused on highway system vulnerability assessment and ensuring operational response capabilities. Measures for this goal are currently under review.
| National Security | 1998 | 1999 | 2000 | 2001 | 2002 | Target |
|---|---|---|---|---|---|---|
| Strategic highway network pavement Condition, as percent of vehicle-miles- traveled on STRAHNET with acceptable ride quality (*) | 94.7 | 95.9 | 96.3 | 96.0 | Note A. | N/T |
| Strategic highway network bridge condition, as percent of the total number of deficient bridges on STRAHNET routes (*) | 22.3 | 22.0 | 21.5 | 21.4 | Note A. | N/T |
| Strategic highway network clearance routes, as percent of STRAHNET routes under bridges (greater than 16 ft.) (*) | 69.4 | 70.4 | 70.8 | 72.8 | Note A. | N/T |
(*) This measure is not included in the FY 2003 Performance Plan.
Note A. FY 2002 data is currently under review.
N/T - No Annual Target
In response to the events of September 11, FHWA expanded its efforts to ensure homeland security by assessing highway system vulnerability and improving operational response capabilities. As a member of an AASHTO Security task force, FHWA participated in developing and implementing an extensive program of security initiatives for State and local departments of transportation. A Vulnerability Assessment Guide was published to help identify critical physical highway-related infrastructure, assess its vulnerability, and implement countermeasures. A Guide for Updating Emergency Response Preparedness Plans was released to help the emergency response community prepare to respond to a man-made or natural disaster.
FHWA facilitated 10 Emergency Response Preparedness Workshops that brought together first responders to improve response to man-made or natural disasters in their areas. FHWA and AASHTO completed a nationwide effort to identify needs and set priorities for highway-related transportation security research.
FHWA also facilitated a pilot tabletop exercise in Texas to ensure efficient military deployment from significant military bases during a national emergency.
FHWA's Efforts to Ensure Homeland SecurityThe Ohio Department of Transportation and Kentucky Transportation Cabinet recognized FHWA for sponsoring a transportation operations emergency response and recovery workshop. In a letter of appreciation from the two agencies, it was noted that the design and execution of the training was very useful to the region and successful in providing an opportunity for emergency responders to see the effects of a catastrophic event on transportation system facilities and services. The National Capital Planning Commission for the District of Columbia area requested the assistance of Federal Lands Highway (FLH) to deliver their proposed Urban Design and Security Plan. An Interagency Task Force Report recommended Phase 1 funding to implement key improvements. Because of their experience and expertise in delivering similar projects, the FLH was selected to provide management and coordination services. |
Overall employee job satisfaction increased slightly to 74 percent, but fell short of the target level of 75 percent. The remaining measures for this goal are either under review or development. Results are not available at this time.
| Organizational Excellence | 1998 | 1999 | 2000 | 2001 | 2002 | Target |
|---|---|---|---|---|---|---|
| Program delivery, as percent of obligations expended on open (active) projects. | 67.5 | 69.3 | 70.3 | 71.3 | See Note A. | 72.3 |
| Program delivery, as median time in months to complete an Environmental Impact Statement. | 60 | 66 | 58 | 54 | See Note B. | N/T |
| Customer and partner satisfaction, as percent of overall satisfied with products and services | - | - | - | 65 | See Note C. | N/T |
| Employee job satisfaction, as percent of employees | - | 73 | 80 | 70 | 74 | 75 |
Note A. FY 2002 data is currently under review.
Note B. FY 2002 data is currently under review.
Note C. Customer survey data will not be available until 2004.
N/T - No Annual Target.
FHWA identified six major transportation improvement projects with an estimated total cost of more than $1 billion. The costs for all of these projects, except the Central Artery/Tunnel project in Boston, were within 10 percent of estimates in the initial baseline in the project financial plan. There were no scheduled milestones for these projects in FY 2002. Core competencies for a project manager were developed and six full-time equivalent positions were obtained. Technical assistance was provided through visits to major projects in Washington and Florida, by developing a resource manual for the project managers, and by sharing information in meetings, a newsletter, and presentations at various meetings. FHWA staff participated in the 2002 National Fraud Conference on Highway Construction and Public Transportation, and worked closely with the Office of Inspector General (OIG) investigative staff to deliver a course on Contract Administration.
FHWA continued to encourage the use of innovative finance methods to leverage limited Federal funds and to expedite project completion. A primer on Innovative Finance for State and local government officials was released. With the AASHTO, FHWA co-sponsored a Project Finance Institute workshop to present new techniques for developing and financing major transportation investments.
Projects Feature Innovative Approaches to Federal Aid Program DeliveryNEW MEXICO. In conjunction with New Mexico State Highway and Transportation Department, FHWA conducted a workshop before the New Mexico Highway 44 ribbon cutting on the use of innovative financing techniques, the packaging of contracts using unique materials, time constraints, project expectations, and design standards. The construction of NM SR 44 was the first highway to be built in the country with a 20 year warranty on the pavement and a 10 year warranty on the bridges. The warranties are expected to save millions in maintenance costs. TEXAS. FHWA approved a Transportation Infrastructure Finance and Innovation Act (TIFIA) loan for the Central Texas Turnpike. This 67-mile toll road network in the fast growing Austin area is scheduled to open in 2008. A second project, the Dallas High Five Project, is the largest single highway contract ever awarded in Texas. It will ease the transportation crunch for an estimated 500,000 motorists now using the LBJ Freeway and Central Expressway interchange. Incentives will give the contractor an opportunity to earn a bonus if the project is completed before the scheduled date of 2007. FLORIDA. FHWA worked closely with the Florida Department of Transportation (FDOT) to modify project contract specifications and streamline procedures in about 30 design-build projects meeting Federal aid requirements, in order to ensure that an economic stimulus program that included an increase in funding for the FDOT was implemented by June 2002. |
FHWA promoted environmental streamlining practices by publishing a Success in Streamlining newsletter, hosting interagency streamlining work group meetings, and by funding a number of innovative projects. The Environmental Streamlining 2002 Report to Congress was completed. A second interagency Executive Session was held in support of implementation of the National Environmental MOU. The report, Interagency Guidance: Transportation Funding for Federal Agency Coordination Associated with Environmental Streamlining Activities was released. Guidance on conflict resolution, titled Collaborative Problem Solving: Better Streamlining Outcomes for All, was issued. Numerous presentations on environmental streamlining and stewardship were made and the NEPA and the Transportation Decision Making Process courses were delivered nationwide
FHWA took several additional initiatives to improve the project development process. A study of State efforts to better coordinate Right-of-Way (ROW) acquisition with the environmental process was undertaken in order to improve practices used by State departments of transportation. The agency sponsored Accelerated Construction workshops in Indiana and Pennsylvania to examine a specific project with the goal of finding innovative ways to reduce construction time. FHWA approved a request to use tapered match provisions that allow New York to accelerate the start of projects, resulting in earlier completion dates as well as cost savings. The Agency initiated an internal review and update of FHWA's construction management and oversight practices. Draft inspection guidelines and an improved web site were completed.
Many FHWA division offices conducted local surveys and interviews with their partners to identify service delivery improvements. Division offices held meetings and peer exchange forums to improve communication, process management, and customer service.
FHWA continued to provide practical and sound training in support of achieving its mission. Several successful examples illustrate the work that was completed during the past year. An older driver highway design workshop was offered to highway engineers and planners. A follow-up survey revealed that more than 50 percent of the respondents indicated that they had designed or changed their facilities to accommodate older road users. As part of the National Summer Transportation Institute program, a highway safety module consisting of classroom instruction, site visits, demonstration and research projects was delivered to more than 750 students at 39 colleges and universities, including historically black colleges and universities, hispanic serving institutions, and tribal community colleges. To facilitate implementation of a new EPA mobile source emission factor model, FHWA sponsored seven training courses for 220 professionals from the private and public sector.
FHWA began working with several colleges and universities to create a Curriculum to train right of way professionals. Educational partnerships were discussed with a variety of institutions, including the U.S. Army Corps of Engineers, Morgan State University, and Penn DOT University, to deliver training courses and establish degree programs.
FHWA In Pursuit of Quality Service and PerformanceThe FHWA Ohio Division was recognized at Level 1 (Pledge Toward Excellence) in the Government category of the 2001-2002 Ohio Award for Excellence. The Ohio Division submitted the application to obtain feedback on how they can further integrate and deploy Baldrige management principles and practices into their day-to-day business. The FHWA New Jersey Division entered into a Mutual Service Standard agreement with the New Jersey Department of Transportation. Goals and performance standards were jointly developed in four areas: capital project management, planning and research, operations, and finance. FHWA received an Honor Award for Engineering Excellence from the Consulting Engineers Council of California for the reconstructed El Portal Road in Yosemite National Park, the first FLH design-build project. This method accelerated completion, minimized socioeconomic impacts, and utilized industry innovations. FHWA Western Federal Lands began distributing solicitation and bid packages electronically via the Internet using the FedBizOpps system. All documents except plans and geotechnical data are posted at the Web site, thereby reducing the notification time and paperwork handling costs for Federal Lands and more than 2,600 contracting firms on the mailing list. The feedback from the contracting community has been overwhelmingly positive to date. |
More than 63 percent of FHWA employees participated in the fourth annual all-employee survey. The survey findings revealed that employee attitudes and perceptions have remained fairly stable over the past three years. When compared to 2001, a larger percentage of the respondents understood how their workgroup contributes to the Agency's mission.
Efforts continued to address three areas of employee concern - career opportunities, leadership, and communication - that have consistently received lower survey ratings. Employee participation in professional organizations and professional licensing was encouraged, and training resources for professional licenses and accreditation were offered online. Communities of practice networks were established for administrative support staff, as well as staff working in the national ROW programs.
The trend in training expenditures, as a percentage of the FHWA payroll, is used as an indicator of progress in employee development. As illustrated in Figure 3, training expenditures declined slightly in FY 2002 but still represented nearly 3 percent of payroll.
In FY 2001, FHWA began monitoring the timeliness of its recruitment and selection process for new hires, excluding Senior Executive Service, Professional Development Program, and Technical Career Track vacancies.
In FY 2002, the percent of new hire selections that were made within 90 days increased from a baseline of 46 percent to 72 percent.
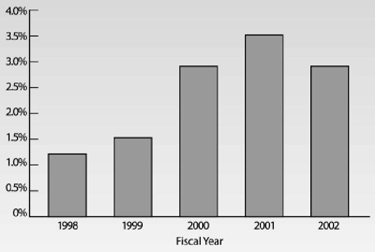
Figure 3. FHWA training expenditures, as percent of total payroll, FY 1998-2002.
(Source: Departmental Accounting and Financial Information System)
FHWA also made significant progress in implementing the five Federal government-wide initiatives in the President's Management Agenda. 0The more notable accomplishments are described below.
FHWA developed a Human Capital plan that helps advance both the U.S. Department of Transportation (DOT) and FHWA strategic objectives. This plan was developed as part of an overall Department Human Capital plan. As part of the plan, the key occupations in the Agency were identified and the necessary skills and competencies were defined. Strategies for sustaining these skills and competencies will be developed for all key occupations in FY 2003.
FHWA completed its 2002 FAIR Act Inventory and Competitive Sourcing plan. The number of commercial positions identified in the inventory was increased to approximately 20 percent of the total workforce. The Agency expects to compete or directly convert 15 percent of the 35 full-time equivalent positions identified in its 2000 Inventory by the end of FY 2003. A team of agency managers held periodic meetings to oversee progress in implementing a Department-wide cost accounting system, which is to be completed during FY 2003. FHWA continued to improve its financial reporting and received an unqualified "clean" audit opinion in FY 2001 from the OIG for the third consecutive year. FHWA implemented electronic travel software in Headquarters and division offices. The Agency expedited vendor payments by credit card for the Federal Motor Carrier Safety Administration and the National Highway Institute.
FHWA managers led the DOT E-Gov committee planning effort and participated in three Federal E-Government initiatives. A business case was developed for all information technology (IT) benefits meeting DOT criteria, and FHWA completed its portion of the Department-wide enterprise architecture data collection effort. The agency also completed its Section 508 implementation plan, developed IT capital planning guidance, automated 10 collections under the Government Paperwork Elimination Act, implemented an improved financial management information system for State departments of transportation, and provided training to employees on IT security.
FHWA revised its priority goals and objectives in the FY 2003 annual performance plan as a result of an internal planning effort, took initial steps towards aligning Federal aid program funding to highway system performance, and introduced additional performance measures that reflect agency program contributions to the strategic goals and objectives.
The Federal Highway Trust Fund is the source of funding for Federalaid highway and transit programs. Funds are generated from excise taxes on gasoline, diesel, and other motor fuels, as well as excise taxes related to the sale and use of commercial trucks. In FY 2002, approximately 86 percent of the revenues came from excise taxes on fuels.
The Federal Highway Trust Fund consists of two accounts: Highways and Mass Transit. FHWA programs and activities are funded from Highway Account revenues. In FY 2002, revenues to the Highway Account of the Federal Highway Trust Fund totaled $26.172 billion, a 6.7 percent decrease from the previous year.
Each year, FHWA enters into hundreds of project agreements with States in advance of appropriations that provide for cash reimbursement. When Federal highway funds are obligated, the U.S. Government is committed to pay the State for the Federal share of the cost, which is reimbursed after the project costs are incurred.
As illustrated in Table A, cost outlays were $30.86 billion in FY 2002. Approximately 57% of the Federal highway portion of the project funds was drawn from the Surface Transportation Program (23%), National Highway System (19%), and Interstate Maintenance Program (15%).
Federal-aid funds are used for a variety of highway improvement purposes depending on the priority needs and goals in each State. In FY 2002, approximately 60 percent of the funds were used for system preservation purposes including widening, reconstruction, bridge replacement or rehabilitation, and pavement rehabilitation, restoration, and resurfacing.
TABLE A. Distribution of Federal Highway Program Cost Outlays, Total FY 2002
(Source: FY 2002 FHWA Financial Statement, less transfers to Transit,
Railroad, Federal Motor Carrier Safety, and National Highway Traffic Safety
Programs).
| Program Title | Cost ($ Million) | Percent of Total |
|---|---|---|
| Surface Transportation Program | 7,139 | 23 |
| National Highway System | 5,875 | 19 |
| Interstate Maintenance Program | 4,583 | 15 |
| Minimum Guarantee | 3,051 | 10 |
| Bridge Program | 3,000 | 10 |
| Other Miscellaneous Programs | 1,934 | 6 |
| High Priority Projects | 1,133 | 4 |
| Congestion Mitigation and Air Quality | 919 | 3 |
| Federal Lands Highway | 598 | 2 |
| Planning | 504 | 2 |
| Administration | 406 | 1 |
| Research and Development | 346 | 1 |
| Appalachian Highway System | 318 | 1 |
| Miscellaneous Highway Trust Funds | 304 | 1 |
| Emergency Relief | 281 | 1 |
| Woodrow Wilson Bridge | 196 | <1 |
| Safety Programs | 171 | <1 |
| Minimum Allocation | 94 | <1 |
| State Infrastructure Bank | 8 | <1 |
| Total | $30,860 | 100 |
Data Source: NHTSA's Fatality Analysis Reporting System (FARS) for fatality data. VMT data are provided by FHWA's Highway Performance Monitoring System (HPMS).
Scope of Data: Number of fatalities come from FARS data, a census of fatal traffic crashes within the 50 States, Washington D.C., and Puerto Rico. To be included in FARS, a crash must result in the death of an occupant of a vehicle or a nonmotorist within 30 days of the crash. FARS data are a total count of fatal crashes collected from police crash reports, and other State data. FARS data cover all roadways open to the public, using the NHS classification of roads. Pedestrian and bicycle fatalities that occur on public highways but do not involve a motor vehicle are not recorded in FARS; however, this is a small number of fatalities. VMT data are derived by FHWA from State-reported estimates of travel based on various levels of sampling dependent on road type.
Measurement Methodology: FARS data are collected in each State, translated into a standard format, and transmitted to NHTSA. Data are collected from police crash reports, State vehicle registration files, driver licensing files, highway agency records, vital statistics, death certificates, coroner/medical examiner reports, hospital medical reports, and emergency medical service reports.
The HPMS is an integrated database that relies on the State highway agencies to annually report area wide data, universe data, standard sample data, "donut" area sample data, and linear reference system data.
Data Issues: FARS data elements are modified slightly from year to year to respond to emphasis areas, vehicle fleet changes, and other needs for improvement. FARS is a census of all highway traffic fatalities. As such it does not include information on crashes that produce only nonfatal injuries or that result in only property damage. Quality improvements are needed for location information in FARS that permits linkage to highway information for targeting problems and improvement strategies for the highway infrastructure.
Data Source: NHTSA's General Estimates System (GES) for number of nonfatal injuries and FHWA's HPMS for VMT using States' data.
Scope of Data: Injured persons data are derived from GES, a nationally representative probability sample that makes national estimates of total nonfatal injury crashes, injured persons, and property damage only crashes. GES data cover all roadways open to the public, using the NHS classification of roads. VMT data are derived by FHWA from State-reported estimates of travel based on various levels of sampling dependent on road type.
Measurement Methodology: The GES collects general information about the location of crashes in its sample. The HPMS is an integrated data base that relies on the State highway agencies to report area wide data, universe data, standard sample data, "donut" area sample data, and linear reference system data. The area-wide data consist of five statewide summaries. The summaries include data on travel and fatal and nonfatal crashes.
Data Issues: The GES sample plan only allows estimates of national totals, not detailed state-by-state breakdowns. Only general information is collected on the type of crash and highway system involved. The GES sample is designed to analyze vehicle and occupant injury information, not the roadway elements. Although various sources suggest that about half the motor vehicle crashes in the country are not reported to police, the majority of these unreported crashes involve only minor property damage and no significant personal injury.
Data Source: FHWA's HPMS.
Scope of Data: Data include VMT on the HPMS reported NHS sections and pavement ride quality data reported using the International Roughness Index (IRI). IRI is a quantitative measure of the accumulated response of a "quarter-car" vehicle suspension experienced while traveling over a pavement.
Measurement Methodology: Data are collected by State highway agencies and reported to FHWA for the HPMS. They are obtained from measurement devices that meet industry set standards. Recommended measurement procedures are included in the HPMS Field Manual.
Data Issues: IRI data for the approved NHS exist from 1995 onward. Past data (1993 and 1994) were collected on the proposed, rather than the approved, NHS. No NHS IRI data are available prior to 1993. The HPMS requires States to report IRI data every two years. In the HPMS Field Manual, FHWA refers to AASHTO Provisional Standards for measurement of pavement profile as the preferred method for equipment and data collection.
Data Source: FHWA's National Bridge Inventory (NBI).
Scope of Data: The National Bridge Inventory System (NBIS) requires the inspection of all bridges located on public roads and the submission of the collected bridge inventory and inspection data to the FHWA for inclusion in the NBI. The NBI contains data on the Nation's 590,066 highway bridges. The information in the NBI contains 95 data items for each of the bridges as required by the Recording and Coding Guide for the Structure Inventory and Appraisal of the Nation's Bridges. From the data provided, the FHWA monitors the condition of the Nation's bridges, which includes identifying those bridges that are either functionally obsolete or structurally deficient.
Measurement Methodology: The bridge information is collected by the State DOTs and other bridge owners and is provided to the FHWA at least annually. As part of the FHWA's NBI, NBIS, and Highway Bridge Replacement and Rehabilitation Program (HBRRP) monitoring and oversight responsibilities, the accuracy and reliability of the submitted NBI information is constantly evaluated through data checks and field reviews by both headquarters and field office personnel.
Data Issues: The NBI is the world's most comprehensive database of bridge information.
Data Source: FHWA 2000 Traveler Perception Survey
Scope of Data: A national sample of passengers.
Measurement Methodology: In 2000, FHWA surveyed passengers to ascertain satisfaction with the highway transportation system. The next survey will be administered in 2004.
Percent of congested travel, percent of additional travel time (Travel Time Index), and number of hours of driver delay.
Data Source: FHWA's HPMS.
Scope of Data: HPMS data are reported from approximately 403 urbanized areas within the United States. Data is based upon daily travel on major freeways and some arterial streets.
Measurement Methodology: Methodology used to calculate performance measures has been developed by the Texas Transportation Institute and used in the annual Urban Mobility Study. Details regarding the methodology are available at: http://mobility.tamu.edu/ums/study/methods/percent_congested.pdf
Data Issues: The percent of congested travel measure includes recurring congestion and delay attributable to accidents, crashes and other non-recurring events. Conversely, the percent of additional travel time and hours of driver delay measures include congested traffic volumes, crashes, and/or vehicle breakdowns.
Data Source: State DOT wetland mitigation databases.
Scope of Data: The summary data reflects the total acres of wetlands impacted versus total acres of mitigation that are provided.
Measurement Methodology: Data are compiled by the State departments of transportation using local sources. A FHWA-sponsored national wetlands management database is under development.
Data Issues: The uniformity of the data is not guaranteed, since it is subject to interpretation by the State. In particular, there is no uniform definition of what should be reported as acres mitigated. The FHWA has provided guidance to the States as to which mitigation activities are to be reported.
Data Source: FHWA database of EPA ratings.
Scope of Data: Data is available for Federal aid-funded projects with an Environmental Impact Statement between FY 1996 through FY 2002.
Measurement Methodology: Data are compiled by the EPA Office of Federal Activities based on comment letters from EPA regional offices.
Data Source: The data are obtained from the FHWA division offices.
Scope of Data: The FHWA and the FTA jointly make conformity determinations within air quality nonattainment and maintenance areas to ensure that Federal actions conform to the purpose of State Implementation Plans (SIP). The transportation conformity process is intended to ensure that transportation plans, programs, and projects will not create new violations of the National Ambient Air Quality Standards (NAAQS), increase the frequency or severity of existing NAAQS violations, or delay the attainment of the NAAQS in designated nonattainment (or maintenance) areas.
Measurement Methodology: The data is collected on a monthly basis. The average number of lapses monthly is calculated as a 12-month moving average. Data Issues: If conformity cannot be determined within certain time frames after amending the SIP, or if 3 years has passed since the last conformity determination, a conformity lapse is deemed to exist. New non-exempt transit and highway projects may not advance until a new determination is made.
Data Source: The data are obtained from the FHWA division offices. Scope of Data: Data are collected each year on July 1 in order to generate the trend data.
Measurement Methodology: Each FHWA office is requested to report the number of nonattainment and maintenance areas that meet their mobile source emissions budget by pollutant.
Data Issues: The makeup and severity of nonattainment areas will vary year to year. The data collected reflect only a status of the nonattainment and maintenance area. When an area does not meet the air quality standard for one of the criteria pollutants, it may be subject to the formal rulemaking process that designates it as a nonattainment area.
Data Source: National Air Quality and Emissions Trends Report, EPA.
Scope of Data: Total mobile source emissions are the sum of on-road mobile source emissions of carbon monoxide, hydrocarbons, nitrogen oxides, and particulate matter.
Measurement Methodology: The annual emissions level is the estimated total annual tonnage of on-road mobile source emissions of carbon monoxide, hydrocarbons, nitrogen oxides, and PM-10 as reported in the latest EPA Trends Report. Data Issues: The Trends Report is usually available around October of each year. There is a 1-year time lag for the emissions data. For example, the March 2000 report contains 1998 data. EPA's use of a mathematical model poses issues of model validation. The annual variation in the model estimates, as measured by the regression standard error, is 2.57. The HPMS data used as input to the model are subject to sampling and non-sampling errors.
Data Source: The FHWA's HPMS for roads and NBI for bridges on STRAHNET (including STRAHNET connectors) and customer surveys.
Scope of data: Adequate condition of STRAHNET and STRAHNET connectors to support DOD deployment and customer satisfaction data with highways serving military installations.
Measurement Methodology: Annual update to HPMS, NBI, and customer-partner surveys.
Data issues: HPMS and NBI condition data are continually being updated and made more accurate for use in geographical information system applications. Customerpartner satisfaction criteria and data are being developed.
Data Source: FHWA's NBI.
Scope of Data: The NBIS requires the inspection of all bridges located on public roads and the submission of the collected bridge inventory and inspection data to the FHWA for inclusion in the NBI. The NBI contains data on more than 590,000 bridges.
The information in the NBI contains 95 data items for each of the bridges as required by the Recording and Coding Guide for the Structure Inventory and Appraisal of the Nation's Bridges. From the data provided, the FHWA monitors the condition of the Nation's bridges, which includes identifying those bridges that are either functionally obsolete or structurally deficient.
Measurement Methodology: The bridge data are collected by the State DOTs and other bridge owners and provided to the FHWA at least annually. As part of the FHWA's NBI, NBIS, and HBRRP monitoring and oversight responsibilities, the accuracy and reliability of the data is constantly evaluated through checks and field reviews by both Headquarters and field office personnel.
Data Issues: The NBI is the world's most comprehensive database of bridge information.
Data Source: Customer and partner feedback thru American Customer Satisfaction Index (ACSI) survey instrument.
Scope of data (as defined in the 2001 Survey): Timeliness of our decisions: The timeliness of receiving decisions from FHWA for program level activities such as issuance of regulations, reviews and authorizations for the State Transportation Improvement Program and safety plans, and for project delivery activities for individual highway improvements. Usefulness of our information: The usefulness of our technical assistance information in terms of being current, helpful, and relevant. Competency of our personnel: In terms of being knowledgeable and experienced, how capable are FHWA personnel in providing direct technical assistance.
Measurement methodology: ACSI is a 0-to-100 scale, and is used by the private and public sectors to rate how customers perceive companies and organizations.
Data issues: Since this is a survey of perceptions, ratings are subjective.
Data Source: Employee feedback using the all employee survey instrument.
Scope of Data: Job satisfaction was determined to be the overarching measure for this category. Percent positive responses means either strongly agree or somewhat agree with the statement, I am satisfied with my job.
Measurement Methodology: The all-employee Survey is a biennial survey. An Interim Survey comprised of ten core item statements is also administered. The current strategy is to administer the full survey biennially and the interim survey in between years.
Data Issues: Since this is a survey of perceptions, ratings are subjective.
Data Source: Departmental Accounting and Financial Information System.
Scope of Data: Percent of Payroll (salary plus benefits) represents total investment in training including tuition, contract cost, participants travel and per diem and instructor travel for all training and career development courses and programs for FHWA employees.
Measurement Methodology: Amount of dollars spent on training and development divided by salary and benefits.
Data Source: FHWA's Human Resource Staffing Database.
Scope of Data: Start of 90 days is defined as the effective date on the departing employee's SF-50 personnel action. End of 90 days is defined as the date on the selection certificate once a selection is made. Positions in several programs will be excluded from the 90-day requirement including the SES, the Professional Development Program, and vacancies that fall under the Technical Career Track program. Special consideration will be given when positions have unusual requirements or results, such as recruitment advertisements in professional journals.
Measurement Methodology: The date on the selection certificate less the effective date on the departing employee's SF-50 personnel action.
Data Source: FHWA's Fiscal Management Information System (FMIS).
Scope of Data: The percentage is based on the total amount obligated on all Federalaid and Federal Lands Highway projects (regardless of year authorized) that have not been final vouchered (FMIS report M79) as of September 30 each year.
Measurement Methodology: The amount described above is compared to the unpaid obligations (FMIS report M80) as of the same day. This provides the amount expended on all open (active) projects.
Data Issues: This measure does not reflect activity for a single fiscal year. Measure: The median number of months from Notice of Intent to approval of the Record of Decision for Environmental Impact Statements.
Data Source: Data is collected at Division level and aggregated at the national level. Scope of Data: Environmental Impact Statement (EIS): A written assessment of the anticipated significant effects, both positive and negative, which a prospective Federal agency decision may have upon the quality of the human and natural environment. Notice of Intent (NOI): An official announcement in the Federal Register advising interested parties that an environmental impact statement will be prepared and circulated for a given agency action. Record of Decision (ROD): A final Federal decisionmaking document, relative to an EIS, that presents the basis for selecting and approving a specific course of action, including identification of the alternatives considered, measures to minimize harm, and an itemized list of commitments and mitigation measures.
Measurement Methodology: Information on development time from the Notice of Intent to: a) Draft EIS; b) Final EIS; c) Record of Decision; d) EIS with 4(f); and e) EIS without 4(f) is collected.
Data Issues: Data collection procedures are still being refined.
| AASHTO | American Association of State Highway and Transportation Officials |
|---|---|
| ACSI | American Customer Satisfaction Index |
| APA | American Planning Association |
| ANPRM | Advanced Notice Of Proposed Rulemaking |
| CMAQ | Congestive Mitigation and Air Quality Improvement Program |
| CSS | Context Sensitive Solutions |
| DOT | Department of Transportation |
| EIS | Environmental Impact Statement |
| EPA | Environmental Protection Agency |
| FAIR | Federal Activities Inventory Reform Act |
| FARS | Fatality Analysis Reporting System |
| FLH | Federal Lands Highway |
| FHWA | Federal Highway Administration |
| FTA | Federal Transit Administration |
| FMIS | Fiscal Management Information System |
| FY | Fiscal Year |
| FDOT | Florida Department of Transportation |
| GES | General Estimates System |
| GIS | Geographical Information System |
| GPS | Global Positioning System |
| HOV | High Occupancy Vehicle |
| HBRRP | Highway Bridge Replacement and Rehabilitation Program |
| HERS-ST | Highway Economics Requirements System-State Version |
| HPMS | Highway Performance Monitoring System |
| IT | Information Technology |
| ITS | Intelligent Transportation System |
| ITSA | Intelligent Transportation Society of America |
| IHSDM | Interactive Highway Safety Design Model |
| IRI | International Roughness Index |
| ITE | Institute of Transportation Engineers |
| IBRC | Innovative Bridge Research and Construction |
| LCCA | Life-cycle Cost Analysis |
| MOU | Memorandum of Understanding |
| NAAQS | National Ambient Air Quality Standards |
| NBI | National Bridge Inventory |
| NBIS | National Bridge Inventory System |
| NEPA | National Environmental Protection Agency |
| NHS | National Highway System |
| NHTSA | National Highway Traffic Safety Administration |
| NOI | Notice of Intent |
| OIG | Office of the Inspector General |
| PM-10 | Particulate Matter |
| ROD | Record of Decision |
| ROW | Right-of-Way |
| SES | Senior Executive Service |
| SIP | Statewide Implementation Plan |
| STRAHNET | Strategic Highway Network |
| TAM | Transportation Asset Management |
| TIFIA | Transportation Infrastructure Finance and Innovation Act |
| TRB | Transportation Research Board |
| U.S. | United States |
| VMT | Vehicle Miles Traveled |
More than 2,800 professionals work in FHWA offices located in all 50 states, plus Washington, D.C. and Puerto Rico. For more information about FHWA, please contact one of our offices below.
ADMINISTRATION CHIEF COUNSEL CIVIL RIGHTS CORPORATE MANAGEMENT FEDERAL LANDS INFRASTRUCTURE OPERATIONS |
PLANNING AND ENVIRONMENT POLICY PROFESSIONAL DEVELOPMENT PUBLIC AFFAIRS RESEARCH, DEVELOPMENT, AND TECHNOLOGY SAFETY |
EASTERN-
Baltimore MD
(410) 962-0093
MIDWESTERN-
Olympia Fields IL
(708) 283-3510
SOUTHERN-
Atlanta GA
(404) 562-3570
WESTERN-
San Francisco CA
(415) 744-3102
www.fhwa.dot.gov/field.html#fieldsites
ALABAMA ALASKA ARIZONA ARKANSAS CALIFORNIA COLORADO CONNECTICUT DELAWARE DISTRICT OF COLUMBIA FLORIDA GEORGIA HAWAII IDAHO ILLINOIS INDIANA IOWA KANSAS KENTUCKY LOUISIANA MAINE MARYLAND MASSACHUSETTS MICHIGAN MINNESOTA MISSISSIPPI MISSOURI |
MONTANA NEBRASKA NEVADA NEW HAMPSHIRE NEW JERSEY NEW MEXICO NEW YORK NORTH CAROLINA NORTH DAKOTA OHIO OKLAHOMA OREGON PENNSYLVANIA PUERTO RICO RHODE ISLAND SOUTH CAROLINA SOUTH DAKOTA TENNESSEE TEXAS UTAH VERMONT VIRGINIA WASHINGTON WEST VIRGINIA WISCONSIN WYOMING |
EASTERN-
Sterling VA
(703) 404-6201
www.efl.fhwa.dot.gov
CENTRAL-
Lakewood CO
(303) 716-2000
www.cflhd.gov
WESTERN-
Vancouver WA
(360) 696-7700
www.wfl.fhwa.dot.gov
January 2003 Publication No. FHWA-HCM-03-002.