Appendix B
FHWA
During FY 2005, FHWA continued to develop and promote innovative technologies that improved pavement durability, extended the service life, reduced costs, and helped mitigate congestion and work zone duration. In this effort, FHWA is working to increase the awareness of, and input requirements for, the Mechanistic Empirical Pavement Design Guide, a pavement analysis and modeling system recently released by the National Cooperative Highway Research Program (NCHRP). A technical advisory on pavement surface texture was released by FHWA, as were additional technical advisories on quality assurance, and asphalt and concrete materials design and testing. An FHWA design guide implementation team (DGIT) continues to conduct regional workshops/Web cast sessions, and has identified lead states to help in the implementation effort. By conducting State visits with the mobile laboratories (asphalt and concrete) data and guidance are being developed for input into Performance Related Specifications. A series of pavement smoothness workshops were initiated, focusing on key States that can most affect the pavement condition target. Pavement smoothness workshops were conducted in three States, and smoothness condition data reviews were conducted with two states. Site reviews of pavement production quality assurance systems were performed in four States and a best practices document produced. Research and Development on advancing pavement materials testing, performance prediction, analysis, and recycling through cooperative agreements with the American Concrete Institute, the Asphalt Institute, the Silica Fume Association, and a consortium of leading universities.
The Long Term Pavement Performance Program continued efforts to optimize the performance of the highway system by providing performance data, analysis, and product information that engineers and managers can use to design, build, maintain, and manage more cost effectively. FHWA continued its work with the Foundation for Pavement Preservation and in other association forums on pavement preservation to promote a "Do The Right Thing At The Right Time" philosophy. A National Center for Pavement Preservation was established under a partnership between the Foundation for Pavement Preservation, Michigan State University, and FHWA.
FHWA made significant progress toward the implementation of high performance materials to ensure more durable bridges. Forty-two States are using high performance steel and 44 States are using high performance concrete in their bridges. FHWA has also assisted the States in implementing the load resistance and factor design, which provides a more reliable and uniform level of safety for bridges. At least 46 States have fully or partially implemented the Load and Resistance Factor Design (LRFD) Specification for bridges, or are working with FHWA to develop LRFD implementation plans.
The revised National Bridge Inspection Standards (NBIS) regulation, last updated in 1988, was published and implemented by the States. The revisions clarify language that was vague or ambiguous, incorporate advances in inspection practices, and make the regulation easier to read and understand, not only by the inspector in the field, but also by those administering the highway bridge inspection programs at the State and Federal level. FHWA also brought into the NBIS important requirements that were previously in policy memorandums, such as the scour plan of action and fractural critical inspection requirements. Additionally, the new regulation incorporated several important inspection documents through reference.
FHWA also completed a manual for using public-private partnerships on highway projects, compiling all of the innovative techniques that make it easier for the private sector to enter into a partnership with the public sector to build roads. Also, the Agency posted model public-private partnership contract and legislative language on the FHWA Web site. FHWA has been collecting information enabling legislation and contract documents used at the State-level in establishing public-private partnerships. This information is targeted towards State decision makers that are considering enacting new or modifying existing enabling legislation or entering into public-private partnerships under existing authority. The FHWA Public-Private Partnership Task Force held quarterly meetings with State and private sector representatives to share experiences with public-private partnerships. To better coordinate internal agency efforts, a program manager position for public-private partnerships was created within the Agency.
FHWA also implemented Special Experimental Project No. 15 (SEP-15), a program that enables the Agency to experiment in four major areas of project delivery: contracting, right-of-way acquisition, project finance, and compliance with the National Environmental Policy Act (NEPA) and other environmental requirements. It is designed to increase project management flexibility, encourage innovation, improve timely project construction, and generate new revenue streams for federal aid transportation projects. FHWA received six project applications, of which three were accepted under SEP-15
FHWA laid the groundwork to implement the Highways for LIFE Program, as authorized and funded in SAFETEA-LU. FHWA began to pursue the program objectives through the technology transfer, coordination, and information dissemination activities. The Agency launched the Getting Started phase of Highways for LIFE, which focused on accelerating the adoption of three groups of technologies and innovations: Road Safety Audits, Making Work Zones Work Better, and Prefabricated Bridge Systems. Each of these technologies and innovations has demonstrated their ability to significantly improve safety, reduce construction congestion, improve quality, and lower the cost of highways. Throughout the year, the Highways for LIFE team made numerous presentations about the Highways for LIFE initiative, highway construction project success stories, and available technologies and innovations at AASHTO, TRB, States, Industry and FHWA-sponsored meetings.
FHWA is cooperating with its partners to advance the state-of-the-practice of Asset Management, as States and local entities face increasing demands on their aging infrastructure with limited resources available. Decision makers use the principles of asset management, applied to economic analysis, to identify the best alternatives for capital improvement programs, system preservation projects, and operations. The Agency provides informational and educational materials, as well as training and workshops such as the Transportation Asset Management training course that was presented to three States. To date, FHWA has deployed over 15 custom workshops to States and other partners implementing asset management and provided focused resources and technical assistance to practitioners utilizing economic analysis and evaluation tools. FHWA also supports the Transportation Asset Management Web site, with AASHTO and TRB, to provide best practices information to transportation owners. Last year, the Agency responded to more than 100 inquiries from Web sites as well as more than 50 requests for technical assistance to practitioners. States were provided case studies and other material on developing an Asset Management Program, pavement preservation and other infrastructure preservation activities, Bridge Management Systems for project prioritization, application and benefits of Safety Hardware Management, and Pavement Management System applications.
With the objective of improving tunnel management in the United States, FHWA and FTA published a Highway and Transit Tunnel Maintenance and Rehabilitation Manual and a Highway and Rail Transit Tunnel Inspection Manual. In cooperation with the District of Columbia Department of Transportation (DDOT) a one-day showcase of the DDOT Tunnel Management System used to inventory and manage their tunnel structures was presented.
FHWA conducted workshops on Construction Program Management and Oversight, which are targeted primarily at FHWA field engineers responsible for managing and overseeing construction programs. A Construction Program Management and Inspection Guide was released in October 2004. Twenty workshops were held and eight additional workshops are tentatively scheduled through 2006
| HIGHWAY CONGESTION - Departmental Performance Measures and Goals | |||||||
|---|---|---|---|---|---|---|---|
| Performance Measures | Modal Administration | FY 2002 Actual |
FY 2003 Actual |
FY 2004 Actual |
FY 2005 Target |
FY 2005 Actual |
FY 2005 Results |
| Percentage of total annual urban-area travel that occurs in congested conditions. | FHWA | 30.7(r) Target 30.9 |
31.0(r) Target 31.6 |
31.6 r,# Target 32.3 |
33.0 | 32.1 r,# | met |
Revised
# Preliminary estimate
FY 2005 Results: The Department met the performance target.
The percent of daily-congested travel nationwide is an indicator of overall system performance. The measure is an estimate of the percent of daily traffic in approximately 400 urbanized areas moving at less than free-flow speeds. The early estimate of the percent of congested travel is 31.6 percent in 2004, a figure below the anticipated increase to 32.5 percent. The result was 0.6 percent higher than in FY 2003, but below the anticipated increase for the third straight year. The projected result for FY2005 is 32.1 percent.
The following table depicts FHWA supplemental performance measures and goals related to Highway Congestion.
| HIGHWAY CONGESTION - FHWA Supplemental Performance Measures and Goals | ||||||
|---|---|---|---|---|---|---|
| Performance Measures | FY 2002 Actual |
FY 2003 Actual |
FY 2004 Actual |
FY 2005 Target |
FY 2005 Actual |
FY 2005 Results |
| Of annual urban-peak period travel time, additional percentage of travel time attributable to congestions | 55# Target 53 |
Target 54 |
Target N/T |
|||
| For the individual traveler in urban areas, average annual hours of extra travel time due to delays | 31.9# Target 32.2 |
Target N/T |
Target N/T |
|||
| Number of metropolitan areas where integrated Intelligent Transportation Systems (ITS) infrastructure is deployed | 57 Target 61 |
57 Target 64 |
57 Target 70 |
75 | N/A | N/A |
(r) Revised
# Projected from trends
N/T No Target
N/A Not available
FY 2005 Results: Data not yet available for these measures.
Advances in road weather management and planning travel for special events further contributed to reducing non-recurring congestion were. Significantly, a Memorandum of Understanding between FHWA and the National Oceanic Atmospheric Administration (NOAA) was signed. This agreement will facilitate collaboration in research and the sharing of information between the two agencies. Improved weather products and services for surface transportation travel will result from this relationship. A major conference on managing the transportation impacts of planned special events was held for practitioners to share experiences and best practices.
Transit Ridership
In 2004, people rode public transportation systems 9.0 billion times, traveling to and from work, medical appointments, school, and social events. Public transit offers many benefits. It is one of the safest ways of traveling, relieves road congestion, and reduces air pollution. But achieving these benefits depends upon ridership. The federal transit investment combined with state and private sector funds make public transportation possible for millions of Americans every day.
The following table depicts the performance measures and goals related to Transit Ridership.
| TRANSIT RIDERSHIP - Departmental Performance Measures and Goals | |||||||
|---|---|---|---|---|---|---|---|
| Performance Measures | Modal Administration | FY 2002 Actual |
FY 2003 Actual |
FY 2004 Actual |
FY 2005 Target |
FY 2005 Actual |
FY 2005 Results |
| Average percent change in transit boardings per transit market (150 largest transit agencies), adjusted for changes in employment levels. | FTA | 3.5 Target 3.5 | 0.7(r) Target 2.0 | 0.7(r) Target 2.0 | 1.0(r) | 1.4 | Met |
(r) Revised
Preliminary figures for 2002 represent the average change in total passenger miles and are not comparable to the 2003, 2004, and 2005 data. These 150 transit operators account for about 95 percent of all transit ridership.
FY 2005 Results: FTA met the performance target.
FTA adopted a new ridership target in 2005 which was based on transit boarding data that FTA began collecting in January 2002 on a monthly basis from the largest 150 transit operators, which collectively represent about 95 percent of transit ridership nationwide. The new database provided the opportunity to report data that are consistent across transit systems in terms of the time period covered. The methodology was changed to capture the average change per market (instead of the total average change) to reflect FTA's goal of increasing ridership in every transit market, not in just a handful of large transit markets. In addition, based on a number of research studies that document the effect of employment changes on transit ridership, FTA began to control for changes in employment by market, utilizing the Department of Labor's quarterly employment reports. The revised FY 2005 goal of 1.0 percent is based on the results of two years of data (FY 2003 and FY 2004) with the new measure.
The following table depicts FTA supplemental performance measures and goals related to Transit Ridership.
| TRANSIT RIDERSHIP - FTA Supplemental Performance Measures and Goals | ||||||
|---|---|---|---|---|---|---|
| Performance Measures |
FY 2002 Actual |
FY 2003 Actual |
FY 2004 Actual |
FY 2005 Target |
FY 2005 Actual |
FY 2005 Results |
| Passenger miles traveled
(in billions) by transit |
46.0 Target 47.5 |
46.2 Target 48.0 |
46.6* Target 46.5 |
46.7 |
47.2* |
Met |
| Average condition of motor bus fleet (on a scale of 1 (poor) to 5 (excellent)) | 3.12 Target 3.25 |
3.08 Target 3.20 |
3.30* Target 3.24 |
3.24 |
NA |
|
| Average condition of rail vehicle fleet (on a scale of 1 (poor) to 5 (excellent)) | 3.48 Target 3.29 |
3.48 Target 3.50 |
3.55* Target 3.55 |
3.55 |
NA |
|
N/A Not available Preliminary estimate
FY 2005 Results: Based on preliminary data, FTA met the performance target for passenger miles traveled by transit. FY 2005 data is not available for the remaining two measures.
FTA
Passenger Miles Traveled
Ridership is one of FTA's executive core accountabilities used to measure performance, and to support the ridership goal, FTA continued to invest in the Nation's transit infrastructure to ensure transit is safe, efficient, and as cost-effective as possible, thus attracting new riders. FTA also implemented several new initiatives to promote ridership, and recognized transit agencies that developed innovative and successful programs to increase ridership. Some of the FTA ridership accomplishments include the following:
- Individualized Marketing Demonstration Program - FTA partnered with four communities (Bellingham, WA; Sacramento, CA; Columbus, OH; and Durham, NC) to test an innovative travel behavior modification program through personalized marketing. The program encourages individuals to choose alternatives to single occupancy vehicle travel, such as transit, cycling, carpooling, or walking. Each demonstration includes a "before and after" survey, with a control group, to determine the impact of the program on travel behavior.
- Market-Based Ridership Strategies - FTA developed a two-day National Transit Institute course to assist transit operators in learning about and implementing market-based strategies to increase transit ridership.
- Enhanced Human Services Coordination - In response to the President's Executive Order on Human Transportation Coordination, the Federal Coordinating Council on Access and Mobility launched the "United We Ride" initiative to improve accessibility to transportation for individuals with disabilities, older adults, and people with lower incomes.
- FTA launched its "pilot ridership initiative" by conducting site visits at two transit agencies, Hartford, CT and CTRAN in Clark County, WA, that experienced a decrease in ridership during the last two years. FTA performed comprehensive reviews intended to identify opportunities where improvements in transit ridership could be made and to provide technical assistance. Both CT Transit and CTRAN have developed implementation plans for the recommendations that they chose to accept.
- FTA is working with the Transit Cooperative Research Program on a study entitled, "Determining the Elements Needed to Create High Ridership Transit Systems," which is expected to be completed by the end of 2005.
- FTA launched a new Web site page dedicated to ridership best practices from the transit industry. The site is updated regularly to include successful new approaches used by transit agencies to increase ridership.
Improved Bus and Rail Fleet Condition
The average condition of both the bus and rail fleets continued to improve. This resulted from FTA's funding for transit capital investment, including new vehicles. Between 2000 and 2002, the average age of each type of bus vehicle, except trolley buses, declined. In the case of rail, the average age of heavy rail vehicles declined from 23 to 20 years, outweighing slightly smaller increases in the average ages of other rail vehicles. Average bus and rail vehicle conditions normally range between 3.0 and 4.0, which reflects an "adequate" condition. Anything lower than 3.0 would be less than adequate, while a level higher than 4.0 would require an overly ambitious replacement program where vehicles are replaced prior to their FTA mandated minimum replacement ages.
FTA's FY 2006 Budget recommended funding for 20 existing, pending, and proposed Full Funding Grant Agreements (FFGA). These grants support projects in every geographic area of the country and in cities of all sizes. The projects include commuter rail, light rail, heavy rail, and bus rapid transit. When complete, they would carry more than 194 million riders annually, save more than 95 million hours in travel time benefits, and significantly improve air quality.
As part of an ongoing effort to make the New Starts evaluation and rating process as transparent as possible, FTA revamped the format and content of the project profiles. These revamped profiles encourage project sponsors to carefully consider how early decisions about project scope and alignment, cost, local commitment in terms of funding, and supportive land use policies will ultimately affect the project's rating.
FTA has increased its focus on improving the cost-effectiveness of proposed New Starts projects. The Agency requires local transit agencies to remove costs that do not contribute to the project's benefits, and has helped project sponsors improve their travel forecasts to more accurately portray user benefits. During the TEA-21 authorization period, FTA's New Starts program funded 22 new FFGAs, and recommended funding for four proposed projects. The benefits of these projects will be spread over 18 states and numerous cities and counties in urban, suburban, and rural environments. The total cost of these projects exceeds $17.5 billion (total federal, state, and local funds), and will provide jobs, improve mobility, and promote new economic development throughout the United States.
Transportation Accessibility
Public transportation is vital in maintaining independence and mobility for people with disabilities, linking them to employment, health care, and participation in the community. The President's New Freedom initiative seeks to create a more accessible public transportation system for individuals with disabilities. In addition, the Personal Responsibility and Work Opportunity Reconciliation Act limits the time a person can receive welfare benefits, and generally requires recipients to participate in job and training activities. For many of these people, access to public transportation is the key to making a transition from welfare to work.
The following table depicts the performance measures and goals related to Transportation Accessibility.
| TRANSPORTATION ACCESSIBILITY - Departmental Performance Measures and Goals | ||||||
|---|---|---|---|---|---|---|
| Performance Measures | FY 2002 Actual |
FY 2003 Actual |
FY 2004 Actual |
FY 2005 Target |
FY 2005 Actual |
FY 2005 Results |
| Percentage of bus fleets Americans with Disabilities Act (ADA) compliant | 90 Target 86 |
93 Target 89 |
95* Target 92 |
95 | 97* | Met |
| Percentage of key rail stations that are ADA compliant a/ | 77 Target 68 |
82 Target 79 |
82 Target 89 |
84 (r)I | 91* | Met |
| Number of employment sites (000s) that are made accessible by Job Access and Reverse Commute (JARC) transportation services | 52.1# Target 20.4 |
73.7 (r)* Target 23.5 |
82.8(r)* Target 50 |
50 | 82.1 | Met |
a/ Rail station measure does not reflect stations under a time extension as discussed below
(r) Revised
* Estimate.
FY 2005 Results: The Department met the bus and key rail station targets for compliance with the ADA, and the number of employment sites made accessible by Job Access and Reverse Commute (JARC) services.
FTA
ADA-Compliant Bus Fleets
FTA met the bus target for compliance with the ADA. Since enactment of the ADA in 1990, FTA has been working to make public bus, rail, and paratransit services accessible to individuals with disabilities. One major goal is to make the national fixed-route bus system 100 percent lift-equipped, ramp-equipped, or designed with low floors to accommodate wheelchairs. FTA met the target for ADA compliance by ensuring that bus fleet vehicles were equipped with wheelchair lifts or ramps. Prior to 1990, approximately 35 percent of the buses in the active fleet of over 50,000 transit vehicles were lift-equipped. In 2002, the fleet was 90 percent ADA-compliant, compared to 77 percent in 1999. FTA exceeded its target of 95 percent in FY 2005.
There are 685 key rail stations nationwide designated as such by the commuter authority or light/rapid rail operator, in cooperation with the local disability community. Of the 685 key stations, 547 were covered by a Voluntary Compliance Agreement (VCA), and are included in the stations that make up FTA's goal. In addition, although the ADA required all key stations to be accessible by July 26, 1993, the Department's ADA regulation at 49 CFR 37.47 (c)(2), permits the FTA Administrator to grant an extension up to July 26, 2020, for stations requiring extraordinarily expensive structural modifications to bring them into compliance. Currently, there are 138 stations under FTA approved time extensions, and these stations are not included in the goal. Although transit operators have made significant progress in meeting the goal, the remaining stations tend to be those that require the most significant amount of work. Many of these operators are discovering that the scope of work that is needed exceeds their original projections. As a result, more time will be required to complete the necessary modifications. The virtually flat level of growth in the percentage of key stations made accessible between 2003 and 2004 reflected these realities and led FTA to lower its previous projection for achieving full key station accessibility beyond FY 2004.
For FY 2005, preliminary data on key rail stations that are ADA compliant is 91 percent, which is higher than anticipated. A key factor in exceeding the target is attributed to aggressive monitoring, follow-up, and a continuation of the ADA key rail stationcompliance assessment process. Since 1995, FTA has conducted more than 700 assessments or follow-up assessments to track progress towards ADA compliance taking on-site measurements, recording specific accessibility features at stations, and simultaneously providing technical assistance. Quarterly rail station status reports and key rail station assessments have significantly increased the number of key rail stations that have come into compliance. FTA is providing the necessary technical assistance to its grantees as they work together to achieve the goals. FTA will continue efforts to encourage transit agencies to meet the accessibility goal for key rail stations.
JARC
FTA anticipates meeting its FY 2005 target for employment sites that are made accessible by JARC transportation services. FTA is currently conducting an evaluation of the data collection and verification process for JARC data collected in FY's 2003 and 2004. The evaluation of the FY 2003 estimated performance for employment sites reached has been revised to 73.7. The evaluation and verification of the FY 2004 performance data will be completed by September 2005. Improvements in the collection and verification process will be applied to FY 2005 data collection efforts. An estimate of FY 2005 actual performance will be available by late November 2005.
In areas that receive JARC funds, the program successfully meets the transportation needs of low-income individuals seeking reliable transportation to employment and related support services. Grantees have used JARC funds for a wide variety of services, ranging from expansion of fixed route bus systems and demand responsive services, to the provision of customer information. In each community that received a grant, JARC transportation services have reached new employment sites, making thousands of entry-level jobs and employers accessible for the program's target populations. New stops have also increased access to critical employment support sites, particularly childcare and job training facilities.
Riders have reported that JARC services have played an important role in their lives by making jobs accessible. An overwhelming majority (93 percent) of passengers surveyed in 2002 indicated that JARC services were either "very important" (81 percent) or "important" (12 percent) to them. Two-thirds (66 percent) of the respondents indicated that they would not have been able to access their destination without the JARC service.
JARC services are used most frequently to travel to and from a work site with approximately 62.5 percent being work trips. The JARC program has been successful at making employment accessible to its target population. The 2002 survey of JARC users found that 56 percent were employed full-time and 24 percent were employed part-time. About 38 percent of respondents were employed for less than six months at their current job, and a majority are working at entry-level positions, earning $7 - $9 per hour (48 percent) or less than $7 per hour (20 percent). Nearly one out of every three JARC respondents did not work prior to making use of the service.
GLOBAL CONNECTIVITY_______________________________________________
Facilitate a more efficient domestic and global transportation system that enables economic growth and development.
Strategic Outcomes
- Reduced barriers to trade in transportation goods and services, and enhanced international competitiveness of U.S. transport providers and manufacturers.
- Efficient movement of cargo throughout the domestic and international supply chain.
- Harmonized and standardized regulatory and facilitation requirements.
- Achieve the most competitive, cost-effective, and efficient environment for passenger travel.
- Expanded opportunities for all businesses, especially women-owned and disadvantaged businesses.
Departmental Performance Goals
- Increase Freight Travel Efficiency.
- Increase the Standardization and Harmonization of Transportation Standards and Practices.
- Improve the efficiency and cost-effectiveness of passenger travel.
- Increase Opportunities for Small Disadvantaged (SDB) and Women-Owned Businesses (WOB).
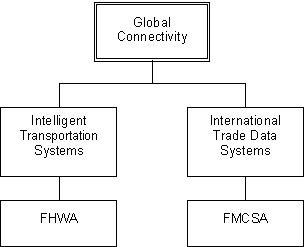
FHWA
With the assistance of industry partners, FHWA continued to collect data and refine two performance measures for travel time reliability on freight significant corridors and at land border crossings. FHWA measured average travel rates in five interstate highway corridors and calculated a preliminary Travel Time Index (TTI) and Buffer Time Index (BTI). The TTI, which ranged from 1.08 in I-65 to 1.24 in I-5, is a measure of reliability expressed as the ratio of the observed average travel time to free flow travel time estimated at 60 miles per hour. The BTI, which ranged from 4.48 in I-45 to 24.85 in I-10, represents how much extra buffer time must be allowed to account for variations in the system. FHWA expects to have a full year of data in FY 2006 to establish baselines for this measure. FHWA also initiated a project using Global Positioning Systems (GPS) in commercial trucks to collect border crossing and delay times at high volume U.S.-Canada land border crossings. A full year of data will be available in 2006; a baseline for the measure will also be established.
The Freight Analysis Framework (FAF) analytical tool, which is used to analyze freight movement in the United States across all modes of transportation, incorporated data available from the 2002 Commodity Flow Survey and further improved with the addition of international gateway data. The Agency continues to integrate several freight databases and improve its analytical and display capability through a geographic information system.
The Freight Professional Development program continued to expand its product offerings of training courses, technical assistance tools, university-based programs, and a freight resource library. Two new courses were offered and the monthly Talking Freight seminars continue to provide invaluable information and networking opportunities for freight professionals. Work continued in preparation for operational tests of the Electronic Freight Manifest project, which is designed to improve the speed, accuracy, and visibility of freight information. Finally, FHWA continued a variety of efforts to develop decision-making tools for freight related projects.
FHWA awarded funding to 83 projects under the National Corridor Planning and Development and the Coordinated Border Infrastructure Grants Programs. Some of these projects focus on improving planning and project development for the flow of people and freight.
FMCSA
In 2005, FMCSA participated in testing of the Automated Commercial Environment/International Trade Data Systems (ACE/ITDS). Through this system an Automated Truck Manifest feature will be implemented to further improve the efficiency of inspections at the Canadian and Mexican borders. FMCSA and Customs and Border Protection (CBP) will know before a bus or a truck reaches the primary inspection booth at a port of entry whether the vehicle and/or driver is free to enter U.S. roadways through a "go/no-go" signal to border inspectors. Inspection personnel also will know whether they need to refer a vehicle or driver to secondary holding areas for further examination. Through implementing this system, FMCSA will be the first DOT agency to partner with CBP on this Administration Second Term and Secretarial initiative.
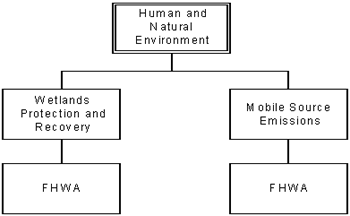
ENVIRONMENTAL STEWARDSHIP_________________________________
Promote transportation solutions that enhance communities and protect the natural and built environment.
- Improve the sustainability and livability of communities.
- Reduce the adverse affects of transportation on ecosystems and the natural environment.
- Improve the viability of ecosystems.
- Reduce the adverse effects of transportation facilities on the natural environment.
- Improve equity for low income and minority communities concerning the benefits and burdens of transportation facilities and services.
- Reduce the amount of pollution from transportation sources.
Departmental Performance Goals
- Reduce adverse effects on ecosystems and improve ecosystem viability.
- Reduce transportation pollution.
Transportation makes U.S. communities more livable, enhancing the quality of life and society. However, transportation generates undesired consequences too, such as pollution, noise, and the use of valuable land and degradation of fishery habitat. No matter how much is done to improve the capacity and efficiency of the system, the Department cannot consider its programs to be successful unless is also manages the effects on the environment, and ultimately quality of life.
The Department's objective is to advance the benefits of transportation while minimizing its negative environmental impacts. In 2005, the Department's environmental programs prevented as much harm as possible from being done to the environment by transportation projects and operations.
Wetlands Protection and Recovery
Wetlands are an important natural resource. They provide natural filtration of pollutants, and they store and slow down the release of floodwaters, thereby reducing damage to downstream farms and communities. Wetlands also provide an essential habitat for biodiversity. But many of the Nation's wetlands have been lost to development over the years, before their value was fully recognized. Highways and transportation facilities (location, construction, and operation) can be a significant factor affecting these ecosystems.
The following table depicts the performance measures and goals related to Wetlands Protection and Recovery.
| WETLANDS PROTECTION AND RECOVERY - Departmental Performance Measures and Goals | |||||||
|---|---|---|---|---|---|---|---|
| Performance Measures | Modal Administration | FY 2002 Actual |
FY 2003 Actual |
FY 2004 Actual |
FY 2005 Target |
FY 2005 Actual |
FY 2005 Results |
| On a program-wide basis, acres of wetlands replaced for every acre affected by federal-aid highway projects (where impacts are unavoidable). | FHWA | 2.7 Target 1.5 |
2.7 Target 1.5 |
2.1 Target 1.5 |
1.5 | 2.4 | Met |
FY 2005 Results: The Department met the performance target.
Over the past nine years, federal aid projects nationwide impacted on average 1,645 acres of wetlands and provided 4,232 acres of compensatory migration; a ratio of 2.5 acres of compensatory wetland migration for every acre of impact. Note FY2005 data will not be available until November 2005.
FHWA continued to coordinate wetlands programs and research initiatives with other federal agencies, including the Environmental Protection Agency (EPA) and the Department of the Interior (DOI). FHWA, EPA, and the Army Corps of Engineers implemented guidance on how the TEA-21 preference on the use of mitigation banks can be exercised under the Section 404, Clean Water Act permitting process, one of the first actions completed under the National Wetlands Mitigation Action Plan.
Mobile Source Emissions
The National Ambient Air Quality Standards (NAAQS) target six major pollutants as among the most serious airborne threats to human health. Transportation is a major contributor to some of the pollutants, particularly ozone, carbon monoxide, and (PM. About two-thirds of transportation-related emissions come from on-road motor vehicles. The quality of the air is a public good, and the cost of these pollutants is not captured in the marketplace. For this reason, the government works to mitigate this negative impact.
The following table depicts the performance measures and goals related to Mobil Source Emissions.
| MOBIL SOURCE EMISSIONS - Departmental Performance Measures and Goals | |||||||
|---|---|---|---|---|---|---|---|
| Performance Measures | Modal Administration | FY 2002 Actual |
FY 2003 Actual |
FY 2004 Actual |
FY 2005 Target |
FY 2005 Actual |
FY 2005 Results |
| Monthly average number of areas in transportation emissions conformity lapse | FHWA | 6 Target 6 |
6 Target 6 |
6 Target 6 |
6 | 6 | Met |
FY 2005 Results: On average, approximately six nonattainment and maintenance areas are in air quality transportation conformity lapse in any given month. In FY 2005, the number of areas in a conformity lapse was 6.
Areas throughout the United States with a non-attainment or maintenance designation are required to meet transportation conformity requirements in the Clean Air Act. Transportation conformity ensures that emissions from planned transportation activities are consistent with clean air goals of the area, and will not create new violations of the National Ambient Air Quality Standards (NAAQS), increase the frequency or severity of existing violations, or delay the attainment of the NAAQS in designated non-attainment or maintenance areas.
Following the release of the final Conformity Rule Amendments to address the new eight-hour ozone and particulate matter (PM 2.5) standards, FHWA worked with EPA and FTA on several companion guidance documents to clarify the new conformity requirements. Introduction to Transportation Conformity training was updated to reflect the new conformity requirements and delivered in seven sessions.
FHWA participated in a meeting of the Air Quality Subcommittee of the Association of Metropolitan Planning Organizations (MPO) to discuss issues related to the transportation conformity requirements under the new air quality standards, conformity rulemaking activities, reauthorization, emissions modeling, and other related issues.
FHWA continued to work with EPA and FTA to finalize a rulemaking to address conformity hot-spot requirements of PM 2.5. A final rule is expected later this year. FHWA continued to work closely with State and local agencies as well as its federal partners for the implementation of the transportation conformity regulations; especially for the areas EPA designated nonattainment under the new eight-hour ozone and PM 2.5 standards. An additional 39 nonattainment areas will be subject to more stringent PM 2.5 conformity requirements in April 2006. FHWA is working with EPA to schedule training to address these requirements.
Strategic Outcomes
- Reduce the vulnerability of the transportation system and its users to crime and terrorism.
- Increase the capability of the transportation system to meet national defense needs.
Transportation security is equal in importance to transportation safety. The Department's objective is to contribute to homeland and national security by providing strategic mobility, and by working in tandem with the Department of Homeland Security (DHS) to minimize the vulnerability of the U.S. transportation system to disruption, damage, or exploitation through crime or terrorism. In FY 2004, Departmental homeland and national security programs continued providing strategic mobility to DOD, and continued reducing the transportation system's vulnerability to crime and terrorism.
Departmental Performance Goals
- Increase national defense capability.
- Ensure sufficient contingency sealift and commercial outload ports are available to support DOD mobilization requirements.
Although there were no specific performance measures assigned to the HTF modes in support of this Strategic Objective, the following are actions the modes took to improve the Nation's transportation system security.
FHWA concluded its program of emergency response preparedness workshops for metropolitan areas, reaching 18 of the top 30 metropolitan areas and 12 other key locations designated by the Department of Homeland Security (DHS). FHWA initiated a study of the improvement actions each region sought to make following its exercise and produced a lessons learned and best practices guide that has been shared with workshop participants. The Transportation Security Administration (TSA) has expressed interest in this workshop format and the results for its port security exercise program. Also, FHWA completed a guide document on risk assessment and reduction for transportation management centers and provided advice and technical assistance to TSA as it moved forward with development of a risk self-assessment tool.
FHWA completed research into improving traffic signal timing and management of pedestrians during no-notice evacuations; worked with the Institute of Transportation Engineers to develop a Response and Recovery checklist for transportation agencies; worked with the Intelligent Transportation Society of America in defining the role of ITS under various security scenarios; and enlisted the aid of DHS, TRB, and AASHTO representatives in identify strategic security R&T needs and gaps.
Other accomplishments included the provision of training to STA bridge engineers in structure reactions to blast induced loadings. The 10 training sessions doubled the number of sessions given in the previous two years. FHWA also provided on-site technical assistance to six State highway agencies and the U.S. Coast Guard as these agencies conducted vulnerability assessments of critical bridges and identified cost effective countermeasures to reduce those vulnerabilities.
With the aid of the Volpe National Transportation Systems Center, FHWA undertook security training needs assessment. The Agency coordinated the results with the AASHTO Special Committee on Transportation Security in preparation for developing a long range plan for meeting the security awareness and training needs of its highway program partners at the State and local level. FHWA also developed a self-assessment tool for use by its Division Offices to identify initiatives that can be undertaken in conjunction with their State and local program partners.
FHWA worked closely with TSA in the development of the National Strategy for Transportation Security that provides the overall framework for the programs and activities needed to enhance transportation security. Also, FHWA ensured effective and efficient military mobilization over the Nation's highways by facilitating collaboration between State highway departments and DOD power projection platforms and distributed its guide, Military Deployment Coordination for State Agencies.
Public transportation has been a frequent target of terrorism, evidenced most recently by the London subway bombings in July 2005. The London attacks as well as those in Madrid and Tokyo have exposed existing vulnerabilities and the need to make transit security a top priority. Though FTA is limited by statute with regard to transit safety and security, it required its large grant recipients to establish comprehensive safety and security programs and demonstrate their technical capacity to carry out those programs.
Following September 11, 2001, through assessments, training, emergency response drills, and accelerated research on chemical detection systems and other security technologies, FTA found the most important actions that transit agencies needed to take immediately to enhance their security were public awareness, employee training, and emergency preparedness. In this light, FTA accomplished the following:
Top 20 Security Action Items. The Department/FTA published the Top 20 Security Action Items for transit providers and provided technical assistance to the 50 largest transit agencies (serving approximately 80 percent of all transit customers) to implement the recommended action steps.
Transit Security Public Awareness. The Department/FTA developed and launched "Transit Watch" in the fall of 2003. This nationwide emergency response passenger awareness program provided transit agencies a variety of media to encourage passengers to be aware of and look for suspicious or unusual activity, understand how and when to communicate their concerns with transit officials, and know how to exit systems in the event of an emergency. This program was developed and implemented in partnership with APTA, Community Transportation Association of America (CTAA), American Transit Union, and TSA in the DHS.
FMCSA
FMCSA continues its activities to heighten the awareness and sensitivity of motor carriers transporting HAZMAT to security threats, and to strengthen and support programs that ensure the safe and secure transport of HAZMAT. These activities include:
- Conducting 581 SCRs and 1,364 SSVs (figures are for activities reported through June 30, 2005).
- Continuing to work with its state and federal partners to expand and refine its network of contacts to communicate alerts to truck inspectors and the trucking industry. FMCSA remains a conduit for receiving security information from industry that can be forwarded to appropriate homeland security agencies.
- Training law enforcement and carriers in security awareness through its Trucks and Terrorism seminars.
- Continuing to coordinate its HAZMAT permitting regulations with both the Pipeline and Hazardous Materials Safety Administration (PHMSA) and TSA.
- Leading strike force activities in conjunction with: the U.S. Coast Guard; FRA; the U.S. Customs and Border Protection Agency (CPB); PHMSA; the Federal Aviation Administration (FAA); and state agencies in Chicago, IL; Wilmington, NC; Jacksonville, FL; Savannah, GA; Charleston, SC; and at Dulles Airport, VA, aimed at improving safety, security, and identifying undeclared shipments of HAZMAT.
- Enhancing data collection through extensive involvement in inter-modal efforts to create a unified HAZMAT inspection and enforcement database.
- Leading a cross modal HAZMAT working group to determine the Department's HAZMAT training requirements.
- Continuing to provide training and educational material to state agencies and industry on developing security plans.
Meeting the President's Management Agenda (PMA)
Organizational Excellence Strategic Objective:
In FY 2002, President George W. Bush identified his Administration's strategy for improving the management and performance of the federal government. The PMA, as this effort became known, included five government-wide goals. In support, the Department established its "Organizational Excellence" goal, which includes the implementation of the PMA. In addition, this goal required all modes, including the HTF agencies, to identify performance expectations regarding each of the five PMA areas.
In implementing the PMA, the Department aims to achieve the following organizational excellence outcomes:
- Improve customer satisfaction
- Improve employee satisfaction and effectiveness
- Improve organizational performance and productivity.
The Department's PMA goals for FY 2005 are the following:
Strategic Management of Human Capital
This goal focuses on long-term management of the federal workforce and fostering a citizen-centered, results-based government that is organized to be agile, lean, and capable of making timely decisions.
This goal uses competitive sourcing as a key tool for achieving an efficient and effective competition between public and private sources to deliver federal agencies' commercial-type work, thereby providing the highest quality and the most economical service to Americans.
Financial and Procurement Performance
Improved financial performance is the key aspect for ensuring that agencies have appropriate and accurate data for budget and policy decisions. Ensuring accurate and timely payments and improving accountability to the American people through audited financial statements are other cornerstones of this goal.
Expanded Electronic Government (E-Gov)
Expanding the use of the Internet to empower citizens will ensure that federal programs are delivered at lower cost and can meet the high public demand for information and services. This will also make the federal government more transparent and accountable.
Budget and Performance Integration
This goal focuses on regular, systematic measurement and accountability for program performance compared to pre-established goals as the means for federal agencies to focus on results rather than process.
PERFORMANCE SUMMARY
Strategic Management of Human Capital
The Department's Human Capital Plan guides the HTF agencies' efforts on this goal. The plan provides for strategic alignment of the workforce, workforce planning and deployment, leadership, and knowledge management. The Department's plan also contains initiatives to help the Department recruit, develop, and retain the diverse talent needed now and in the future to perform its mission and achieve strategic objectives.
Challenge
The Government Accountability Office (GAO) has stated that the entire Federal Government faces an impending wave of retirements of long-service, highly competent federal employees. From this arises a large-scale strategic human resource planning issue. While this exodus of talent will not happen overnight, the Department must plan now to maintain required levels of experience, competencies, and knowledge levels in the Department's civilian, military, and contract workforce. Succession planning, as well as managing and maintaining adequate institutional knowledge, will be crucial for the Department's ability to carry out its functions during this period of high workforce turnover.
All of the HTF modes participated in Department-wide human capital efforts. At the HTF modal level, the following actions were initiated to support the Department's Human Capital Plan:
FHWA
The Agency brought the new Department Electronic Learning Management System (eLMS) to all employees. This system enables FHWA to more efficiently manage training activities and resources. All employees can access eLMS and participate in more than 1,800 short online training courses at no cost. FHWA provided all its managers and personnel specialists with access to Smart Answers for Fed Managers, an online service providing supervisory information and tools. Numerous training programs were developed and delivered via videoconferencing and the Internet, including training and orientation for support staff, new supervisors, and new employees.
The Office of Personnel Management (OPM) established a government-wide 45-day hiring model to hold agencies accountable for improving the timeliness of the hiring. Under this model, 45 workdays are provided from the date the vacancy closes to the date the selecting official signs the certificate. During the first half of FY 2005, the average time from when the announcement closed to a signed certificate was 25.5 workdays; 85 percent of certificates were signed within the 45 workdays. The Department consolidated and automated staffing using commercial software. FHWA was selected as the Executive Agent and provided this service to all Department agencies, other than FAA and OIG. More than 500 job vacancies were posted during the first half of FY 2005.
Executive Agent/Quickhire. Under the PMA E-Gov initiatives the Department consolidated and automated the staffing function using the commercial product, Quickhire. FHWA was chosen to serve as the Executive Agent in providing automated staffing services for all Department agencies, other than FAA and OIG. As of January 1, 2005 all participating DOT agencies are using the automated system through the Executive Agent to announce positions, issue selection certificates, correspond with applicants, and maintain records. In the first six months of FY 2005, the Executive Agent has posted more than 507 vacancies using the automated staffing system.
FTA
Recognizing the potential for a wave of retirements and FTA's vulnerability of losing valuable expertise and institutional knowledge, FTA chose to address the situation by offering voluntary early retirements and buyouts in FY 2004 and early FY 2005. This gave FTA the needed flexibility to recruit the skill-mix needed to meet ongoing and future demands on the Agency, and improve the impact of its programs and its focus on customers. Internal analysis projected that by 2008 retirements alone could reach as high as 225 FTEs, or 40 percent of FTA's total workforce. Without efforts to train current staff and recruit highly qualified new staff, this potential wave of retirements could result in the loss of institutional knowledge and valuable expertise in managing billions of dollars in transit programs.
FTA requested staff increases for the last three years to better align its workload and address skill mix issues. The Agency believes that 531 FTE are necessary to fulfill its mission. FTA has also initiated efforts to realign the workload among specific offices and address the appropriate job-skill mix to meet the transit agency needs of the future. In the last two years, FTA recruited 15 Presidential Management Fellows (PMF) for key occupations throughout the Agency. FTA has included a tuition loan repayment program in its budget as an incentive program to attract and retain highly skilled employees.
FTA also included in its Strategic Business Plan a performance accountability program for its senior executives to measure specific results in transit ridership, transit system security readiness, project management and oversight, and grants management. FTA's senior executives are also evaluated with regard to common accountabilities related to leadership, human resource management, diversity, and the PMA.
NHTSA
In FY 2005, NHTSA completed implementation of its new performance management policy requiring movement of all NHTSA GS employees from a pass/fail performance system to a multi-tiered performance management system, as required by the Office of Personnel Management and the Department. NHTSA was also required to demonstrate to the Department evidence that 60 percent or more of employee performance appraisals focus on results linked to achieving specific goals connected to the agency's mission and ensuring greater accountability. This link was accomplished through updating and revising the agency's policies on performance management and incentive awards program policy.
FMCSA
In FY 2005, FMCSA's accomplishments in the Strategic Management of Human Capital included the following:
- Implemented the FMCSA Human Capital Plan, integrating the plan with other agency planning systems.
- Directed a study of FMCSA's human capital management strengths and weaknesses and identified strategies to effect improvements to workforce performance.
- Researched and evaluated emerging or updated skills requirements needed to accomplish mission activity.
- Implemented a human capital accountability system that is results-oriented, aligned with OPM's Human Capital and Accountability Assessment Framework, and in accordance with guidance issued by the Department.
- Standardized FMCSA performance descriptions to increase the Agency's ability to recruit and make sound competitive sourcing decisions.
- Completed an efficiency review of hiring process to significantly reduce hiring time.
- Expanded Web-based training and other classroom-alternative methods for training to close skills gaps and meet on-demand training needs while saving costs.
RITA
With the creation of the agency during this fiscal year, disparate offices and program functions remain in flux. Until a firm view of the program priorities and scope of activities is confirmed, human capital planning is limited. During 2005, RITA focused instead on assignment of personnel to existing offices and acquiring minimal staffing for agency support functions. In addition, two efforts at identifying and addressing employee concerns were established in response to the uncertainty surrounding the reorganization. It is anticipated that once basic employee needs are met through the efforts of these employee-based initiatives and the organizational structure and priorities are established, the agency can then engage in human capital planning to meet the needs of the new organization.
Competitive Sourcing
The Department's efforts to determine if current functions can be more efficiently performed by the private sector guides each mode's efforts under this PMA initiative. The Department's plan calls for 35 percent of the Federal Activities Inventory Reform (FAIR) Act inventory to be competed by the end of FY 2004
Each HTF mode participated in the Department's FAIR Act inventory. Below are the actions taken to identify functions that should be completed.
FHWA
FHWA announced the results of two competitive sourcing studies: one competition involved Visual Information Services and the second involved Data Collection and Analysis. The streamlined studies ran concurrently from September 2004 through February 2005 and the Agency proposals for the continuation of the services provided by both groups won out over the cost of contractor performance. The Agency maintained a high level of involvement and communication with employees, especially with those employees directly affected by this process, throughout the two competitions.
FTA
FTA has a very limited number of positions attractive to competition; however, it remains committed to simplifying and improving the procedures for evaluating public and private sources to better publicize commercial activities subject to competition, and ensure that it gives proper attention to the promotion of competition. In FY 2005, FTA:
- Successfully conducted a streamlined competitive sourcing process for the Office of Procurement, the Office of Accounting and the Office of Human Resources. Studies undertaken determined that it was more cost-effective to retain procurement and accounting activities in-house rather than by contract. In each case, the in-house employees won the competition. The completed competitions were major contributors to the Department "Getting to Green."
- Completed a feasibility study of IT services.
- Initiated the process of acquiring contractor assistance to develop options, provide expertise, and develop competitive sourcing strategies regarding direct conversions and competitions/cost comparisons.
In FY 2006, FTA plans to participate in Department-wide "cross functional" competitions and will be working with the Department in a pilot that links Human Capital and competitive sourcing initiatives.
NHTSA
In FY 2005, NHTSA completed its second competitive sourcing (OMB Circular A-76) study. The study was conducted using a standard competition to examine the functions being performed by 11 positions, currently occupied by 10 employees, located here in NHTSA HQ, comprising its Technical Information Services (TIS) unit within NHTSA's Office of the Chief Information Officer (CIO). NHTSA's in-house bid, which describes the Most Efficient Organization (MEO), and contains specific workflow improvements that were proposed for TIS, won the competition. The in-house bid, in an objective competition with the private sector, was also found to be the lowest cost technically acceptable offer, at an estimated cost margin of almost $1 million (over the multi-year performance period).
FMCSA
In FY 2005, FMCSA's Competitive Sourcing accomplishments include the following:
- Completed four public-private competitions to determine the most effective and efficient way to perform commercial activities identified in FAIR Act Inventories.
- Conducted and reviewed the CY 2005 FAIR Act Inventory, in conjunction with human capital planning, to determine potential, viable options for competitions to be carried out during FY 2006.
- Updated the Competitive Sourcing Plan to include modifications to FY 2005 projections, address subsequent years, and respond to all requirements from the Office of the Secretary of Transportation (OST).
RITA
The Fair Act Inventory was the first introduction to competitive sourcing for many parts of RITA. For other agency components, this round was simply an update of prior inventories. With this information, RITA has been able to more clearly articulate the role of federal employees versus the role of contract employees for new management which is in the process of determining the proper role of the agency and subsequently will determine the proper blend of staffing resources.
Financial and Procurement Performance
Improved financial performance is a key aspect of improving the government's performance. Knowing the full cost of the Department's and HTF's goods and services is a prerequisite to good program management. Good financial stewardship, excellent and efficient procurement and acquisition systems, and improved financial performance are cornerstones of excellent Departmental management. To achieve this goal the Department has implemented Department-wide systems for accounting, procurement, personnel, and travel.
For FY 2005, the HTF received an unqualified or "clean" opinion on its FY 2004 financial statements. Despite this success, the audit identified four material weaknesses and one reportable condition that the HTF modes, and principally FHWA, must address for future statement audits. During FY 2005, the HTF modes took significant corrective actions to improve financial management and accountability.
FHWA
The Agency continued to direct resources to aggressively resolve problems identified in the FY's 2004 and 2005 Financial Statement audits. In response to the FY 2004 audit findings, FHWA introduced the Financial Integrity Review and Evaluation (FIRE) Program. This program consolidates current financial oversight responsibilities of the federal aid division offices into a single directive. It incorporates current requirements to perform a financial management process review, review inactive projects, follow up on audit findings, assure compliance with the Single Audit Act, and assess the accounting and internal controls relating to administrative funds. Based on the results of the FIRE requirements, the Division Administrator will certify the results of these activities as part of the annual, year-end certification required by the Federal Managers Financial Integrity Act (FMFIA).
NHTSA
NHTSA ranks sound financial management and effective stewardship as high priorities. Taxpayers should know that Federal dollars are well accounted for and citizens should have faith that the programs are effectively managed. In that effort, NHTSA has focused on a number of key areas: 1) accelerate financial statement preparation and reporting; 2) strengthen management's responsibility for internal control; 3) continue to implement the Improper Payments Information Act of 2002 to better detect, prevent, and eliminate improper payments to ensure that taxpayer dollars are spent wisely and efficiently; 4) improve accountability to the American people through audited financial reports; 5) make changes to the budget process to allow better measurement of the real cost to the performance of programs.