|
|
| Previous | Contents | Next |
In 1995, with funding provided by the Federal Highway Administration (FHWA), the National Quality Initiative (NQI) - now the National Partnership for Highway Quality (NPHQ) - conducted the National Highway User Survey to determine the general public's satisfaction with the nation's highway system and identify the public's priorities for system improvements. This study was followed by three surveys conducted in 2000, each with an emphasis on distinct areas of interest - operations and planning, infrastructure, and federal lands.
The FHWA contracted with Northwest Research Group, Inc. to conduct the 2005 Traveler Opinion and Perception (TOP) Survey. Led by the FHWA Office of Corporate and Professional Development the five program offices of the FHWA - Safety; Infrastructure; Operations; Planning, Environment, and Realty; and Federal Lands - collaborated to create one comprehensive study. Developed as a nationwide survey, this survey sampled nearly 2,600 adults, 18 years of age and older. The survey's overarching objective is to understand the needs and expectations of users of the nation's comprehensive transportation system and the extent to which the existing transportation system meets those needs. The research will utilize results to identify possible areas for increasing traveler satisfaction.
Data collection was conducted by telephone in the fall of 2004, yielding a total of 2,589 completed interviews. Telephone data collection, using random digit dial (RDD) sampling, continues to be the best sampling and data collection methodology for conducting research that needs to be projected to the general population. In addition telephone surveys using computer-assisted telephone interviewing (CATI) technology is the best methodology for completing long and complex surveys, particularly those using a large number of rating scales where it is important to randomize the order of delivery to minimize response order bias and ensure more valid responses. Finally, professional interviewers probe for complete answers to all questions, limiting the number of unanswered questions and gaining in-depth information for open-ended questions. For all questions, interviewers gave respondents the option to provide a response of "don't know" or "no opinion."
Nearly 2,600 users of the nation's transportation system completed this comprehensive survey. A transportation system user is defined as a randomly selected individual within a U.S. household, 18 years of age and older, who has had at least some recent experience traveling on the state's transportation system. Individuals to be interviewed were selected using the most recent birthday method. This is the most common method for sampling within a household to ensure representation of men and women of all ages. The transportation system was defined to include highways, roads, public transportation, bikeways, walkways, and sidewalks. This is a much broader definition than in the past when the definition of the transportation system focused primarily on roadways and highways.
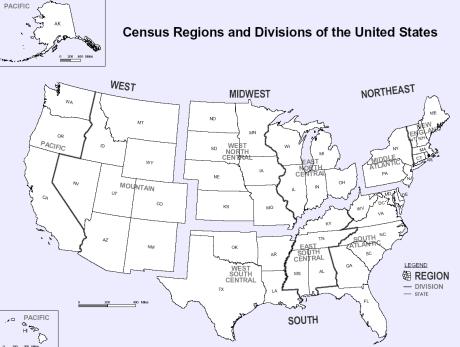
The sample was stratified by census region and an approximately equal number of interviews were completed in each region. In addition, a minimum of 25 interviews were conducted in each state. This ensures that reliable analysis can be conducted at the national level and among key subgroups - for example by geographic area, demographic segments, etc.
A random sample, screened for disconnected numbers, was ordered proportionately by state within each census region from Survey Sampling International to obtain the necessary number of completed interviews per region. The sample includes both listed and unlisted telephone numbers. Cell phone numbers are not included in the sampling frame as TCPA regulations require that these numbers be hand dialed. Moreover, cell phone users pay for all calls.
| Census |
# of Households |
% of Households |
Population 18 plus |
% of Population |
Unweighted |
|
|---|---|---|---|---|---|---|
| Northeast |
20,285,622 |
19% |
40,546,595 |
19% |
633 |
+ or - |
| South |
24,734,532 |
23 |
47,745,110 |
22 |
676 |
+ or - |
| Midwest |
38,015,214 |
36 |
77,387,366 |
37 |
636 |
+ or - |
| West |
22,444,733 |
21 |
46,166,472 |
22 |
644 |
+ or - |
| Total |
105,480,101 |
211,845,543 |
2,589 |
+ or - |
The TOP Survey is based on telephone interviews with a statewide sample of nearly 2,600 adults, yielding a margin of about 2 percentage points.
The FHWA TOP Survey questionnaire is partially based on the two previous surveys. This provides the capability to compare results from this survey with the 1995 and 2000 surveys. Moreover, the questionnaire was modified to address additional issues that have surfaced over the years.
In addition, modifications to the survey were suggested based on a comprehensive scan of other research. The focus of the environmental scan was to review existing national, state, regional, and local surveys of the public regarding traveler experiences with the transportation system, as well as related perspectives on community, environmental issues, institutional, and intergovernmental issues that affect transportation. The purpose of the scan was to gain some understanding of the context of public perceptions towards transportation to aid in the development of the final survey instrument and to provide additional insights for interpretation of final research results.
This scan includes demographic studies, travel behavior research, awareness and attitude surveys, among others. Sources of data include research generally available in the public domain, research conducted by other government organizations (states, MPOs, cities, transit agencies, etc.), and research conducted by not-for-profit organizations (e.g., AARP, AAA). More than 50 studies were reviewed. Results from this environmental scan are documented in a separate report and available on a website at www.xxx.xxx/xxx. In addition, the results and, where available, copies of the study reports are posted in a web-based database.
Focus group research was also used to guide the questionnaire design. The primary purpose of this research was to obtain an in-depth understanding of how travelers think and talk about the nation's highway system. Results were used to develop specific and meaningful measurement questions, while ensuring that no potentially important area of questioning was overlooked in the subsequent quantitative research. In addition, the focus groups ensured that the final questionnaire used terms and phrases that are understandable to the general traveling public.
Ten focus groups were held in five cities. Cities were selected to represent different parts of the country and potentially different travel characteristics.
If respondents had been asked to answer all questions included in the survey, the interview length would have exceeded one hour. To maximize the reliability of key estimates, some questions were asked of all respondents. Then, to minimize the burden on the respondents and to maximize response rates, the survey was broken into different sections and subsets of questions were asked of random groups of survey respondents. This resulted in an average survey length of just over 35 minutes.
Response rates to the survey exceeded the norms for telephone surveys. The overall response rate for the survey was 23 percent. Current response rates for RDD telephone surveys can be less than 10 percent - due to the difficulty of reaching people at home. To maximize response rates strict calling patterns were used. Each sample element was attempted a minimum of five times. After the third attempt, messages were left on answering machines about the survey. Many respondents called the toll-free number available to complete the survey. Sample was loaded in replicates and new replicates were not loaded until at least three attempts were made to each sample element in a replicate. Calls were attempted on different days and at different times to maximize the likelihood of reaching a person at home.
Only 24 percent of those reached refused to complete the survey. This is significantly lower than the average refusal rate of 41 percent for RDD telephone studies13.
The basic premise behind probability sampling is that each household has a known and non-zero probability of selection. In telephone surveys today, all households do not have an equal probability of selection. For example, households with multiple telephone lines have a higher probability of selection than do those with a single line. In addition, multi-person households have a greater probability of selection than do those with a single person, as it is more likely that a person will be at home during an attempted call. The first stage of weighting, therefore, adjusts for the probability of selection resulting from:
In addition, post-stratification weighting is used to adjust the sample to match the target population estimates in each census region and to adjust for any non-response. Because disproportionate sampling was used to ensure minimum sample sizes within each region, post-stratification weights are developed using 2000 census data to allow the sample to adequately represent the study area's population as a whole. The final weighting scheme also adjusts for any over- or under sampling of gender and age categories.
Two weight variables are added to the dataset. The first weight is expanded to represent the actual population counts - that is the number of people, 18 years of age and older, in the population and the second is scaled to the sample size of 2,589.
| Census Region |
Disproportionate Sample Stratification |
Proportionate Sample After Weighting to Population Counts |
Proportionate Sample After Weighting Scaled to Sample Size |
|---|---|---|---|
| Northeast |
633 |
40,546,595 |
496 |
| South |
676 |
47,745,110 |
584 |
| Midwest |
636 |
77,387,366 |
946 |
| West |
644 |
46,166,472 |
564 |
| TOTAL |
2,589 |
211,845,543 |
2,589 |
The sample was weighted to adjust the sample to match the target population estimates in each Census region and to adjust for non-response among key age and gender subgroups.
| Previous | Contents | Next |