U.S. Department of Transportation
Federal Highway Administration
1200 New Jersey Avenue, SE
Washington, DC 20590
202-366-4000
Highway Infrastructure Security and Emergency Management Professional Capacity Building
Printer-friendy PDF Version (4 MB)
This guide was produced for the Federal Highway Administration by Volpe, The National Transportation Systems Center, U.S. Department of Transportation.
The basis for the guide is a research project conducted by the Transportation Research Board National Cooperative Highway Research Program (NCHRP) 20-59 Panel on Surface Transportation Security. That research resulted in development and publication of “NCHRP Report 525, Vol. 15: Costing Asset Protection: An All-Hazards Guide for Transportation Agencies (CAPTA).”
CAPTA and its associated interactive spreadsheet tool (CAPTool) were developed by a contractor team comprised of Science Applications International Corporation (SAIC), McLean, Virginia, and Parsons Brinckerhoff, Washington, DC, and aided by subject matter experts from several state departments of transportation and a transit authority.
The purpose of this guide is to help agencies:
The CAPTA methodology is an approach that agencies can use to analyze threats and hazards relevant to critical multimodal transportation infrastructure assets. Transportation agencies are constantly faced with events like crashes, extreme weather, vandalism, and criminal activities. CAPTA gives agencies a capital planning and budgeting tool to use as a strategic point of departure for informing resource allocation decisions.
The methodology begins by taking a list of critical assets, identifying their thresholds in terms of potential losses, and then identifying countermeasures for assets. CAPTA facilitates comparisons of risks and related mitigation strategies across threats/hazards across the spectrum of transportation infrastructure. CAPTA deploys a consequence-based methodology that assists in capital budgeting. This methodology may be used to assess all hazards and provide decision support for resource allocation. CAPTA is part of a suite of analysis and planning tools independently developed to enhance safety and security for a range of assets and related threats/hazards.
CAPTA is intended for use by senior managers whose jurisdiction extends over multiple modes of transportation, multiple asset classes, and many individual assets. CAPTA provides a means for moving across transportation assets to address system vulnerabilities that could result in significant losses, given the threats and hazards of greatest concern within an agency or region.
CAPTA was developed through a project sponsored by the National Cooperative Highway Research Program (NCHRP) 20-59 Panel on Surface Transportation Security to fill a gap that existed in planning for security enhancements to highway infrastructure. CAPTA was published by NCHRP in 2009 as “Costing Asset Protection: An All Hazards Guide for Transportation Agencies (CAPTA).” The guide is supplemented online with a downloadable Microsoft® PowerPoint slide show and CAPTool, an interactive Microsoft® Excel spreadsheet tool for implementing the CAPTA methodology.
CAPTA is a robust planning tool that helps agencies estimate the capital and operating costs of countermeasures intended to reduce natural and man-made risks to transportation assets to locally acceptable levels. CAPTA is implemented using Microsoft® Excel and requires no special hardware or software.
CAPTA supports mainstreaming an integrated, all-hazards, multimodal, risk management process into major transportation agency programs and activities. CAPTA provides state Departments of Transportation (DOTs) and other users with a convenient and robust planning tool. It develops estimates of both capital and operating budget implications to reduce risks to levels that can be managed using resources typically available to operating agencies.
The goal of CAPTA is to:
Current available risk management strategies are asset specific, mode specific, and threat or hazard specific. These tactical approaches do not accommodate strategic, high-level, multimodal, or all-hazard considerations needed for overall agency-level planning and budgeting.
Instead, CAPTA uses a consequence-based risk management approach to capital budgeting that departs from traditional risk management strategies. It does not attempt to assess the likelihood of threat or hazard taking place (one that impacts transportation assets). Rather, the consequence-based approach assumes that if a decision maker perceives the possibility of a threat or hazardous event (assuming the event is sufficiently severe), the decision maker must consider alternatives for avoiding or minimizing consequences, should the event occur. The consequence-based approach focuses on how the asset has been adversely affected, not on why or how it happened.
Table 1. THE CAPTA DIFFERENCE
| Other Tools | CAPTA |
|---|---|
| Single transportation mode | Multimodal |
| Single threat | All hazards |
| Independent | Integrated |
| Threat-driven | Consequence-driven |
| Competitive allocation | Rational allocation |
| Subjective judgments | Objective data |
| “Opaque” methods | “Transparent” methods |
| Complicated models | Simple tools |
| Optimizing solutions | Informing decisions |
CAPTool is NOT for use in prioritzing assets. It is a “decision informing tool” that provides a logical and auditable process for identifying promising capital investments and procedures that reduce the likelihood and consequences of hazards and threats to transportation infrastructure.
The Costing Asset Protection Tool (CAPTool) is a macro-enabled Microsoft® Excel spreadsheet that is used to implement the CAPTA methodology. It assists a user through an evaluation and resource allocation process and provides a platform for completing a multidisciplinary approach that analyzes assets, relevant threats and hazards, and consequence levels. As noted, CAPTool is implemented in Microsoft® Excel and requires no special hardware or software. Later on, this guide will provide step-by-step instructions on how to interact with the CAPTool.
CAPTool can be downloaded here: http://www.trb.org/Main/Blurbs/160337.aspx.
CAPTool provides for a consequence-based assessment across multiple modes of transportation assets. It is an initial tool for high level budgeting decisions, providing a platform where all modes are compared on equal footing. This tool allows for an iterative process where the user can return to the beginning of the model and plot different threshold variables. Opportunities are available at “USING CAPTOOL, Step 1 and Step 6” in the tool to save your work to your hard drive.
Getting Started with the Tool:
If you do not see a dialogue box when you open the file, you will need to make sure that your macro security level is set to Medium. To do this, follow these steps:
You are now ready to use CAPTool.
CAPTool benefits your agency by providing an analytical, transparent, and objective framework for identifying its highest-priority assets across multiple modes of transportation, and taking the necessary steps to reduce the risk of disruptions or failures to these assets.
CAPTool integrates easily into your agency's existing operations planning practices and ongoing efforts to address safety issues. CAPTool is not intended to replace your current practices. It is a tool that your agency can use to support advanced planning that will allow you to more effectively respond to emergencies and incidents.
How Will My Agency Benefit from CAPTool?
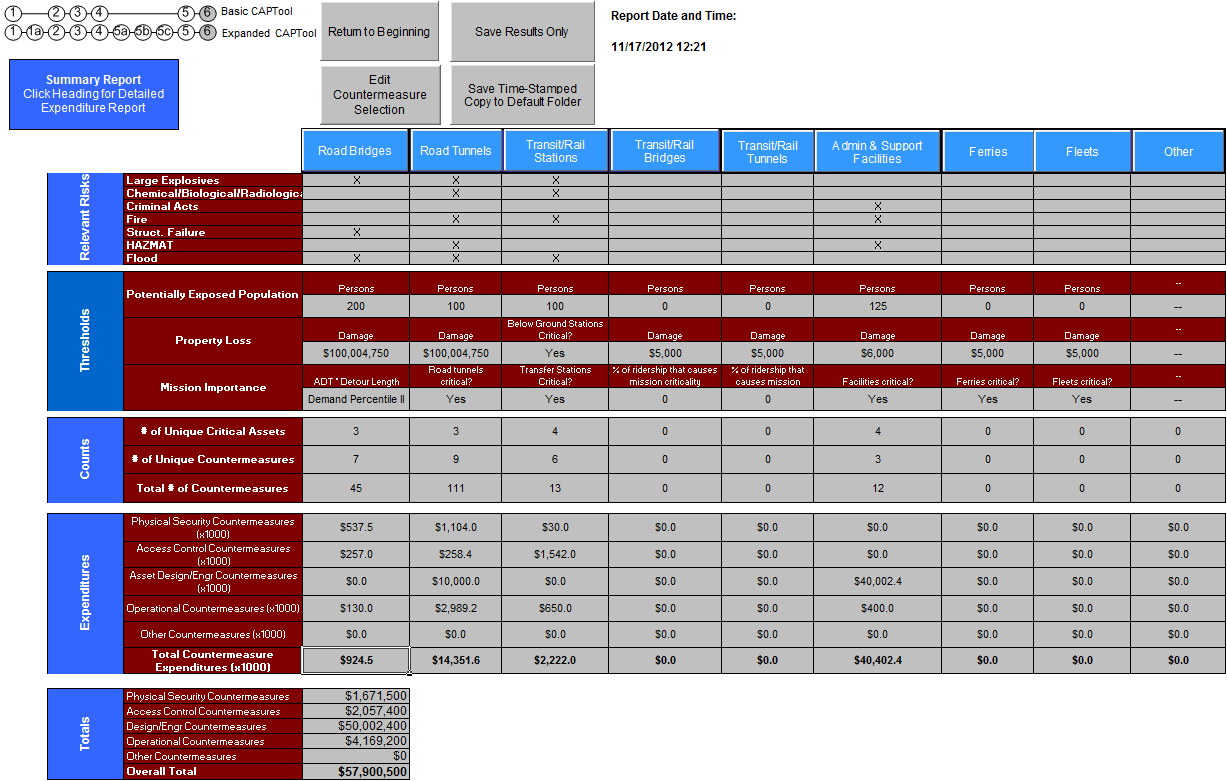
CAPTool implements the CAPTA methodology, and in doing so, provides you a tool for developing capital budgets for countermeasures that reduce the impact of threat/hazard events. Figure 1 is a Summary Report generated by CAPTool. The report displays agency-chosen critical assets, threats/hazards relevant to the assets, and the estimated cost of countermeasures that mitigate the impact of the threat/hazards, if they were to occur.
CAPTA may be employed by a range of agencies responsible for risk management across transportation modes in an all-hazards environment:
The time needed to analyze a group of assets in CAPTool will vary, but in general, once the data are assembled and entered into the tool, CAPTool can be used by a team of 3 or 4 people knowledgeable about transportation infrastructure to conduct several iterations and arrive at a recommended budget allocation in 3 to 4 hours.
Figure 1. CAPTool Summary Report. This Summary Report is from a sample CAPTool Use Case found in Appendix A.
View larger image

The CAPTA process involves a series of collaborative and solo steps, most of which are performed in CAPTool. Initial steps completed outside of CAPTool center on the collection of transportation data to be used as inputs in CAPTool, and discussions between the CAPTool user and colleagues within and/or external to his or her agency. These collaborative discussions between colleagues are critical to building a robust and representative response in CAPTool. The more the CAPTool user can collect data from regional stakeholders—e.g., from transportation public safety agencies, planning agencies, and authorities—the more comprehensive the CAPTool response will be.
CAPTA includes eight asset classes, identified and defined in Table 3. You will eventually need to select which of these eight asset classes you are concerned with, so it may be helpful to sort your list by these classes.
CAPTA can also be used to evaluate risk for assets that are not directly in your jurisdiction. For example, you could choose to evaluate an interstate ferry system.
Table 2. THE CAPTA METHODOLOGY (Steps Performed in CAPTool in Yellow)
| A. Identify Assets |
| B. Collect Data |
| 1. Identify Threat/Hazard Asset Classes (Relevant Risk Tab) |
| 2. Establish Consequence Thresholds (Thresholds Tab) |
| 3. Describe Infrastructure Assets (Multiple Assets Tabs) |
| 4. Identify Critical Assets Across Modes (Critical Assets Tab) |
| 5. Identify Countermeasure Opportunities (CM Opportunities Tab) |
| 6. Generate Summary Report (Results Summary Tab) |
| 7. Re-run CAPTool with Updated Assumptions, Budget Realities, or New Assets |
The following begins the discussion of how to prepare for and then use CAPTool in order to perform the analysis embedded in the CAPTA methodology.
Step A: Identify Assets
Detour lengths are in the National Bridge Inventory and can be calculated using NCHRP Report 525: Surface Transportation Security, Volume 11, Disruption Impact Estimating Tool–Transportation (DIETT): A Tool for Prioritizing High-Value Transportation Choke Points.
This step occurs outside of CAPTool. The first step of the CAPTA methodology is accomplished outside of the CAPTool and involves identifying assets over which your agency has significant responsibility, control, or influence, such as owner, operator, or regulator. These assets would be considered by your agency as potentially critical in terms of both potential losses and potential impact on mission.
Once you have identified the assets of interest, the CAPTA process will be faster and provide more immediately relevant results. With your list of assets, you are ready for Step B.
Step B: Collect Data
As with Step A, Step B also occurs outside of CAPTool. For each of the assets identified in Step A, you will need to identify and collect a variety of data points. The data required are listed in Table 3. If you are not familiar with all of the assets you will be evaluating using CAPTA, you may find it useful to contact asset managers who are familiar with the assets to fill in any gaps in the data collection. If you contact other staff to assist with Step B, you may also find it useful to seek their assistance for later CAPTool steps. As their familiarity with the assets improve, so too will the robustness of the asset analysis.
Once you have collected the necessary data elements for each of the assets you will be evaluating, you are ready to begin using CAPTool.
Table 3. LIST OF REQUIRED DATA FOR USE IN THE CAPTOOL
| Required Data | Category | |||||||
|---|---|---|---|---|---|---|---|---|
| Road Bridges | Road Tunnels | Transit/ Rail Stations |
Transit/ Rail Bridges |
Transit/ Rail Tunnels |
Admin & Support Facilities |
Ferries | Fleets | |
| Identification of asset or asset class | • | • | • | • | • | • | • | • |
| Quantity | • | • | • | • | • | • | • | • |
| Annual average daily traffic | • | • | ||||||
| Length (ft.) | • | • | • | • | ||||
| Travel lanes | • | • | ||||||
| Detour length to nearest available crossing | • | • | ||||||
| Type of construction | • | • | ||||||
| Replacement cost | • | • | • | • | • | • | • | • |
| Maximum train capacity (occupancy) | • | • | • | |||||
| Knowledge that structure is below grade/above grade | • | |||||||
| Knowledge that station is a transfer point | • | |||||||
| Percentage of total ridership using the tunnel (or bridge) | • | • | ||||||
| Square footage of facility | • | |||||||
| Maximum occupancy of facility | • | |||||||
| Maximum occupancy (persons) | • | |||||||
| Maximum occupancy (vehicles) | • | • | ||||||
| Average cost per vehicle | • | |||||||
Basic or Expanded: Which version should you use?
The Basic version of CAPTool is a good way to get started. Once you accept the default calculations, costs, and assumptions, you will be able to arrive at expedited results. Using the Basic process, you enter minimal data, including the assets you want to evaluate. The assumptions made in CAPTool have been vetted by subject matter experts.
You may want to consider using Expanded CAPTool if:
The Expanded CAPTool gives you access to the entire process, including cost of measures proposed to mitigate the effects of a disruption. You can alter the cost of countermeasures, verify assumptions concerning potential vulnerability, and apply individual filters when selecting countermeasures. The added flexibility of the Expanded Tool gives you more control over countermeasure costs and choice of countermeasures.
Asset data should be vetted to ensure that measures of capacity, occupancy, detour length, replacement costs, and other factors are verified and applied consistently. Specific attention should be paid to the following measures:
Maximum Train Capacity (Occupancy): The rated occupancy of a rush-hour train set should be entered. The user should use rated data from the manufacturer and the size of a rush-hour train set assembled according to standard operating procedure.
Administrative and Support Facilities Capacity (Occupancy): Occupancy data entered should correspond to the occupancy limitations set by local fire code.
Maximum Occupancy of Persons and Vehicles for Ferries: Occupancy data should correspond to the maximum limitations set by the United States Coast Guard.
Maximum Occupancy for Fleets: Occupancy data should correspond to that provided by the vehicle manufacturer.
Detour Length: Detour length should be measured from the point of the impacted bridge or tunnel to the point of the nearest structure capable of providing at least 50 percent capacity replacement. Capacity replacement may be measured in private vehicles, or in combined private and commercial vehicular traffic. This percentage can be adjusted upward based upon specific situations as long as all the structures are treated similarly. For example, if the detour is determined to be the distance to a crossing that can accommodate both commercial and private vehicles for road bridges, then that criterion applies to all crossings.
When you are on any given CAPTool step, click the Next button to continue. DO NOT click on the workbook tab to navigate to the next step. If you forget this and click on a tab to navigate to a following step, click on the “Previous” button to go back and then click “Next.”
CAPTool is a Microsoft® Excel spreadsheet that is used to implement the CAPTA methodology. It can be downloaded here: http://www.trb.org/Main/Blurbs/160337.aspx.
After you download CAPTool, open it and click on the Welcome tab. Here, you select whether to use the Basic or Expanded version of CAPTool. The main section of this guide will cover the Basic Tool. The Basic Tool uses default calculations, assumptions, and costs and provides a “quick look” analysis. Once you are familiar with the CAPTool Basic Tool, you may wish to use the Expanded Tool. For information and instructions about the extra steps included in the Expanded Tool, see Appendix A of this guide.
Now that you have compiled the necessary asset-related data and performed an initial vulnerability assessment of the assets, you are ready to begin analyzing assets in CAPTool.
Open CAPTool's Microsoft® Excel spreadsheet. Click on the Welcome tab and select the Basic Tool. CAPTool will then move you to Step 1.
This is where you begin to input data into CAPTool.
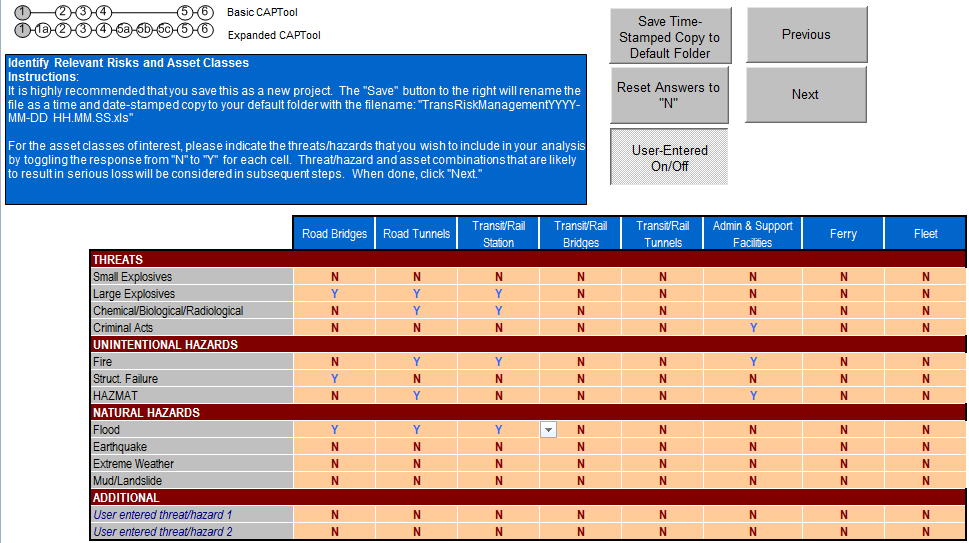
Choose asset classes, hazards, and threats to evaluate, based upon their relevance in the area. This relevance may be based on historical data, actuarial data, expert projections (such as the potential for seismic activity or flooding), or concerns about intentional attacks. While you will most likely be interested in assets that fall under the jurisdiction or control of your agency, you may evaluate other assets not under your agency's direct control. For example, you could include privatized ferry service in your analysis and the results can be included or excluded from your agency's budget as appropriate.
You identified relevant threat and asset combinations to consider in your analysis. Through various inputs (past experience, judgment, or vulnerability assessment), your agency decided that threats can impact these assets to a point where further analysis is required.
The asset classes selected in this step will determine which assets you evaluate in the remainder of CAPTool, and the hazards/threats selected will determine which types of countermeasures CAPTool recommends.
Figure 2. During CAPTool Step 1, you will select assets and threat/hazard combinations to evaluate.
View larger image

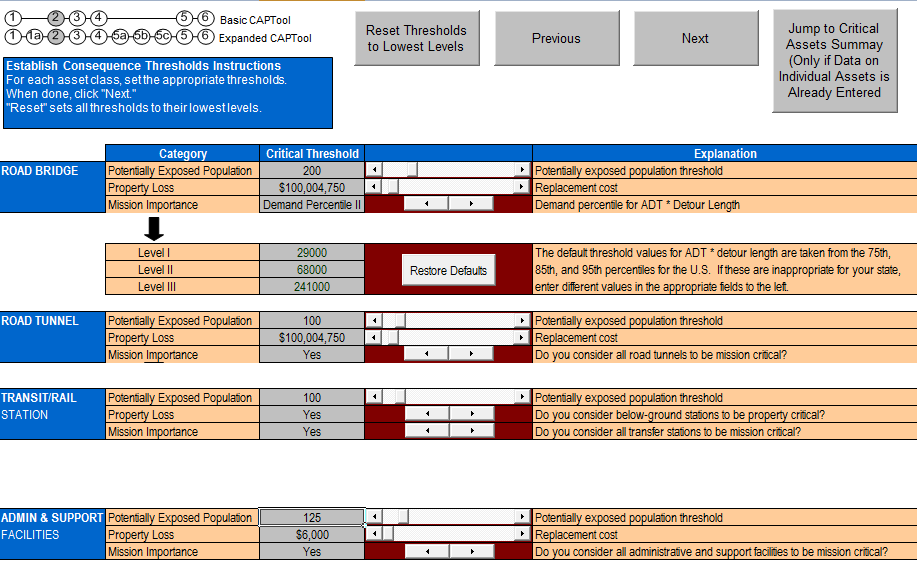
In this step, establish the consequence threshold beyond which the asset owner, operator, or system user would consider investments in countermeasures to prevent losses or mitigate consequences. This step will determine what level of risk to the population, property loss, or service disruption to the asset can be addressed in your current operations. In addition, what level do you need to plan for additional support in the future?
When you arrive at Step 2, you will see each of the asset classes you selected in Step 1.
This is the first step where you input data into CAPTOOL
The consequence threshold is a critical input in CAPTool. It is the planning factor that the decision maker or agency uses to set level of consequence, thereby assuming greater responsibility for managing risk. Thresholds represent the point at which the potential casualties, property loss, mission disruptions, economic disruptions, and/or public reaction is such that the responsible agency must consider allocating resources above and beyond those typically included in operating budgets, to prevent or mitigate the effects of the threat or hazard.
CAPTA consolidates consequences in these three areas:
Potentially Exposed Population (PEP): This category is expressed in terms of potential casualties. It represents a range of casualties for each threshold level. The CAPTool uses the phrase “potentially exposed population” because the analysis assumes that this is the upper bound on harm to people associated with the maximum threat. Therefore, the reference is to exposure to risk, rather than an estimate of the actual casualties resulting from the hazard or threat.
Property Loss: This category is expressed in terms of asset replacement costs. The expression is in millions of dollars across the cost range.
Mission Importance: This category is expressed in terms of loss of function and/or transport delays and is relevant to specific assets or asset classes, including the relative importance of assets to the transportation network as indicated by their system role (e.g., Interstate Highway System, National Highway System designation) and the volume of use (e.g., Average Daily Traffic (ADT)) across a volume range. For road bridges, the CAPTA uses the product of ADT and detour distance as a surrogate for mission or function impact. The user can set the values of this factor based on local data. For purposes of illustration, this CAPTool example uses the 75, 85, and 95 percentile of this product based on bridges in the National Bridge Inventory.
Note that other major consequences may also occur, such as loss of specific government services, delays to emergency response, and impediments to military deployment. However, such consequences tend to be highly correlated with the primary consequences that capture loss of life; loss of property; and disruption of functions and related economic, government, military, and emergency response activities.
Figure 3. In CAPTool Step 2, you assign consequence thresholds for each asset class selected in Step 1.
View larger image
Experiment with Thresholds
You can alter and adjust the threshold levels in this step, and in subsequent iterations of this analysis. Keep in mind that the threshold you select is not meant to imply that losses below the threshold are of no consequence. Instead, losses below the selected threshold are part of the responsibilities and concerns of other entities (jurisdictions, agencies, or offices within agencies). The losses below the threshold may also be within the means of response for the agency, and require no additional investment in countermeasures.
CAPTA includes eight asset classes, identified and defined in Table 3. You will eventually need to select which of these eight asset classes you are responsible for considering in your analysis, so it may be helpful to sort your priority list by these classes.
Keep in mind that CAPTA can also be used to evaluate risk for assets that are not directly in your jurisdiction. For example, you could choose to include in your analysis a ferry system run by a private operator.
You selected consequence thresholds by consequence categories for each asset class. The information entered into CAPTool during this step is used to identify assets and asset classes that are judged to be of critical consequence and will remain in the analysis for further consideration.
The selection of thresholds is an iterative process, given the high cost of some measures and scarce resources found in many transportation agencies. You may find it useful to return to this step in subsequent iterations of the tool.
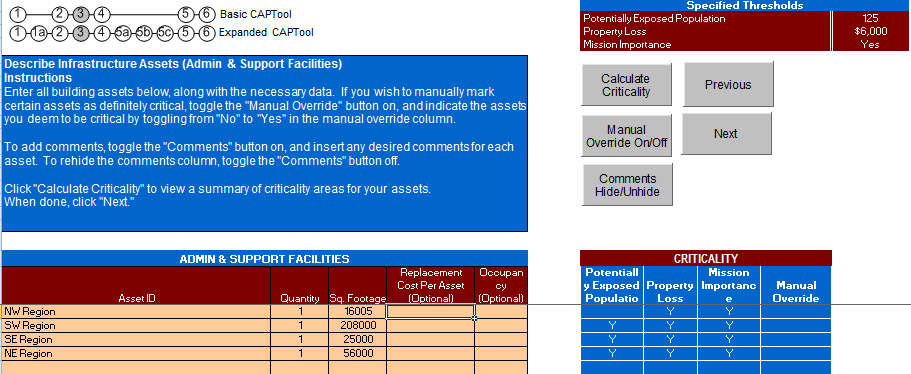
The purpose of this step is to enter and describe assets or groups of assets of interest to your agency, either because of direct ownership or agency influence, and the agency's desire to consider them in analysis via the CAPTool. The secondary purpose is to calculate whether an asset or asset class surpasses the consequence thresholds chosen by the user. Table 5 in Appendix D shows the equations used to determine if assets exceed consequence thresholds.
The asset characteristics entered in this step will be assessed against the thresholds chosen in Step 2, to screen the assets and asset classes for further consideration. Data inputs can be entered individually, by name or designation, or by class of assets. Named or designated assets are normally well-known structures that are unique in the jurisdiction. Named assets may also be entered onto the list because of their special significance or importance to the region.
Prior to entry into the CAPTool, the user should screen the list to group similar assets into asset classes. Examples of assembling classes of assets may be:
When these asset classes are entered, carefully note representative values such as key design and operational parameters used to represent the entire class. This approach seeks to reduce the number and types of assets to be considered by consolidating assets into classes that can be treated as a group. The user can also enter individual assets likely to be at or near the threshold levels chosen in Step 2.
The owner's inventory is combined with the thresholds from Step 2 to identify high-consequence assets—those that exceed the selected consequence thresholds. The user may consult and obtain information from available inventories, such as the National Bridge Inventory, or from prior criticality assessments to generate the information needed for this step.
Figure 4. In CAPTool Step 3, enumerate and describe each of the assets you wish to evaluate.
View larger image
Perform Your Analysis on Groups of Similar Assets
For each asset class, group assets by characteristic and similarity, generating “asset groups” that will be evaluated as one unit. For example, you might group two interstate highway tunnels with similar length, ADT, and number of lanes, as they will perform similarly in the CAPTA analysis. After filling in the data characteristics for each asset and asset group, CAPTool calculates asset criticality.
To Override or Not to Override
If you wish to manually override this distinction and force CAPTool to include any given asset, you may do so by toggling the “Manual Override On/Off” button and marking the assets you wish to include as “Yes.” This criticality determination identifies which of your assets will be considered for countermeasures and further analysis in later CAPTool steps.
You identified and enumerated each asset you will be evaluating. For each asset class, you used your already-prioritized list of assets to inform your asset selection. Using the asset characteristics as a guide, you grouped similar assets into “asset groups” and entered the asset characteristics for each group into the tool. Once you have entered your data for each asset, CAPTool will calculate the criticality for each asset group. This criticality determination will be used later to guide countermeasure selection, and will automatically be carried through to the remainder of the CAPTool steps.
In this step, CAPTool combines the inputs you entered in Step 2 (establishing consequence thresholds) and Step 3 (describing infrastructure assets) to determine which assets are of critical consequence. An asset is considered critical if the potential risk facing the asset exceeds the user-specified consequence threshold.
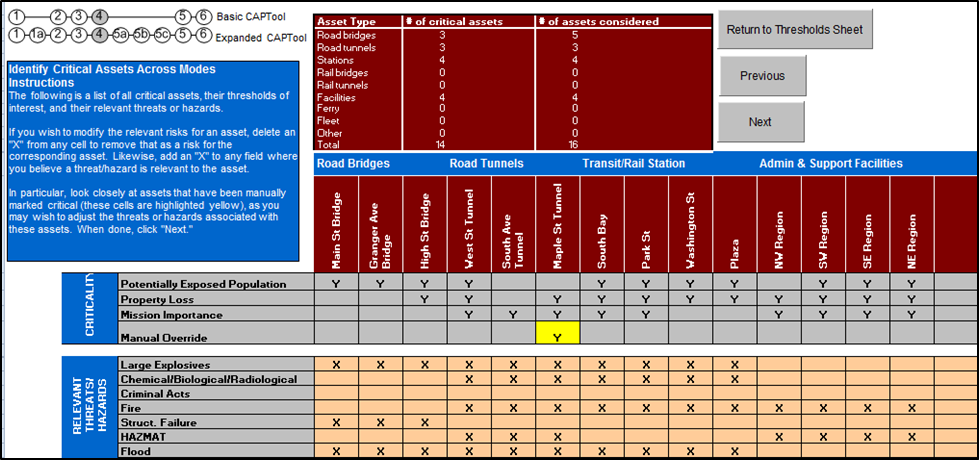
In essence, Step 4 is a summary of the three previous steps: CAPTool identifies the critical assets in each class, and lists the threats the user has selected to evaluate them against. For each asset, CAPTool lists the criticality factor that the asset faces: a potentially exposed population, property loss, and mission importance. CAPTool also identifies those assets that you marked with the manual override option to be included in the analysis.
In addition to summarizing the selections thus far, Step 4 gives you an opportunity to reevaluate some of the decisions and settings until this point. You can select or remove threats from each asset class, and manually override to include assets determined to be critical. If you wish to adjust the consequence thresholds, a shortcut is provided to return to Step 2.
Figure 5. Step 4 displays a summary of your inputs for only critical assets (determined by CAPTool's calculations or by manual override). If you wish to include additional assets, you can return to Step 2 to adjust the consequence thresholds as necessary.
View larger image
In this step, you tailored your asset and threat/hazard selection to more closely match your agency's priorities. For each critical asset or asset group, you reviewed the applicable threats, removing or adding them as necessary. In addition to reviewing assets currently marked as critical, you could choose to include more or fewer critical assets. To do so, you returned to Step 2 and adjusted the consequence thresholds as necessary. You were also able to manually override the criticality determination for a given asset, ensuring that it would be included in the remainder of the CAPTool evaluation.
In this step, you will select a range of potential countermeasures to be included in your budget planning. For each asset, CAPTA has evaluated and embedded the relative effectiveness of each countermeasure in the countermeasure dictionary, against each threat you selected for that asset. CAPTA presents this effectiveness rating, allowing you to select and include those countermeasures. After completing this step, you will have selected a suite of countermeasures to apply to each of your asset groups. CAPTA will record these potential countermeasures and compile a budget summary in the next step.
Step 5 allows you to examine each of your assets in detail. Note which countermeasures are considered most effective against which threats/hazards, and begin to narrow down countermeasure selection to reflect agency priorities. This step will likely be repeated in future iterations of CAPTool. Working through the tool on subsequent iterations will give you an opportunity to refine your initial decisions.
Note: If you are unsure what a specific countermeasure unit represents, hover your mouse over the corresponding cell in Row 26 to see what a unit of that countermeasure represents.
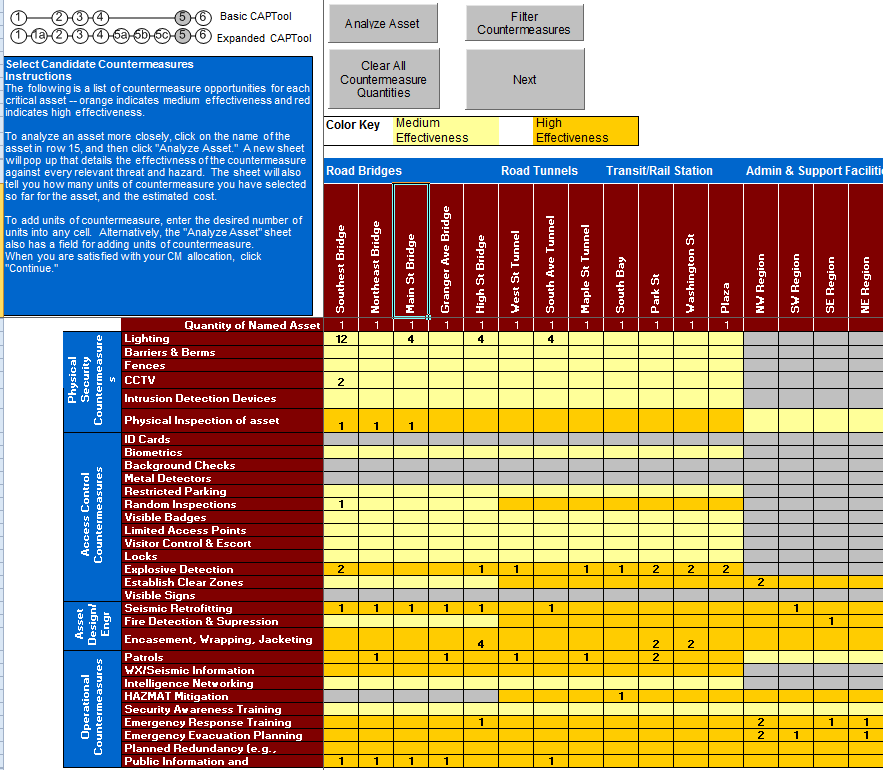
Figure 6. Step 5 displays information about the effectiveness of various countermeasures. After reviewing the assets and countermeasures, select the quantity of each countermeasure that you would like to apply to each asset.
View larger image
Figure 7. In addition to the main Step 5, you may use the optional Asset Analyzer, which provides additional detail and options for each critical asset.
View larger image
In this step, CAPTA provided you with an effectiveness rating for each asset-countermeasure-threat combination, and a price-per-unit for each countermeasure. Based on that information, and your available budget and your own judgment, you selected a suite of potential countermeasures for each of your critical assets. This step completes the CAPTool assessment, and will lead to an evaluation of your results in the next step.
The purpose of this step is to provide the decision maker with a concise summary of consequence-based results and countermeasure combinations across multiple modes of transportation. CAPTool provides a summary report designed for submission and presentation to decision makers. The summary displays the thresholds chosen, results, and the allocation of resources by mode. CAPTool users are encouraged to develop different iterations of CAPTool summaries, each with different consequence thresholds. In effect, it will allow users to observe the impact of different countermeasure selections and display a range of countermeasure alternatives to help decision makers achieve the best results.
There are no user inputs required at this step. The Results Summary displays detailed information about each asset class, including quantities of countermeasures selected, cost subtotals, and a threat/hazard summary. You may also review detailed information about individual asset classes by clicking the asset class buttons in Row 15. Based upon the results shown in the summary, the user has the option to return to Step 5 and edit countermeasure selection, or return to the beginning and:
For more information about using the Expanded version of CAPTool, see Appendix A.
Figure 8. In CAPTool Step 6, you review CAPTool inputs, and a summary of the countermeasure selection and associated expenditures.
View larger image
In Step 6, you were presented with a summary sheet of your selections and the calculations CAPTool has performed. You do not provide any input at this stage, but are instead reviewing your selections and results. The summary sheet displays your selected asset classes, their respective hazards/threats, consequence thresholds, a summary of each asset class (including asset count, countermeasure count, and number of unique countermeasures), and a projected budget summary based on your countermeasure selections. This summary allows you to review your selections, after which you may decide to return to previous steps to make adjustments as necessary, or use the budget estimates to inform further discussions about each asset class.
The purpose of this step is to update your CAPTA assessment as needed. CAPTA and its implementation through CAPTool is a dynamic methodology. Assumptions and assessments that feed into an initial CAPTool analysis can be updated as needed. As stated earlier, CAPTA supports mainstreaming an integrated, high-level, multimodal, risk management process into an agency's programs and activities. An agency can rerun CAPTool when it wants to add or remove transportation assets, update its list of critical assets, or update its assumptions about threats and hazards based on new intelligence or when local conditions change.
Rerun the CAPTool analysis, integrating changes to assets or assumptions about threats/hazards.
In Step 7, you updated an earlier CAPTA assessment based on updated, current conditions.
The Expanded version of CAPTool provides the user with the opportunity to examine and change several factors that are set as default values in Basic CAPTool. These factors are largely concerned with adjusting the CAPTool default values to reflect characteristics associated with analyzing assets and countermeasures under consideration. The Enhanced CAPTool functionality also provides an opportunity for the user to alter cost estimates of countermeasures to reflect local conditions. The user can provide the costs and other factors, which will then be applied by CAPTool to the assets and consequences thresholds chosen by the user.
The Expanded Tool includes:
Table 4. The Expanded CAPTA Methodology (Additional Steps in Yellow).
| A. Identify Assets |
| B. Collect Data |
| 1. Identify Threat/Hazard Asset Classes (Relevant Risk Tab) |
| 1a. Verify High Consequence Threats and Hazards (Threat-Haz Vulnerability Tab) |
| 2. Establish Consequence Thresholds (Thresholds Tab) |
| 3. Describe Infrastructure Assets (Multiple Assets Tabs) |
| 4. Identify Critical Assets Across Modes (Critical Assets Tab) |
| 5a. Review Countermeasure Unit Costs (CM Costs Tab) |
| 5b. Identify and Describe Additional Countermeasures (Additional CMs Tab) |
| 5c. Set Countermeasure Filters Based on User Preference (CM Filter Tab) |
| 5. Identify Countermeasure Opportunities (CM Opportunities Tab) |
| 6. Generate Summary Report (Results Summary Tab) |
| 7. Re-run CAPTool with Updated Assumptions, Budget Realities, or New Assets |
In the Expanded CAPTool, the threat/hazard vulnerability table (Step 1a) comes immediately after Step 1. The purpose of this step is to allow you to customize CAPTool to reflect your perceptions of threats/hazards and their potential consequences. The Basic CAPTool uses default assumptions to match threats/hazards to consequence categories for each asset class; this expanded step allows the user to alter those assumptions and include additional specific combinations of threat/hazard and consequences for CAPTool to evaluate. This process allows you to leverage local knowledge of unusual conditions in the CAPTool analysis, and you may customize CAPTool to evaluate a threat/hazard-asset-consequence class that it otherwise would have ignored.
For example, CAPTool's default settings do not consider Small Explosives as potentially disrupting the Mission Importance consequence for Transit Bridges. Based on knowledge of the assets, the user may change the assumptions that CAPTool makes about threat/hazard/consequence pairings.
Note: CAPTool will only display cells associated with the asset classes and threats/hazards you selected in Step 1. If a given threat/hazard was not marked as relevant for any asset class in Step 1, it will not appear in Step 1a.
Note: you will complete the threat/hazard-consequence category selection for each of the asset classes you selected in Step 1.
Example: To manually mark Earthquakes as capable of causing a Property Loss consequence for any of your Transit/Rail Stations, mark that cell with an “X.”
Figure 9. During CAPTool Step 1a, you are given an opportunity to edit specific threat/hazard/asset risks.
View larger image
In this step, you reviewed the identified specific combinations of threats/hazards and consequences that CAPTool will include in the analysis. Where necessary, you tailored the threat/hazard and consequence pairings for assets of interest, including additional consequences for each threat or excluding consequences you felt were not sufficiently important.
The purpose of this step is to provide you with the ability to supply local cost information for the countermeasures evaluated through the CAPTool analysis. Entering custom cost information in CAPTool provides more accurate estimates in the report summary and allows you to adjust your budgeting estimates based on your knowledge of countermeasures, vendors, and local economic factors.
The Basic CAPTool uses logical cost assumptions based upon information from the RSMeans cost estimating manual, advice from a practitioner, and the experience of the research team. In this step, you can review those assumptions concerning countermeasures cost, and where applicable, change the cost data to more accurately reflect local cost conditions.
Figure 10. During CAPTool Step 5a, you review the descriptions and per-unit cost of each countermeasure in the CAPTA analysis, and may alter the costs to match local conditions.
View larger image
In this step, you reviewed the countermeasure costs that are included in CAPTool. You may have inputted custom costs based on local conditions. Doing so provided you with more accurate costs for the countermeasures you are considering and will result in a more robust Results Summary in Step 6.
The purpose of this step is to allow you to include additional countermeasures in your analysis that are not present in the default countermeasures database.
The Basic CAPTool includes the broad array of countermeasures contained within and recommended by the CAPTA methodology. The countermeasures included have been chosen because of both their applicability to the threats/hazards examined and their applicability to transportation assets. In the Enhanced CAPTool, you can add countermeasures that are not in the CAPTool countermeasure database.
Example: If your custom countermeasure works by Predicting consequences, mark an “X” in the Predict field.
Example: if your countermeasure is an Area-Wide countermeasure, mark an “X” in that field.
Example: If your custom countermeasure is Threat-Responsive, mark an “X” in that field.
Example: If your custom countermeasure is highly effective at protecting Road Bridges from Criminal Acts, mark that field with an H.
Note: To clear your custom countermeasures from this step and start over, click the Clear Entries on Sheet button.
Figure 11. During CAPTool Step 5b, you may enter user-defined countermeasures to include in your analysis.
View larger image
In this step, you added and described additional countermeasures that CAPTool will include in your analysis. These countermeasures will be available to be selected and applied to your critical assets during Step 5 - Identify Countermeasure Opportunities.
The purpose of this step is to allow you to apply filters to the countermeasures contained in the CAPTool countermeasures database, thus limiting the countermeasures available for selection later, in Step 5. The Basic CAPTool displays all countermeasures applicable to threat/hazard-asset combinations. In the Enhanced CAPTool, you may screen the countermeasures so that only those that meet the filtering criteria are displayed. Countermeasures can be filtered by function, implementation, package type, and cost.
Note: You may apply a different set of filters to each asset class.
CAPTool gives you the opportunity to filter the “display all countermeasures applicable to threat/hazard combinations” applied by Basic CAPTool. Countermeasure filters in CAPTool are applied criteria designed to screen measures to achieve a maximum standard of effectiveness. The available criteria are:
These criteria appear along the side of the CM (Countermeasure) Filter sheet.
Figure 12. In CAPTool Step 5c, you can filter the countermeasures available to CAPTool in Step 5.
View larger image
In this step, you entered countermeasure filters that will limit the countermeasure selected to factor into your analysis. By limiting countermeasures to specific functions, implementations, packages, and cost, you are able to tailor your countermeasure selection to best meet the needs of your agency.
The following use case illustrates how a state department of transportation, ZDOT, could use CAPTool to develop a capital budget that would allow it to mitigate the impact of threats/hazards to its critical transportation assets.
ZDOT is a state department of transportation in the western United States. ZDOT's Executive Director, informed by NCHRP Report 525 Costing Asset Protection: An All Hazards Guide for Transportation Agencies (CAPTA), leads an effort to develop a strategy to protect the transportation assets located in the state's largest metropolitan area. The multimodal, multi-asset, and multi-agency strategy, based on the CAPTA methodology, centers on identifying potential events that threaten critical assets and then determining the cost of countermeasures that mitigate the impact of the events if one or more should occur.
ZDOT's Safety & Security office took the lead and coordinated with other offices in the State DOT, as well as offices from other agencies. Members of regional transportation agencies, law enforcement agencies, the state Department of Homeland Security (DHS) office, and others worked together to implement a regional asset protection strategy.
Before beginning the CAPTA methodology, representatives from each agency were contacted and brought on board through CAPTA and CAPTool briefings. Data were collected by each agency for their constituent assets, and the CAPTool process was completed over two collaborative meetings. By combining their CAPTool results with other agencies' results, ZDOT accomplished more than they would have been able to in performing the CAPTA analysis on their own.
Upon completing the CAPTool analysis, ZDOT submitted a joint budget request to the state legislature that identified critical gaps in the region-wide asset protection strategy. ZDOT was able to maximize the effectiveness of each agency's risk mitigation functions while ensuring that the countermeasures and strategies employed by each agency were included in the budget request. The CAPTool analysis provided an objective review of the budget allocations proposed by the agencies, supported by the rigorous and transparent CAPTA Methodology.
The output of the CAPTool process - the Summary Report (Figure 13) - was used by the agency consortium to develop their budget request.
Figure 13. CAPTool Summary Report
View larger image
The following section explains how ZDOT, and its regional partners, used the steps in CAPTool to develop a capital budget aimed at protecting critical regional transportation assets. The budget was based on costs calculated using CAPTool and found on the CAPTool Summary Report.
Initial Steps Performed Outside of CAPTool
For this assessment, each agency identified their key assets separately. Because of the nature of the varied asset classes, each agency had differing criteria for their priority assets. In ZDOT's case, the director asked regional directors to identify assets, based on their judgment, that were critical to maintaining safe levels of service. The region's transit agency, on the other hand, used a list of assets from a vulnerability assessment it recently performed on critical assets. BOTH processes lead to the same output: identification of transportation assets that would potentially merit allocation of additional resources to avoid or mitigate the effects of a threat/hazard event.
This step was also accomplished independently; each agency identified the relevant statistics for each of their respective priority assets. In some cases, the data were taken from national asset inventories; when it was useful to the host agencies, sharing these data sources reduced the difficulty in collecting the data.
Steps Performed in CAPTool
At this point, the agencies came together to begin using CAPTool to analyze their regional assets. In discussing each agency's priority assets, the group identified relevant risks to each asset class. For the first iteration of the CAPTool analysis, the threats/hazards selected were inclusive of each constituent agency's priorities; in subsequent iterations, a more restrictive filter was applied to select those assets that were the most critical to regional transportation operations.
Figure 14. CAPTool Step 1
View larger image
What is happening in CAPTool Step 1?
ZDOT is selecting the collective assets of the agencies that would be affected by threats/hazards.
Explanation of On-Screen Navigation
Although each agency had differing ideas about the necessary consequence thresholds, discussing agency priorities and resources allowed the group to come to compromise for the asset-specific thresholds.
What is happening in CAPTool Step 2?
ZDOT is setting the consequence thresholds for each class of assets. In effect, ZDOT is saying: “Below these thresholds, we can manage the impact of threats/hazards to these assets through our normal operations. But above these consequences, we will consider investments in countermeasures to prevent losses or mitigate consequences.”
Explanation of On-Screen Navigation
Figure 15. CAPTool Step 2
View larger image
During this step, the agencies compiled the list of assets to be evaluated by CAPTool. The data entered here will be assessed against the thresholds entered in Step 2. ZDOT could have also grouped assets under one asset type (for example, all steel continuous Stringer/Multi-beam or Girders or all concrete T-beam). Instead, ZDOT chose to enter individual assets because of the smaller number of assets being evaluated.
What is happening in CAPTool Step 3?
ZDOT is identifying road bridge assets and inputting their characteristics. When done entering, ZDOT clicks the Calculate Criticality button to view the assets that exceeded the thresholds entered in Step 2 and will continue forward for countermeasure assessment.
Explanation of On-Screen Navigation
ZDOT also entered assets into these Asset Sheets:
Figure 16. CAPTool Step 3 (Road Bridges Asset Sheet)
View larger image

Figure 17. CAPTool Step 3 (Road Tunnels Asset Sheet)
View larger image
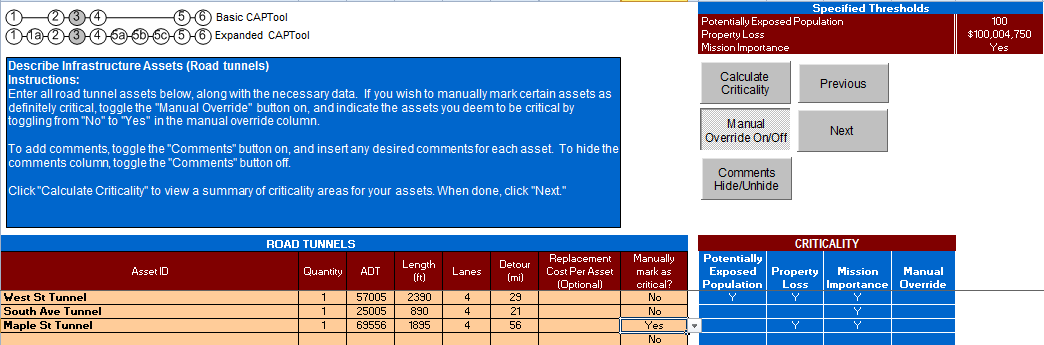
Figure 18. CAPTool Step 3 (Transit/Rail Station Asset Sheet)
View larger image
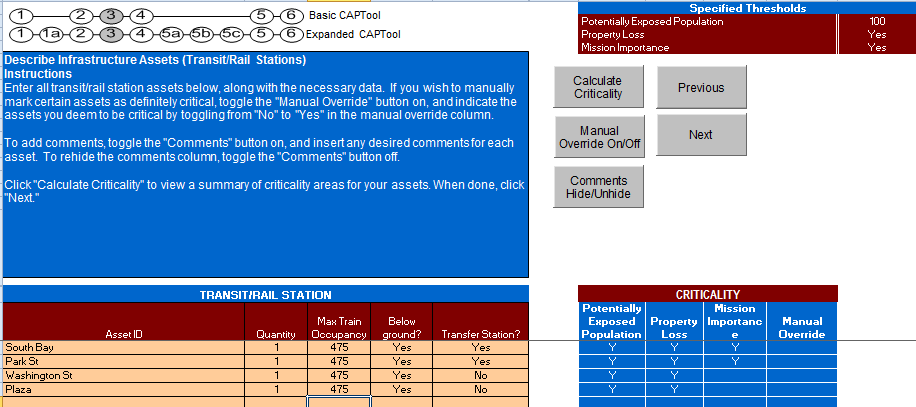
Figure 19. CAPTool Step 3 (Admin & Support Facilities)
View larger image
This step is calculated automatically by CAPTool and appears after you click “Next” on the last Asset Sheet in your analysis. CAPTool displays the assets it identified as critical, based on the consequence thresholds you established for each asset.
What is happening in CAPTool Step 4?
CAPTool is displaying the results of its analysis.
Explanation of On-Screen Navigation
Figure 20. CAPTool Step 4
View larger image
During this step, the agencies worked together to determine their individual budget allocations. After determining the region-wide resource availability, the agencies worked to determine the levels of support that they could offer to each asset. Identifying region-critical and agency-critical assets in Step 4 helped to eliminate conflict stemming from differing priorities. In addition, agencies discussing their mutual resource availability helped to create a collaborative risk management strategy. By identifying existing region-wide risk management procurements, the agencies were able to coordinate their future budgeting to minimize overlap and maximize network connectivity in the event of threats/hazards occurring.
What is happening in CAPTool Step 5?
ZDOT is presented with the list of countermeasures appropriate for the threats/hazards it is considering.
Explanation of On-Screen Navigation
What is happening in CAPTool Step 5 (Asset Analyzer)?
ZDOT is selecting countermeasures that will mitigate the threats/hazards it selected in CAPTool Step 1 (Figure 14).
Explanation of On-Screen Navigation
Figure 21. CAPTool Step 5 (Blank Countermeasure Opportunities Sheet)
View larger image
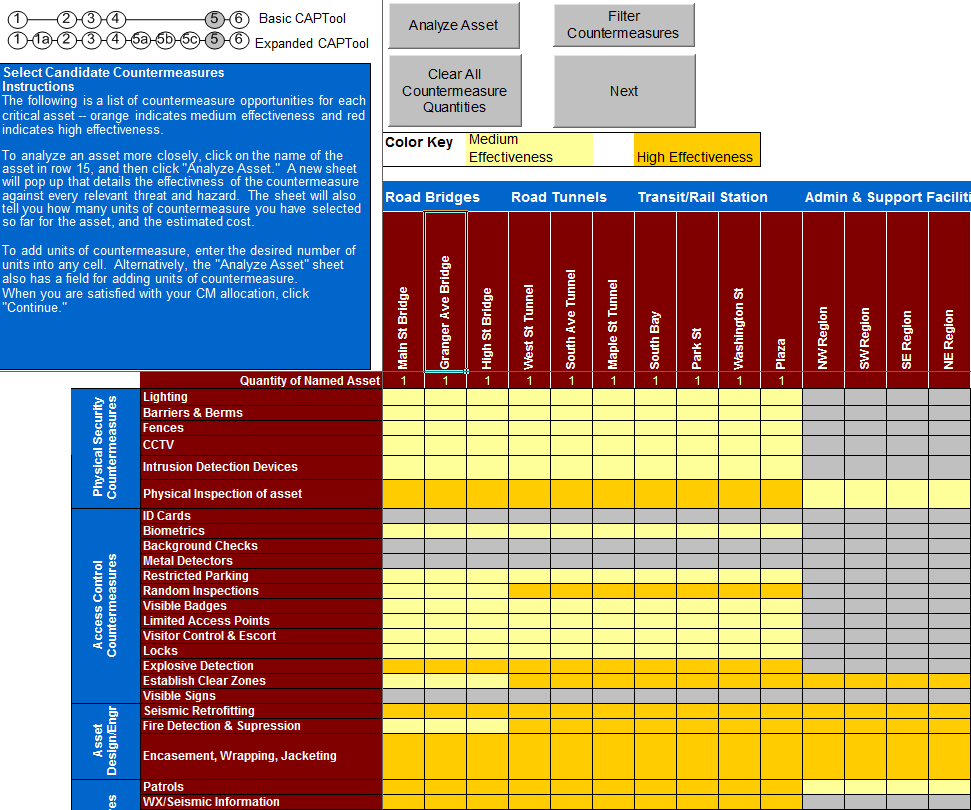
Figure 22. CAPTool Step 5 (Asset Analyzer)
View larger image
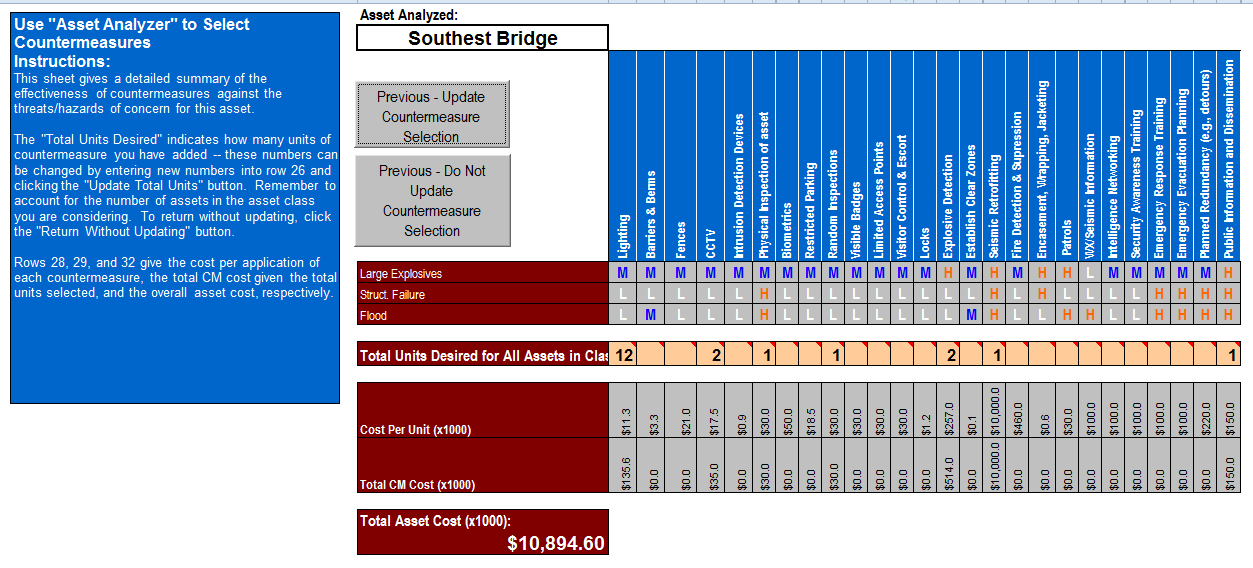
Figure 23. CAPTool Step 5 (Completed Countermeasure Opportunities Sheet)
View larger image
Upon completing CAPTool Step 5, each agency was presented with the CAPTool Summary Report. The report lists the critical assets, selected countermeasures, and a cost estimate of the countermeasures. The summary gave each agency sufficient information to use in its own budget planning process, while also providing a region-wide budgeting perspective that could be used to formulate a consolidated budget request.
What is happening in CAPTool Step 6?
CAPTool generates a Summary Report that provides ZDOT with a concise summary of consequence-based and countermeasure combinations across multiple transportation modes. The report displays assets across the top and then groups content by:
Explanation of On-Screen Navigation
Figure 24. CAPTool Summary Report
View larger image
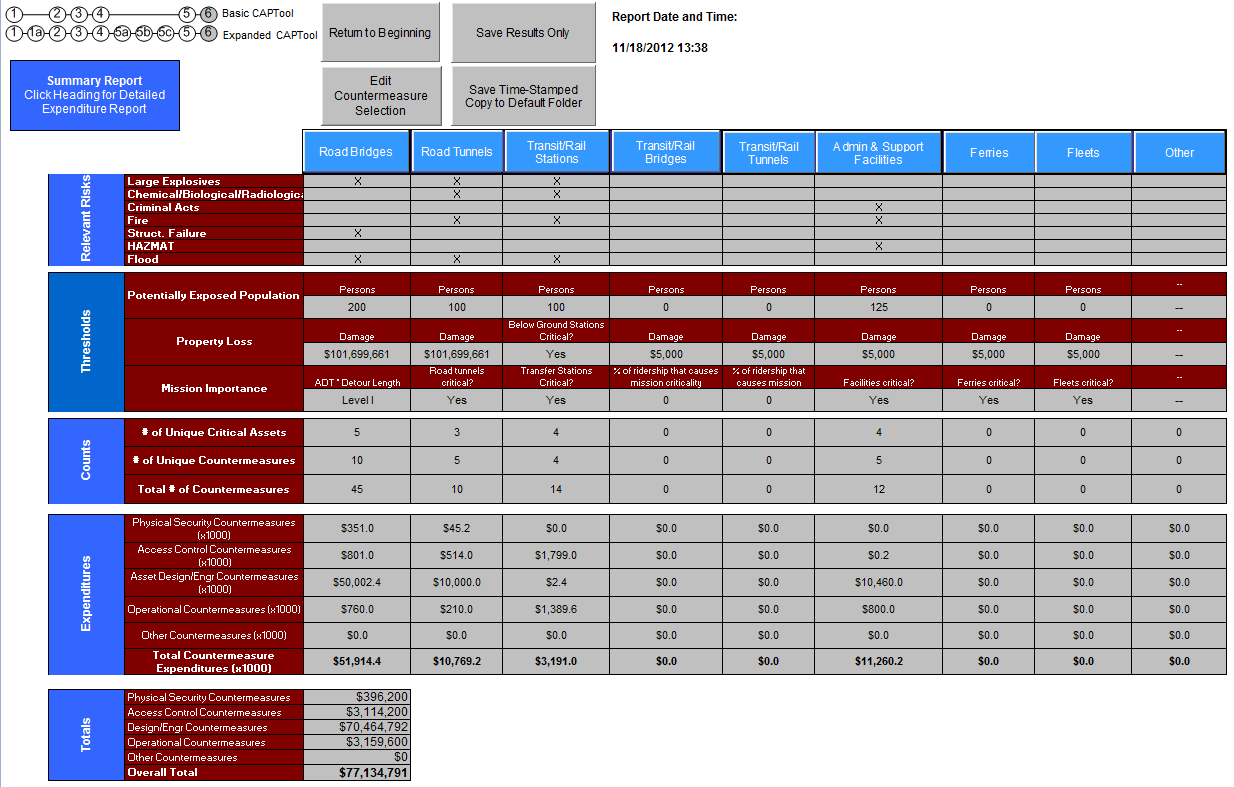
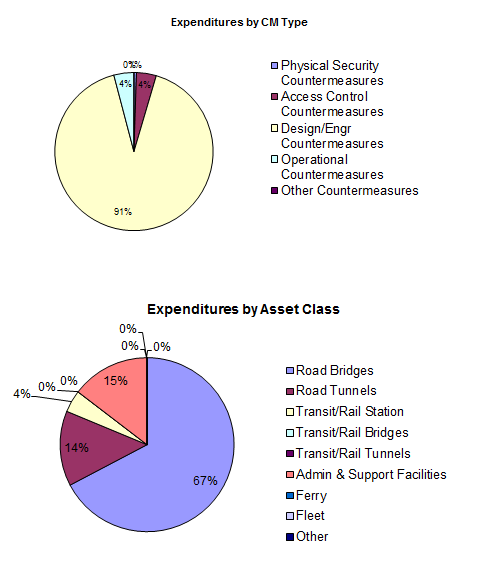
Figure 25. Graphical Depiction of Countermeasures Costs - Generated by CAPTool
At this point, ZDOT decided to re-run CAPTool within their own agency, evaluating only those assets they were directly responsible for. The regionwide perspective provided valuable input to each agency's individual analysis, providing for example information about detour availability and regional hazard risk.
Upon completing the CAPTool analysis, the agency consortium submitted a joint budget request to the state legislature that identified critical gaps in the region-wide asset protection strategy. In this way, they were able to maximize the effectiveness of each agency's risk mitigation functions while ensuring the countermeasures and strategies employed by each agency were included in the budget request. The CAPTool analysis provided an objective review of the budget allocations proposed by the agencies, supported by the rigorous and transparent CAPTA Methodology.
Risk - The quantitative or qualitative expression of possible loss that considers both the likelihood that a hazard or threat will cause harm and the consequences of that event.
Assets - Persons, facilities, activities, or physical systems that have value to the owner or society as a whole.
Threat/Hazard - The potential natural event or intentional or unintentional act capable of disrupting or negatively impacting an asset. In the case of natural events, the hazard is the frequency and magnitude of a potentially destructive event. Hazards can be expressed in probabilistic terms where data are available.
Consequences - The loss or degradation of use of an asset resulting from a threat or hazard. Consequences may also be determined injuries or fatalities (casualties). Mission-related consequences include destruction or damage causing real loss or reduction of functionality. Potential for consequences grow as a function of an asset’s criticality. However, a critical asset may be damaged without total loss of functionality.
Vulnerability - A weakness in asset design or operations that is exposed to a threat/hazard or can be exploited by a threat/hazard resulting in negative consequences. Specific hazards or threats may expose or exploit different vulnerabilities. Note that an asset may be susceptible to hazards or threats that may increase its vulnerability, such as having publicly accessible information (e.g., drawings, schedules, secure areas) that could assist a terrorist in planning and executing a successful attack.
Consequence Threshold - The planning factor used to set the level of consequences at which the decision maker or agency assumes greater responsibility for managing the risk.
Potentially Exposed Population (fatalities and injuries) - This consequence is concerned with the number of people who may become casualties. Occupancy limits, or capacity, is a surrogate data point for this category.
Property Loss - This concerns the cost to repair or rebuild a damaged or destroyed structure. These monetary estimates are standardized unit cost estimates based upon square or linear footage of an asset, or an amount provided by the user for special designed structures such as a cable stay bridge.
Mission Disruption - This concerns the adverse impact on the transportation system due to the loss of the functionality of an asset. Implying the redundancy of the road and rail networks, detour lengths to and from a disabled asset are used as a surrogate for mission disruption level. Detour length is readily available in current agency databases for bridges and tunnels. Transit facilities are assessed using ridership levels of an asset.
Social/Cultural Disruption - The social consequence reflects how the population might respond to the event through significant behavioral changes. These may include fear of travel or avoidance of a transportation mode or route. Fear and avoidance of transportation modes will lead to a decrease of commercial activity. There may also be adverse reaction by the public to the imposition of security measures, such as personal searches, needed to prevent a disruption or mitigate the effects of a disruption.
Note: During CAPTool Step 3, you may enter custom assets outside of these eight default classes.
Road Bridges - Any aerial structure designed to carry vehicular traffic across a body of water or land. This category is most effective when used to capture structures whose length spans greater than one beam.
Road Tunnels - All tunnels bored, mined, or immersed that convey rubber tire vehicles, buses, and trucks.
Transit/Rail Bridges - All raised aerial structures designed to carry rail rolling stock.
Transit/Rail Tunnel - A transit system with a major rail capability is likely to have an extensive network of tunnels.
Transit/Rail Station - Classes of access rail transit points in CAPTA. Length of platform, capacity, and building type can serve as common characteristics for a class.
Administrative and Support Facilities - Fixed asset facilities a transportation operator may own or operate, with the exception of transit or rail stations. The fixed facilities in this category may range from offices of executives, to airside passenger terminals.
Ferry - All watercraft used in the regulated transportation of passengers and vehicles for a scheduled service. The size of the vessel does not matter. In the rare cases where ferries constitute a significant portion of the transportation agency's passenger capacity, an effort should be made to separate the vessels into classes.
Fleet - Regularly used individual passenger vehicles. The most common assets in this category will be buses and passenger transit/rail cars. The base unit for this category is one asset, whereby a train may consist of four to six individual fleet cars. The similarities of fleet vehicles readily lend themselves to groupings into classes.
Asset Group - User-specified groups of similar assets in a given asset class, combined to simplify data collection, entry, and analysis during CAPTool Step 3.
Small Explosive Devices - Explosive materials containing less than 250 pounds of TNT or equivalent. Delivery is by means of one to five aggressors transporting the payload.
Large Explosive Devices - Explosive materials containing greater than 500 pounds of TNT or equivalent. The method of delivery is either by vehicle or through multiple persons acting in concert to transport the payload.
Chemical/Biological/Radiological (C/B/R) agents - Gases, liquids, or solids introduced with the intent of causing physical harm or property loss.
Criminal Acts - Lower intensity threats representing the range of illegal activities as defined by federal code, state statute, or local ordinance. Examples of criminal acts include handgun violence and illegal discharge of hazardous waste.
Fire - Sources may be disparate and triggered by any combination of flammable material and ignition. Fire may result from happenstance and does not require an intentional act to occur.
Fire, or the pre-fire hazard of smoke, will immediately have a negative impact upon all transportation assets by inducing the evacuation of persons and equipment within the structure and surrounding areas. Fire and smoke will decrease visibility to unsafe levels, precipitate collision of vehicles and equipment, and cause personal injury. A fire controlled by firefighting may still result in smoke and water damage at a level sufficient to render a transportation asset unfit for use or occupancy.
Structural Failure - Any decrease in the physical integrity of the transportation asset to bear the weight required to carry passengers or freight. The loss of physical integrity requires that the asset be inspected and major repair completed prior to its reopening for beneficial use by the public.
Hazardous Materials (HAZMAT) - Liquid, solid, or gaseous materials for which the quantity of material introduced may be minimal but that cause a hazard to users of the system. Hazardous materials include common industrial cleaners used by transportation workers and canisters of pepper spray set off by transit users. In both circumstances, it is unlikely that the maintenance worker or the commuter entered the transportation system with the intent of discharging material into the air. Materials may also include hazardous liquid, such as debris or waste products moved into the transportation system by a vehicle, truck, or rail car. For CAPTA purposes, hazardous materials require specialized remediation that will close a roadway or transit transportation to allow processing.
Flooding - The condition of excessive water inflow to an asset exceeding the engineered pumping capacity, and causing a hazard or threat to people and property. Flooding is typically caused by a calamitous weather event; however, it may be caused by defective pipeline transfer.
Earthquake - A seismic anomaly that weakens the fitness of a structure to standards less than that designed and intended by the owner. The earthquake will present a hazard to transportation users while it is occurring, due to flying debris and geotechnical instability. The earthquake may present a hazard upon its conclusion by weakening assets such that they are no longer usable.
Extreme Weather - All means and methods of extreme wind, rainwater, snow, ice, or other act of God that is unusual for its ferocity. An extreme weather event will be characterized by the exhaustion of all available equipment previously assembled for remediation and the exceeding of all planning thresholds in place at a transportation agency for the conditions of snow, ice, wind, water, and other acts of God. This characteristic would normally include exceeding the “100-year storm” guidance gathered through observation.
Mud/Landslide - The sudden massive movement of soil causing actual or potential harm to person and property, prompted by water or geotechnical shift. The most common historical data in this category involves soil shifts onto roadways or rail facilities because of wet conditions.
A critical determination in CAPTA is the capacity of an asset to exceed the threshold consequence levels determined by the user. Displayed in Table 3, and implemented in CAPTool, these consequence thresholds are surrogates and equations used to determine if an asset or asset category exceeds the threshold and will be included in further analysis as a high-consequence asset.
Table 5 THRESHOLD CONSEQUENCE DETERMINATION
| Asset Class | PEP Equation | Property Equation | Mission Equation |
|---|---|---|---|
| Road Bridges | Separated into primary direction and secondary direction -- for each, if vehicles/lane > 2400, assume 40 vehicles/ 1000ft. Otherwise assume 7.5 vehicles/1000 ft. a | $20,000/lf | (ADT) (detour length) 75th, 85th, 95th percentile as thresholds relative to typical bridge inventory (Example is based on the National Bridge Inventory) |
| Road Tunnels | Separated into primary direction and secondary direction—for each, if vehicles/lane > 2400, assume 40 vehicles/ 1000 ft. Otherwise assume 7.5 vehicles/1000 ft. a | $100,000/lf | User Input for criticality |
| Transit/Rail Station | 4 x (maximum capacity of rail cars) b | Below ground = critical | User input if transfer station is critical |
| Transit/Rail Bridge | 2 x (maximum capacity of rail cars) b | $15,600/lf | User input percentage of ridership that regularly use this transit/rail transportation asset |
| Transit/Rail Tunnel | 2 x (maximum capacity of rail cars) b | $40,000/lf | User input percentage of ridership that regularly use this transit/rail transportation asset |
| Administrative & Support Facilities | 1 person/175 sq. ft. c | $210/sq. ft. | Never critical unless so designated by user |
| Ferries | Maximum capacity of ferry | User input | Never critical unless so designated by user |
| Fleets | Maximum occupancy of one fleet vehicle | Average cost per vehicle x maximum number of vehicles | Never critical unless so designated by user |
a Derived from the Highway Capacity Manual. TRB, National Research Council, Washington, DC, 2000
b Derived from NFPA 130: Standard for Fixed Guideway Transit and Passenger Rail, National Fire Protection Association, Quincy, MA, 2007
c Derived from NFPA 101: Life Safety Code, National Fire Protection Association, Quincy, MA, 2006
This tool provides for a consequence-based assessment across multiple modes of transportation assets. It is an initial tool for high-level budgeting decisions, providing a platform where all modes are compared on equal footing. This tool allows for an iterative process where the user can return to the beginning of the model and plot different threshold variables. Opportunities are available at Step 1 and Step 6 in the tool to save your work to your hard drive.
If you do not see a dialogue box when you open the file, you will need to make sure that your macro security level is set to Medium. To do this, follow these steps:
You are now ready to use CAPTool.
These following three scenarios are presented to help agencies learn how CAPTA can assist them in assessing the threats and hazards to critical infrastructure and identifying and budgeting for countermeasures to those threats.
Although CAPTA is best used as a multimodal evaluation tool, one agency made use of the CAPTA methodology to analyze a specific asset class. Before performing their agency-wide, multimodal analysis, the agency started by evaluating their bridges with CAPTool, compiling priority lists of its top 10 assets in each of the agency's eight districts.
For each district, a lead engineer evaluated assets in that district using CAPTool, identifying critical priorities and developing countermeasure recommendations. Staff in each district reviewed several iconic bridges, which make up critical links in the transportation network, as well as bridges that provide necessary evacuation routes, routes to hospitals, major commuting thoroughfares, and additional inter-city connectivity. District staff provided recommendations to agency leadership for further review, which were then discussed and reworked in a group setting with each of the district engineers. Using CAPTool summary reports to guide the conversation, the assets and requirements in each district were easily compared and the agency's leadership gained valuable insight about their available resources. The agency was able to identify critical assets within each district and utilize those selections in the remainder of the agency's CAPTA process, resulting in more robust risk mitigation overall.
CAPTA Steps - Outside of CAPTool
Step A: Prioritize Assets
For this step, the agency assigns district managers with the task of identifying each of the top 10 critical bridges in their respective district. Some of the managers used a vulnerability assessment to accomplish this quantitatively, while others used their subjective judgment to identify their priority assets. In all cases, local knowledge of the assets evaluated enabled the CAPTA review to proceed smoothly. Bringing staff onboard from multiple offices, including members of the Structures and Traffic Operations groups, provided in-depth familiarity with the assets under review.
Step B: Collect Data
After identifying priority assets in each district, a district manager collected the relevant data for each of their selected priority assets. For road bridges, CAPTool requires that users provide quantity (in the case of grouped assets), annual average daily traffic, length, travel lanes, detour length to nearest available crossing, type of construction, and replacement cost if known. Most of these data were readily available in existing inventories and reports, but where necessary, the managers consulted with field staff to acquire the necessary data.
CAPTool Steps
Step 1: Identify Threat/Hazard Asset Classes
Because this agency started by analyzing only bridges, they did not need to select asset classes. To determine relevant threats/hazards, each manager evaluated their priority list and selected those threats and hazards they considered to be a risk. Knowledge of local conditions surrounding the assets, such as proximity to waterways that could contribute to flooding, contributed to this process. Agency staff completed a robust and detailed evaluation of the potential risks facing the agency's assets.
Step 2: Establish Consequence Thresholds
The district managers collaborated to determine the consequence thresholds to enter into CAPTool. Their experience with their own district's resources and assets was invaluable in determining this information. The consequence thresholds deemed acceptable varied, but by collaborating and discussing agency priorities, consensus was reached to identify the absolute thresholds to be evaluated.
Step 3: Describe Infrastructure Assets
For each district, assets were entered into CAPTool after being combined into asset groups for easier entry. The data entered here had been previously collected in Step B, and comprised a rich tapestry of information about the assets and their importance to the regional transportation network.
Step 4: Identify Critical Assets Across Modes
After the asset data were entered, CAPTool determines asset criticality; at this point, district reviewed the critical asset list to identify gaps in the list. In some instances, district managers requested that certain assets be marked for manual override. For example, although the consequence thresholds indicated that several rural bridges were not critical, the bridges make up the only evacuation route available to several communities, and were thus manually marked for inclusion in the CAPTool analysis.
Step 5: Identify Countermeasure Opportunities
For this step, district managers worked individually, taking turns to evaluate the assets they were responsible for using the Asset Analyzer. For the first iteration of CAPTool, managers entered their countermeasure selections assuming a best-case prediction, detection, and deterrence mitigation strategy. The selected countermeasures in this first iteration included patrols, closed-circuit security camera installation, motion-detection, and access control measures. In future iterations, after agency-wide budgeting and priority conversations, countermeasure selection was updated to shift toward an interdiction- and response-focused strategy.
Step 6: Generate Summary Report
After completing the countermeasure selection, the district managers reviewed the summary report generated in Step 6 to verify that the information reflected was accurate. The Results Summary was saved and used to inform an agency-wide budget report. By compiling bridge summary data for the entire state, the agency was able to identify the most cost-effective mitigation strategies to implement.
Step 7: Re-run CAPTool based on Updated Assumptions, Budget Realities, or New Assets
After the first iteration of the CAPTool analysis, district managers identified several gaps in criticality and risk evaluation. Re-running the CAPTool with these new findings allowed them to refine their assessment to more closely match agency-wide priorities and available resources.
In this state Department of Transportation, the Safety & Security office has coordinated with other offices in the State DOT, as well offices from other agencies. Members of regional transportation agencies, law enforcement agencies, the state DHS office, and others worked together to implement a regional asset protection strategy. Upon completing the CAPTool analysis, this agency consortium submitted a joint budget request to the state legislature which identified critical gaps in the region-wide asset protection strategy. In this way, they were able to maximize the effectiveness of each agency's risk mitigation while ensuring that the countermeasures and strategies reflected each agency's secutiry priorities. The CAPTool analysis provided an objective review of the budget allocations proposed by the agencies, supported by the rigorous and transparent CAPTA Methodology.
Before beginning the CAPTA methodology, representatives from each agency were contacted and brought on board with CAPTA and CAPTool briefings. Data were collected by each agency for their constituent assets, and the CAPTool process was completed over a series of collaborative meetings. By combining their CAPTool results with other agencies’ results, the state DOT accomplished more than they would have been able to in performing the CAPTA analysis on their own.
CAPTA Steps - Outside of CAPTool
Step A: Prioritize Assets
For this assessment, each agency identified their key assets separately. Because of the nature of the varied asset classes, each agency had differing criteria for their priority assets.
Step B: Collect Data
This step was also accomplished independently; each agency identified the relevant statistics for each of their respective priority assets. In some cases, the data were taken from national asset inventories; when it was useful to the host agencies, sharing these data sources reduced the difficulty in collecting the data.
CAPTool Steps
Step 1: Identify Threat/Hazard Asset Classes
At this point, the agencies came together to begin using CAPTool to collectively analyze their regional assets. In discussing each agency's priority assets, the group identified relevant risks to each asset class. For the first iteration of the CAPTool analysis, the threats selected were inclusive of each constituent agency's demands; in subsequent iterations, a more restrictive filter was applied to select relevant risks.
Step 2: Establish Consequence Thresholds
Although each agency had differing ideas about the necessary consequence thresholds, discussing agency priorities and resources allowed the group to come to compromise for the asset-specific thresholds.
Step 3: Describe Infrastructure Assets
During this step, the constituent agencies worked together to combine their assets into groups. Because of the wide geographic spread of the regional assets, grouping the assets reduced the complexity of the analysis. Each agency had already collected and compiled asset-specific characteristic data, making this step easier to complete.
Step 4: Identify Critical Assets Across Modes
Upon reviewing the assets identified by CAPTool as critical, the agencies decided to re-evaluate their consequence thresholds and returned to Step 2. By adjusting the consequence thresholds to suit regional goals, the critical asset list was refined to more closely match regional priorities.
In addition to the region-wide criticality assessment, each agency performed a criticality assessment of its own assets. This allowed agencies to more fully understand their own priorities, which helped determine region-wide priorities and generate a more realistic and nuanced critical asset list. In particular, some agencies felt that the thresholds established region-wide were too high, and by reviewing their own asset list, were able to include additional critical assets in the region-wide analysis that would otherwise have gone unnoticed.
Step 5: Identify Countermeasure Opportunities
During this step, the agencies worked together to determine their individual budget allocations. After determining the region-wide resource availability, the agencies worked to determine the levels of support that they could offer to each asset. Identifying region-critical and agency-critical assets in Step 4 helped to eliminate conflict stemming from differing priorities. In addition, agencies discussing their mutual resource availability helped to create a collaborative risk management strategy. By identifying existing region-wide risk management procurements, the agencies were able to coordinate their future budgeting to minimize overlap and maximize network connectivity in the event of hazards occurring.
Step 6: Generate Summary Report
Upon completing CAPTool step 5, each agency reviewed the report generated in Step 6. The asset-specific countermeasure summary gave each agency sufficient information to use in its own budget planning process, and the region-wide summary provided information for agencies to communicate with each other about their respective budgeting decisions.
Step 7: Re-run CAPTool based on Updated Assumptions, Budget Realities, or New Assets
At this point, the agencies used the region-wide asset and countermeasure summary to re-run CAPTool within their own agency, evaluating only those assets they were directly responsible for. The region-wide perspective provided valuable input to each agency's individual analysis, for example, providing information about detour availability and regional hazard risk.
Another transportation agency has fully integrated the CAPTA methodology into their planning and risk evaluation processes. After a preliminary round of the CAPTA analysis, using CAPTool, the agency continues to use CAPTA to inform their planning and budgeting decisions. This has helped their internal processes by streamlining agency-wide asset review, and providing a robust and objective foundation for budget allocation decisions. The agency attributes some of their recent successful high-level risk management plans to CAPTA's integration with their existing budgeting and planning analysis tools.
In addition, the agency continues to use CAPTA on an ongoing basis, periodically producing an updated CAPTool results summary. Furthermore, each time an asset is added or removed from the agency's priority list, they utilize the CAPTool countermeasure selection steps to inform their budgeting requests, ensuring that their capital budgeting is in alignment with their risk mitigation strategies.
CAPTA Steps - Outside of CAPTool
Step A: Prioritize Assets
This agency used an external method to identify a list of priority assets. Because CAPTool requires similar data to other asset management and analysis systems, it was very easy for the agency to use CAPTool in conjunction with its other asset analysis methods.
Step B: Collect Data
As the data necessary to perform the CAPTA analysis had already been collected for other asset management systems, there was very little overhead to assemble the data necessary for CAPTool. In general, agencies find that the data requirements for CAPTA and CAPTool are comparable to other asset analysis tools and consist of available or easily-obtained data.
CAPTool Steps
Step 1: Identify Threat/Hazard Asset Classes
This agency used the vulnerability assessment performed in Step A to identify relevant asset classes. Working closely with departmental heads, the agency's management staff identified threats and hazards relevant to each asset class.
Step 2: Establish Consequence Thresholds
Managers identified the consequence thresholds for each asset class by discussing the agency's priorities and evaluating current resource availability.
Step 3: Describe Infrastructure Assets
The agency entered the asset data collected in Step B into CAPTool in this step. With the data easily available from other sources, the agency did not need to spend additional time or resources collecting it. Even in circumstances where the data is not immediately available, agencies find that collecting the necessary data for each asset and assembling assets into groups takes minimal staff time.
Step 4: Identify Critical Assets Across Modes
Once CAPTool had identified critical assets, the agency reevaluated the consequence thresholds identified in Step 2. Knowledge of the conditions surrounding the assets allowed agency staff to identify several key assets that had been overlooked in the original criticality determination. For example, an interstate highway interchange located near a major passenger rail station did not qualify under the ADT and cost thresholds, but nonetheless is essential to the regional transportation network. This and other assets were included in CAPTool by overriding the criticality calculations performed by CAPTool, improving the overall usefulness of the analysis.
Step 5: Identify Countermeasure Opportunities
At this step, the agency selected countermeasures based on their existing vulnerability assessments and the criticality determination CAPTool generated in Step 4. The assets selected for priority mitigation were evaluated against the agency's budget availability and provided levels of support based on agency priorities. For some of the critical assets, the agency had already considered various countermeasures during previous risk evaluation. These countermeasures had been determined ineffective for this region, and were filtered out of the analysis.
Step 6: Generate Summary Report
The agency uses the summary report generated in Step 6 to inform its other budgeting procedures, and the CAPTool results provide valuable baseline information to support resource allocation decisions when necessary. As the countermeasure selections are based on agency priorities, resource availability, and asset criticality, the summary report provides a neutral and data-based view of the agency's goals and existing asset protection strategies.
Step 7: Re-run CAPTool Based on Updated Assumptions, Budget Realities, or New Assets
The agency continually updates the CAPTool analysis as assets are identified to be more or less critical, and when new large-scale infrastructure is constructed. The agency also preserves existing CAPTool reports to be used as budget snapshots for future retrospective analyses. As each major asset is added or removed, or as budget availability changes, the agency re-runs the CAPTool analysis to recalculate critical assets and update the summary report for future budgeting decisions.

