

| << Previous | Contents | Next >> |
Avoiding Utility Relocations
Appendix D: Utility Permit Management
Technology —Making Public Works Work Better 2001 Conference
May 6-8, 2001 - Rosemont, IL
Held jointly by URISA & PWJC
By
Cesar Quiroga, Ph.D., P.E.
Associate Research Engineer
Texas Transportation Institute, Texas A&M University System
3500 NW Loop 410, Suite 315
San Antonio, TX 78229
Phone: (210) 731-9938
Fax: (210) 731-8904
E-mail: c-quiroga@tamu.edu
Christopher D. Ellis, Ph.D.
Assistant Professor
Department of Landscape Architecture and Urban Planning
Texas A&M University
31 1A Langford Architecture Center
College Station, TX 77843
Phone: (979) 845-1019
Fax: (979) 862-1784
E-mail: ellis@taz.tamu.edu
ABSTRACT. Many transportation agencies lack a system-wide capability to capture and inventory utility facilities and the ability to document and display those facilities in reference to existing and proposed transportation improvements. This handicap also limits the agencies' capability to manage a variety of utility-related procedures such as utility permit applications. This paper describes a geographic information system (GIS)-based model to represent utility facilities located within a highway right-of-way (ROW) and associated attribute data such as ownership, purpose, size, type, and other pertinent characteristics. The paper also describes an Internet-based utility permit data entry and data management system that provides selective access to different users within either transportation agencies or utility companies. The data management system is centralized with distributed map and data access capabilities. The system includes utility company interfaces and administrative interfaces.
KEYWORDS: GIS, utilities, Internet, right-of-way, ROW
INTRODUCTION
Many transportation agencies lack a system-wide capability to inventory utility facilities and the ability to document and display those facilities in reference to existing and proposed transportation improvements. This handicap also limits the agencies' capability to manage a variety of utility-related procedures such as permit applications.
Utility data management practices at transportation agencies and utility companies frequently vary widely, making the data management process very difficult. For example, many utility companies have implemented sophisticated automated mapping/facility management (AM/FM) information systems over the years. By contrast, other utility companies follow a very informal approach to asset management and have very limited spatial data management capabilities. Utility companies tend to be specialized, and so do existing AM/FM information systems and data models (1) (2). In the field, however, there is considerable interaction among utilities. For example, telephone lines, data communication lines, and cable TV lines are frequently anchored to electric poles. Likewise, duct bank underground installations can carry several types of utilities.
Normally, a utility company is required to submit a permit application every time the company needs to do work on a utility facility within the highway ROW. At TxDOT, for example, utility companies need to document the proposed work and attach drawings to illustrate the location and characteristics of that work. However, because of the different types of utilities and utility companies with which TxDOT may be involved, there is a wide range in the quantity and quality of the data, e.g. attribution data, map symbology, terminology, and geo-referencing data, provided by the utility companies. This situation affects TxDOT's ability to maintain an up-to-date, reliable utility data management system.
This paper describes the architecture of a prototype utility data spatial and database model. First, a geographic information system (GIS)-based inventory model to document utility facilities and associated attribute data such as ownership, purpose, size, and type is described. Second, a prototype Internet-based utility permit data collection and data entry system is discussed.
SPATIAL MODEL
From the standpoint of a transportation agency, linearly referencing utility features, i.e. defining the parameters to completely characterize the relative position of utility features along highway networks, is important. TxDOT, for example, uses both a control section-distance approach and a reference marker-distance approach for linearly referencing objects or events along the state highway network. With the control section-distance approach, the state highway network is divided into controls and sections, and objects or events are located by determining their relative distance with respect to the beginning of the specific section. Practically all construction projects in the state are tied to the control section-distance model and many districts use this model to locate utilities within the ROW. With the reference marker-distance approach, the state highway network is divided into routes, and objects or events are located by determining their relative distance from one or more reference markers that are physically located at strategic locations on all state highways.
As a base map, TxDOT uses a highway centerline map that was originally digitized using 1:24,000 USGS 7.5' quadrangle maps. The positional accuracy of this centerline map is estimated as being 3 0-60 m (100-200 ft). Unfortunately, this level of positional accuracy, in addition to a lack of geometric detail which is critical in the case of complex geometries such as freeway interchanges and ramps, means that a variety of applications, including utility data management, cannot be properly supported. To address these limitations, TxDOT is developing a new sub-meter level roadbed centerline base map. With the new base map, each roadbed will be characterized by a directional linear feature that represents the roadbed centerline. Each ramp or direct connector will have its own roadbed centerline and each direction of travel (in the case of divided highways) will have its own roadbed centerline. Each roadbed centerline will be divided into 10-20 km (6-14 mi) long segments running between latitude and longitude-fixed anchor points. Each segment will be measured, meaning that each vertex used to characterize the horizontal alignment of the segment will also contain a numerical value equal to the cumulative distance from the beginning of the segment.
To ensure compatibility both with the current and the new road base map, a utility data model has been developed in which utility features can be located and inventoried independently of the road base map used. However, with the model it is possible to overlay utility features on either map to obtain linearly referencing measures. Figure 1 illustrates the concept. Assume a telephone pole located on the north side of Bandera Road in San Antonio, TX, has been inventoried using a sub-meter level global positioning system (GPS) receiver. The telephone pole point feature overlays the new sub-meter level roadbed centerline map. Using GIS linear referencing functions, it would be possible to determine the relative position of the point feature with respect to the beginning of the westbound Bandera Road roadbed centerline segment. Linear referencing measures could also be obtained with respect to the current 1:24,000 centerline map (dotted lines in Figure 1). These linear referencing measures would be different, however, the underlying latitude-longitude coordinates associated with the telephone pole point feature would remain unchanged.
Figure 1. Utility feature overlaying roadbed centerline map (dotted lines represent current 1:24,000 centerline map)
In the model, a utility feature refers to a physical space occupied by the feature (this physical space is in 2-D; utility stacking is handled at the feature user level, as explained in the following section). Utility features can be either point features or linear features. Point features have only one X, Y coordinate pair, whereas linear features can have several X, Y coordinate pairs associated with them depending on the number of vertices used to determine the feature horizontal alignment. Each feature is assigned a unique ID that remains with the feature as long as the X, Y coordinates associated with the feature remain the same. In general, linear features begin and end at point features.
DATABASE MODEL
The database model includes feature descriptors and process descriptors. Feature descriptors refer to spatial and non-spatial attributes used to characterize individual utility features. Process descriptors refer to attributes used to characterize business procedures such as utility permits, utility adjustment agreements, and leases. For brevity, this paper only includes basic feature descriptors and some of the descriptors involved in the utility permitting process.
Feature Descriptors
Figure 2 shows some of the elements of the feature attribution scheme developed. Notice that UtilityClass describes the overall group under which a utility facility can be classified following the American Public Works Association (APWA) Uniform Color Code standard (3). Likewise, UtilitySubClass describes a utility subclass used to further characterize the function of a specific utility feature.
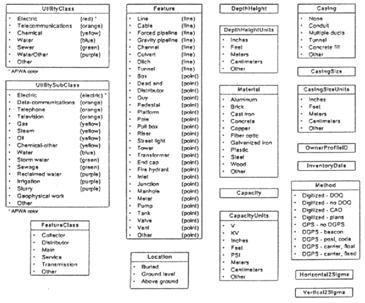
Figure 2. Characterization of utility linear features and point features
In the database, there is a distinction between features, feature events, and feature user events (Figure 3). As mentioned previously, each feature has a unique ID that remains with the feature as long as the X and Y coordinates associated with the feature remain the same. Basic feature attribution is thus given in terms of data that can be used to locate the feature on the ground or by using GIS linear referencing capabilities. Feature events refer to physical changes that affect the feature throughout its lifetime. Examples of possible feature events include changes in geometry (that do not involve changes in X, Y coordinates), changes in physical characteristics, and changes in feature ownership. For example, if a wooden utility pole has been replaced with a metal one, the change would be handled as a feature event. Each feature event is time stamped.
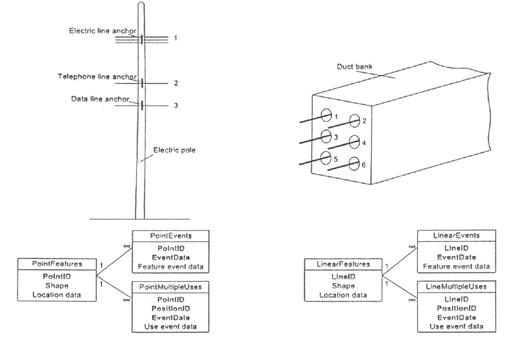
Figure 3. Features, feature events, and feature user events
Feature user events refer to changes that affect one or more feature users. By default, every feature is assumed to have at least one user. However, it is possible for a feature (point or linear) to have multiple users. For example, utility poles (which may be owned by an electric utility company) are frequently used to anchor electric utilities, telephone utilities, and data communication utilities. In the database, each of these utilities would be considered a separate user of the utility pole feature. Likewise, duct banks (which may be owned by a utility company or by a transportation agency such as TxDOT) typically carry various types of utilities. In the database, each of these utilities would be considered a separate user of the duct bank feature. Notice that each user is assigned a position ID within the feature. The position ID remains fixed and is considered a feature attribute.
The linear physical space between two adjacent utility poles is considered a linear feature. By default, the owner of this linear feature would be the primary —or first user of the feature (ownership refers to the feature, not the right-of-way, which belongs to the transportation agency). For example, if the poles were originally installed by an electric utility, the space between the poles is normally occupied by electric lines. This would make the utility company the primary user of the linear feature. However, not necessarily the feature owner is also a feature user. For example, TxDOT is considering the installation of duct banks along several corridors on the state highway network. Under one of the scenarios considered, TxDOT would own the duct banks but would lease the use of the ducts to individual utility companies.
Utility Permitting Process Descriptors
Associated with the spatial model and feature descriptors shown in Figures 1, 2 and 3, a business process database prototype was developed. A simplified version of the utility permit database schema is shown in Figure 4.
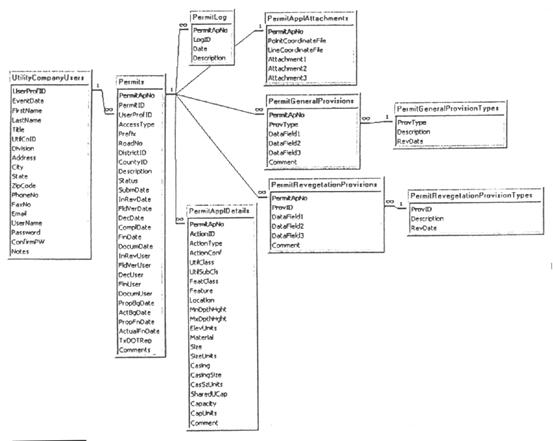
Figure 4. Utility permit database schema (Notes: primary keys are shown in bold)
UTILITY PERMIT DATA ENTRY PROCESS
In the case of TxDOT, roughly 90% of all utility-related activities throughout the state focus on utility permits, and practically all of this is done by hand. A large district handles between 1,000 and 2,000 permits a year and a typical utility permit may take anywhere from a few days to weeks, or even months in some extreme cases, to complete. The amount of paperwork is quite substantial. An automated Internet-based data collection and data entry process could be used to substantially reduce the amount of paperwork, streamline the data capture process, and make the utility permitting process more expeditious.
Figure 5 illustrates the utility permitting process using a Web-based data entry approach. The workflow resembles the actual workflow at TxDOT, except everything to the extent possible would be done electronically. For example, a utility company would use an online data entry form to submit a utility permit application. In addition to text fields, the form provides the user with the capability to upload a file containing coordinate data and also the capability to view this data on an onscreen map. The web server acknowledges receipt of the application and provides the utility company user with the capability to print a copy of the application form that looks exactly the same as the paper form that is currently being used by TxDOT. The server also sends an e-mail message to a designated utility manager at the District office at the time a new permit has been submitted. This manager conducts an initial review of the application online and once this is done, an e-mail message is sent to a supervisor in the maintenance office (or area office if needed) for field verification of the proposed work. The maintenance supervisor conducts the field review and provides comments online. With this information, the utility manager makes a decision as to whether to approve or deny a permit and sends the corresponding online form to the utility company. Assuming the application is approved, the utility company conducts the necessary field work. Upon completion, the utility company is required to submit as-built coordinate data to assist GIS personnel at the District office to make the necessary adjustments to the utility base map.
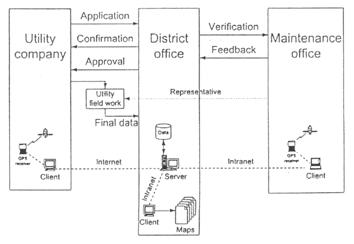
Figure 5. Sample data flow and data collection for utility permits
Utility Company Interfaces
Access to the utility company interface is facilitated through a user profile. The user profile contains contact data, company data, and security data. As soon as a user logs into the system, their profile ID is obtained from the database. This allows user profile data to be stored with all important database transactions and also reduces the work required to complete forms since user profile data are automatically inserted into all forms.
Once the system grants access to a user, a data entry form is displayed on the screen (Figure 6). Where practical for purposes of database consistency, field entries are chosen from a "drop down" list. In the event that an appropriate choice is not available, users may choose "other" and provide a written explanation of this choice. The interface follows a "shopping cart" design approach to provide users with the capability to document several actions associated with the current permit application. This is useful in the case of proposed utility work that involves more than one kind of action in the field, e.g. abandoning a section of pipeline and installing a replacement pipeline at a different location. Notice that the interface requires the user to provide point coordinate data files and/or line coordinate data files to document the proposed utility work in a GIS-compatible format. In order to upload each coordinate file, the user can either provide the path and filename or browse to find and choose the file. After completing the form, the user is shown the completed list of information and is given the opportunity to make changes to the data provided. When the user is satisfied that the permit application form and coordinate files are correct, the user clicks on the "Submit Application Form" button to complete the process. At this point, all the data are permanently stored in the database tables on the server side and the application is given the status of "Submitted". The user is returned to the Utility Permit home page and the application is ready to be processed.
Administrative Interfaces
Following the data flow in Figure 5, the status of a utility permit application could be one of the following at any given time: Submitted, initial review, field verified, approved, rejected, completed or documented. Each status corresponds to a different administrative responsibility. To facilitate workflow, each time an application record changes status, an email alert is automatically sent to the individual responsible for the next required administrative task. A short description of each of the sequential status options follows.
- Submitted: An application is labeled "submitted" when an electronic confirmation that an application has been received by the server has been sent to the utility company.
- Initial review: An application has undergone "initial review" after a utility coordinator at the District Office has verified the application for completeness.
- Field verified: An application is labeled "field verified" after the Maintenance Supervisor/Area Engineer determines whether the proposed installation should be granted and makes a recommendation (through the interface).
- Approved: An application is labeled "approved" after an application that has been recommended for approval has been printed, signed, and mailed to the utility company.
- Rejected: An application is labeled "rejected" after an application that has been recommended for rejection has been printed, signed, and mailed to the utility company. No further action is needed.
- Completed: An application is labeled "completed" after as-built documentation (coordinates and utility facility attributes) has been received by the server upon completion of the proposed work.
- Documented: An application is labeled "documented" after the GIS utility maps have been updated following the field work by the utility company. Appropriate GIS personnel at the District Office is responsible for this task.
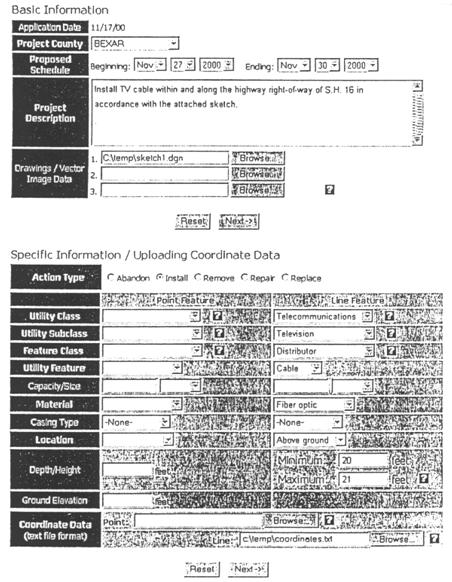
Figure 6. Permit application form interface
CONCLUSIONS
This paper describes a prototype utility data spatial and database model. The paper includes a generic GIS-based model for the inventory of utility facilities and associated attribute data such as ownership, purpose, size, type, and other pertinent characteristics. Two types of descriptors are included in the model: feature descriptors, which refer to spatial and non-spatial attributes used to characterize individual utility features, and process descriptors, which refer to tables and relationships used to characterize business procedures such as utility permits, utility adjustment agreements, and leases. For brevity, this paper only includes basic feature descriptors and some of the tables and relationships involved in the utility permitting process.
The paper also includes an Internet-based data collection and data entry prototype to assist in the utility permitting process. The data management system is centralized with distributed map and data access capabilities. The system includes two types of interfaces: a utility company interface and an administrative interface. The utility company interface provides users with data entry forms that include the capability to "preview" the location of the proposed utility installation work. The administrative interface provides users with the capability to track the progress of the utility permitting process online and alerts affected individuals about specific tasks that result from that process.
ACKNOWLEDGEMENTS
The work documented in this paper is being supported by the Texas Department of Transportation (Research Project No. 0-2110). The authors would like to acknowledge the assistance provided by Ronald Seal, John Campbell, Phil Hancock, Richard Kirby, Jesse Cooper, Randy Anderson, and Russell Beck. The views expressed by the authors do not necessarily reflect the views or policies of the Texas Department of Transportation.
REFERENCES
-
ArcGIS Data Models. Environmental Systems Research Institute (ESRI), http://arconline.esri.com/arconline/datamodels.cfm?PID=1, 2000.
-
Geospatial Resource Management. Intergraph, http://www.intergraph.com/utilcomms/g_industry/, 2000.
-
Color Code Style Sheet. American Public Works Association (APWA), Kansas City, MO, http://www.apwa.net, 1999.
| << Previous | Contents | Next >> |