Exhibit IV-1
| STRATEGIC & PERFORMANCE GOALS by Performance Measure |
FY 2007 ENACTED | FY 2008 ENACTED | FY 2009 REQUEST |
|---|---|---|---|
| 1. SAFETY STRATEGIC GOAL | |||
| A. Highway Safety | |||
| a. Passenger vehicle occupant fatality rate per 100 million passenger vehicle-miles traveled. | 6,120,933 | 6,926,055 | 6,575,973 |
| b. Motorcycle rider fatality rate per 100,000 motorcycle registrations. | 874,419 | 989,436 | 939,425 |
| c. Non-occupant highway fatalities per 100 million vehicle-miles traveled. | 874,419 | 989,436 | 939,425 |
| d. Large truck and bus fatalities per 100 million total vehicle-miles traveled. | 874,419 | 989,436 | 939,425 |
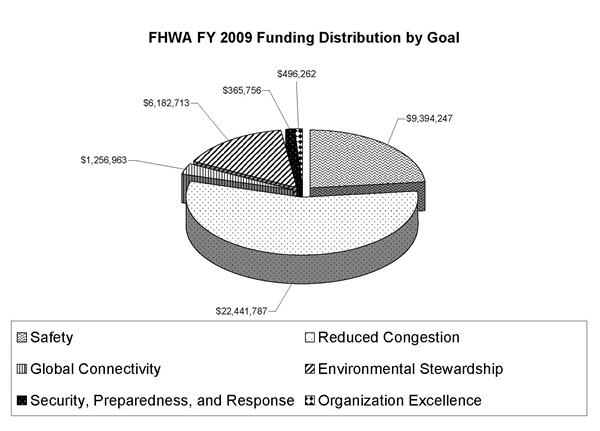
| Subtotal, Performance Outcome | 8,744,190 | 9,894,364 | 9,394,247 |
| Total – Safety Strategic Goal | 8,744,190 | 9,894,364 | 9,394,247 |
| 2. REDUCED CONGESTION STRATEGIC GOAL | |||
| A. High Performance Transp. Infrastructure | |||
| a. Percent of travel on the National Highway System meeting pavement performance standards for “good”-rated ride. | 5,730,919 | 5,784,050 | 5,486,124 |
| b. Percent of deck area on NHS bridges rated deficient, adjusted for average daily traffic. | 5,730,919 | 5,784,050 | 5,486,124 |
| Subtotal, Performance Outcome | 11,461,838 | 11,568,099 | 10,972,248 |
| B. Increase Transportation Capacity | |||
| a. Number of states enacting public/private partnership (PPP) laws where PPP authority is lacking. | 1,671,481 | 1,689,286 | 1,605,734 |
| Subtotal, Performance Outcome | 1,671,481 | 1,689,286 | 1,605,734 |
| C. Operations Performance | |||
| a. Percent of top 40 metropolitan areas with full service patrols, quick clearance policies, and quick clearance laws. | 1,731,178 | 1,749,617 | 1,663,083 |
| b. Percent of population with access to 511. | 1,731,178 | 1,749,617 | 1,663,083 |
| Subtotal, Performance Outcome | 3,462,356 | 3,499,234 | 3,326,166 |
| D. Reduction in Urban Congestion | |||
| a. Percent of annual urban-area travel time occurring in congested conditions. | 6,805,321 | 6,877,809 | 6,537,639 |
| Subtotal, Performance Outcome | 6,805,321 | 6,877,809 | 6,537,639 |
| Total – Reduced Congestion Strategic Goal | 23,400,996 | 23,634,428 | 22,441,787 |
| 3. GLOBAL CONNECTIVITY STRATEGIC GOAL | |||
| A. Expand Business Opportunities | UNDER DEVELOPMENT | ||
| a. Percent of total dollar value of DOT direct contracts awarded to women owned businesses. | ----- | ----- | ----- |
| b. Percent of total dollar value of DOT direct contracts awarded to small disadvantaged businesses. | ----- | ----- | ----- |
| Subtotal, Performance Outcome | ----- | ----- | ----- |
| B. Increase the Efficiency of Passenger and Cargo Movement | |||
| a. Number of freight corridors with an annual decrease in the average buffer index rating. | 441,495 | 469,209 | 446,599 |
| b. Number of NHS border crossings with an increase in reliability (both in- and out-bound). | 441,495 | 469,209 | 446,599 |
| Subtotal, Performance Outcome | 882,990 | 938,418 | 893,198 |
| C. Enhanced Competitiveness | |||
| a. Number of technology/information exchange agreements that promote the U.S. highway transportation industry. | 367,652 | 383,865 | 363,765 |
| Subtotal, Performance Outcome | 367,652 | 383,865 | 363,765 |
| Total-Global Connectivity Strategic Goal | 1,250,642 | 1,322,283 | 1,256,963 |
| 4. ENVIROMENTAL STEWARDSHIP STRATEGIC GOAL | |||
| A. Reduction in Pollution | |||
| a. Number of exemplary ecosystem initiatives. | 1,745,654 | 2,103,073 | 2,028,851 |
| b. Number of exemplary human environment initiatives. | 1,745,654 | 2,103,073 | 2,028,851 |
| c. Number of areas in conformity lapse. | 1,745,654 | 2,103,073 | 2,028,851 |
| Subtotal, Performance Outcome | 5,236,961 | 6,309,220 | 6,086,553 |
| B. Streamline Environmental Review | |||
| a. Median completion time for all Environmental Impact Statements. | 47,282 | 50,620 | 48,080 |
| b. Median completion time for all Environmental Assessments. | 47,282 | 50,620 | 48,080 |
| Subtotal, Performance Outcome | 94,563 | 101,240 | 96,160 |
| Total – Environmental Stewardship Strategic Goal | 5,331,524 | 6,410,460 | 6,182,713 |
| 5. SECURITY, PREPAREDNESS AND RESPONSE | |||
| A. Hazmat Emergency Response | |||
| a. Other | 369,905 | 385,720 | 365,756 |
| Subtotal, Performance Outcome | 369,905 | 385,720 | 365,756 |
| Total – Security, Preparedness and Response Strategic Goal | 369,905 | 385,720 | 365,756 |
| 6. ORGANIZATIONAL EXCELLENCE STRATEGIC GOAL | |||
| A. Fulfill the President’s Management Agenda | |||
| a. Other | 437,766 | 443,742 | 413,552 |
| Subtotal, Performance Outcome | 437,766 | 443,742 | 413,552 |
| B. Financial Stewardship | |||
| a. Percent of major Federally funded transportation infrastructure projects with less than 2 percent annual growth in the project completion milestones as reported in the financial plan. | 43,777 | 44,374 | 41,355 |
| b. Percent of finance plan cost estimates for major Federally funded transportation infrastructure projects with less than 2 percent annual growth. | 43,777 | 44,374 | 41,355 |
| Subtotal, Performance Outcome | 87,553 | 88,748 | 82,710 |
| Total – Organizational Excellence Strategic Goal | 525,319 | 532,490 | 496,262 |
| GRAND TOTAL | 39,622,576 | 42,179,745 | 40,137,728 |