|
Economic Recovery Home > Summary of Projects
Summary of FHWA ARRA Projects
As of January 29, 2010 - View Most Recent Summary
Weekly Lists:
| State |
Funds ( $ ) |
# of Projects |
| Available |
Obligated |
Obligated |
Notice to Proceed |
Completed |
| ALABAMA |
$513,343,313 |
$445,672,226 |
226 |
126 |
15 |
| ALASKA |
$173,520,994 |
$128,665,560 |
22 |
13 |
|
| AMERICAN SAMOA |
$4,500,000 |
$4,500,000 |
1 |
|
|
| ARIZONA |
$520,911,019 |
$381,395,263 |
177 |
159 |
21 |
| ARKANSAS |
$351,894,468 |
$269,699,314 |
103 |
77 |
53 |
| CALIFORNIA* |
$2,542,558,342 |
$2,409,532,528 |
867 |
118 |
48 |
| COLORADO |
$385,574,130 |
$371,615,726 |
99 |
64 |
15 |
| CONNECTICUT |
$299,253,956 |
$249,829,812 |
88 |
36 |
3 |
| DELAWARE |
$121,828,650 |
$65,530,988 |
31 |
27 |
|
| District of Columbia |
$123,507,842 |
$102,221,125 |
13 |
11 |
|
| FEDERAL LANDS |
$550,000,000 |
$254,008,372 |
122 |
51 |
|
| FLORIDA |
$1,348,480,707 |
$1,248,507,183 |
530 |
255 |
39 |
| GEORGIA |
$907,756,775 |
$823,907,557 |
329 |
150 |
|
| GUAM |
$18,000,000 |
$18,000,000 |
5 |
|
|
| HAWAII |
$125,746,380 |
$98,324,691 |
20 |
12 |
|
| IDAHO |
$178,878,631 |
$172,706,553 |
66 |
63 |
|
| ILLINOIS |
$935,592,704 |
$914,909,886 |
735 |
497 |
189 |
| INDIANA |
$657,727,707 |
$596,698,569 |
972 |
707 |
236 |
| IOWA |
$357,623,007 |
$354,778,952 |
232 |
191 |
48 |
| KANSAS |
$348,242,169 |
$277,696,657 |
132 |
50 |
11 |
| KENTUCKY |
$420,829,347 |
$388,251,994 |
47 |
33 |
2 |
| LOUISIANA |
$433,016,357 |
$354,473,519 |
73 |
34 |
|
| MAINE |
$137,552,032 |
$131,002,032 |
73 |
72 |
58 |
| MARYLAND |
$415,524,777 |
$405,253,914 |
164 |
97 |
12 |
| MASSACHUSETTS |
$386,404,367 |
$377,605,900 |
83 |
40 |
|
| MICHIGAN |
$854,995,217 |
$774,491,498 |
575 |
426 |
189 |
| MINNESOTA |
$505,550,989 |
$501,942,254 |
201 |
136 |
65 |
| MISSISSIPPI |
$354,564,343 |
$338,527,623 |
162 |
68 |
13 |
| MISSOURI |
$638,602,918 |
$634,425,732 |
327 |
193 |
100 |
| MONTANA |
$212,470,571 |
$203,342,725 |
82 |
68 |
19 |
| N MARIANA |
$4,500,000 |
$4,500,000 |
1 |
|
|
| NEBRASKA |
$231,739,279 |
$199,342,846 |
102 |
58 |
12 |
| NEVADA |
$201,352,460 |
$192,938,147 |
64 |
18 |
2 |
| NEW HAMPSHIRE |
$129,440,556 |
$127,584,542 |
33 |
27 |
9 |
| NEW JERSEY |
$651,774,480 |
$588,109,982 |
147 |
46 |
2 |
| NEW MEXICO |
$252,644,377 |
$246,183,192 |
87 |
20 |
|
| NEW YORK |
$950,468,723 |
$944,258,723 |
443 |
303 |
77 |
| NORTH CAROLINA |
$730,409,684 |
$701,670,592 |
361 |
272 |
28 |
| NORTH DAKOTA |
$167,146,497 |
$167,146,497 |
162 |
118 |
1 |
| OHIO |
$919,627,030 |
$741,228,917 |
360 |
201 |
63 |
| OKLAHOMA |
$464,655,225 |
$439,455,980 |
248 |
162 |
45 |
| OREGON |
$275,930,284 |
$261,830,904 |
309 |
229 |
2 |
| PENNSYLVANIA |
$1,027,679,012 |
$1,023,005,447 |
303 |
270 |
85 |
| PUERTO RICO |
$105,000,000 |
$104,808,617 |
21 |
6 |
|
| RHODE ISLAND |
$137,445,725 |
$125,691,595 |
55 |
52 |
20 |
| SOUTH CAROLINA |
$463,309,029 |
$419,306,686 |
171 |
87 |
3 |
| SOUTH DAKOTA |
$186,877,359 |
$181,019,030 |
48 |
23 |
5 |
| TENNESSEE |
$575,571,043 |
$525,090,271 |
277 |
262 |
142 |
| TEXAS |
$2,240,215,146 |
$1,752,845,791 |
393 |
282 |
85 |
| UTAH |
$213,919,543 |
$205,502,386 |
111 |
97 |
93 |
| VERMONT |
$125,791,291 |
$121,590,326 |
62 |
32 |
20 |
| VIRGIN ISLANDS |
$15,462,845 |
$10,692,498 |
3 |
3 |
|
| VIRGINIA |
$647,230,364 |
$422,225,495 |
90 |
22 |
3 |
| WASHINGTON |
$492,339,894 |
$481,033,919 |
204 |
170 |
88 |
| WEST VIRGINIA |
$210,852,204 |
$189,104,103 |
115 |
104 |
54 |
| WISCONSIN |
$531,307,063 |
$443,118,157 |
308 |
253 |
168 |
| WYOMING |
$157,616,058 |
$157,616,058 |
65 |
59 |
|
| TOTAL: |
$26,934,756,883 |
$24,074,418,854 |
11,100 |
6950 |
2143 |
*CA is currently updating data so this value may be adjusted
List Descriptions:
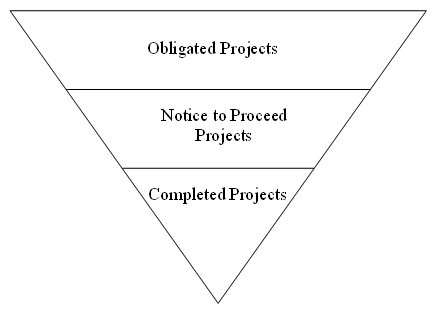
The Obligated Projects List includes all ARRA projects that FHWA has approved to move forward. The Notice to Proceed Projects List includes all of the projects that FHWA has approved that have received a Notice to Proceed. The Completed Project List includes all of the projects that have advanced enough to be considered such that it can be safely and effectively used by the public without further delays, disruption, or impediments.
|