

| << Previous | Contents | Next >> |
Geotechnical Aspects of Pavements Reference Manual
Chapter 6.0 Pavement Structural Design And Performance (continued)
6.3.3 Summary
The design flexible pavement sections for the baseline and soft subgrade scenarios are summarized in Figure 6-5. As expected, the soft subgrade condition mandates a thicker pavement cross section. For the both the 1993 AASHTO and NCHRP 1-37A designs, the required AC thickness increases from 5.3 - 7.9 inches (before rounding and based on the simplest assumption of constant GAB thickness). The GAB thickness remains a constant 12.7 inches for all designs, although as described previously, the granular base thickness would probably be increased for constructability purposes in order to provide a stable working platform over the soft subgrade.
As mentioned previously, increased asphalt thickness could economically be used with a thinner aggregate base layer for the same structural capacity in the 1993 AASHTO procedure, but this adjustment has not been made here. The NCHRP 1-37A methodology does not allocate the increased overall section thickness to the individual layers in the same way as the 1993 AASHTO procedure, and in practice one should examine multiple thickness combinations to find the minimum cost design that meets the specified performance limits.
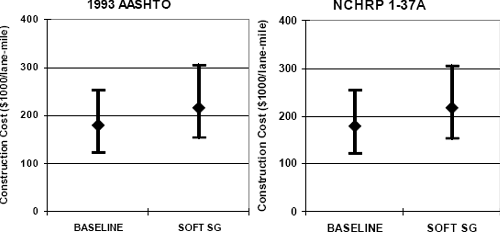
Initial construction cost ranges (based on Table 6-1) for the flexible pavement designs are summarized in Figure 6-6. The average initial construction costs increase from about $180K to $217K (~20%) per lane-mile due to the soft subgrade for both the 1993 AASHTO and NCHRP 1-37A designs.
Figure 6-5. Summary of flexible pavement sections: soft subgrade scenario.
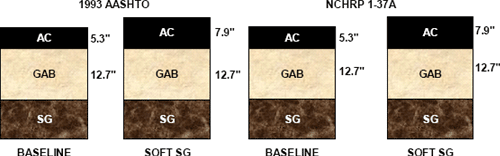
Figure 6-6. Example construction costs for flexible pavement sections: soft subgrade scenario.
The design rigid pavement sections for the baseline and soft subgrade scenarios are summarized in Figure 6-7. The increase in slab thickness required for the soft subgrade conditions is slight, from 10.4 to 10.5 inches for the 1993 AASHTO designs and from 10.4 to 10.9 inches for the NCHRP 1-37A sections (before rounding). The GAB thickness remains a constant 6 inches for all designs, although as described previously, this would probably be increased for constructability purposes.
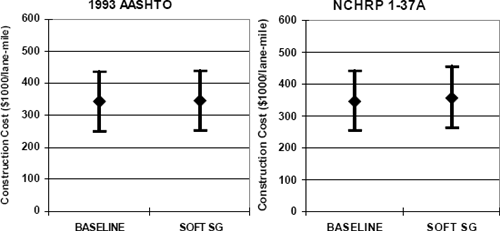
Initial construction cost ranges (based on Table 6-1) for the rigid pavement designs are summarized in Figure 6-8. The average increase in initial construction cost due to the soft subgrade are quite small, ranging from about $2K (~1%) for the 1993 AASHTO design to about $14K (~8%) for the NCHRP 1-37A sections. Note that these initial construction costs for rigid pavements (Figure 6-8) cannot be fairly compared to the initial construction costs for flexible pavements (Figure 6-6) because of the different assumptions for the initial service life and the different maintenance and repair costs that will be required over their design lives. A fair comparison would require evaluation of life-cycle costs, including maintenance, repair, rehabilitation, and perhaps user costs, in addition to the initial construction expense.
Figure 6-7. Summary of rigid pavement sections: soft subgrade scenario.
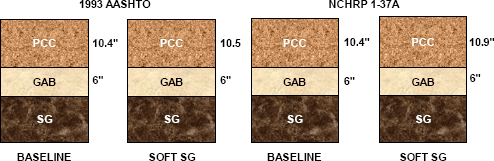
Figure 6-8. Example construction costs for rigid pavement sections: soft subgrade scenario.
Given the significant increases in flexible pavement section required to deal with the weak subgrade condition, other design approaches should be considered, such as subgrade stabilization, geosynthetic reinforcement of the base layer, or switching to a rigid pavement system that is more tolerant of poor foundation conditions. The benefits of subgrade stabilization for the flexible pavement designs are explored in the next section.
6.4 Subgrade Stabilization
As described in the preceding section, a very soft and weak subgrade requires a substantially thicker section for flexible pavements. The effect on required slab thickness for rigid pavements is slight; this confirms the conventional wisdom that rigid pavements are particularly advantageous for very poor subgrade support conditions.
Lime stabilization is a common technique for improving soft and weak subgrades beneath flexible pavements. A primary benefit of lime stabilization is a greatly increased stiffness within the stabilized zone as a function of the lime content. Consequently, the lime content-or more specifically, the effect of lime content on subgrade properties-and the thickness of the stabilized zone are the primary variables for the stabilization design.
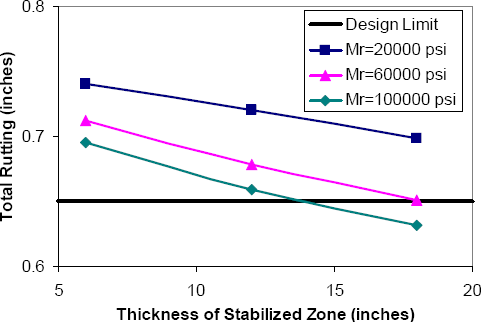
The effect of lime content on the engineering properties of stabilized subgrades will depend greatly on the specific subgrade being stabilized. As a simple illustration of the benefits of lime stabilization, the sensitivity of predicted rutting to the thickness and resilient modulus of the stabilized zone can be examined using the NCHRP 1-37A methodology4. For the purpose of this illustration, all design inputs are kept the same as for the soft subgrade scenario (Table 6-4 and Table 6-11) except that the thickness and resilient modulus of the compacted upper layer of the subgrade are adjusted to simulate the lime stabilized zone.
Total rutting (after adjustment for reliability) at the end of the 15-year initial service life as predicted by the NCHRP 1-37A design methodology for various thicknesses and stiffnesses of the lime stabilized zone are summarized in Figure 6-9. Based on the data in Chapter 7, each 1% of lime in the stabilized zone corresponds very roughly to an increase in resilient modulus MR of about 10,000 psi. The data in Figure 6-9 suggest that a lime content corresponding to an MR value of 60,000 psi over a depth of 18 inches is one of several combinations that will meet the 0.65 inch design limit for total rutting. A pavement section consisting of 5.3 inches of AC over 12.7 inches of GAB over 18 inches of lime-stabilized subgrade (MR = 60,000 psi) should provide sufficient performance. This will also be the more economically feasible design if the cost of the lime stabilization is less than the $37K/lane-mile cost of the 2.6 inches of asphalt concrete saved as a consequence of the subgrade improvement.
Figure 6-9. Effect of lime stabilization on predicted total rutting.
6.5 Low Quality Base/Subbase
The design scenario for this case is identical to the baseline conditions in Section 6.2, except that a lower quality granular base material is specified. The granular base is now postulated to be a clayey sand gravel (AASHTO A-2-6, USCS GC or SC) with MR = 26,000 psi at optimum moisture and density. Intuitively, significantly thicker design pavement sections are expected for this scenario, as compared to the baseline conditions to achieve the same level of pavement performance.
6.5.1 1993 AASHTO Design
Flexible Pavement
Three modifications to the 1993 AASHTO flexible pavement baseline inputs (Table 6-2) are made to simulate the low quality base condition:
- The seasonally-adjusted resilient modulus MR for the granular base layer is reduced from 40,000 to 26,000 psi.
- The structural layer coefficient a2 is reduced from 0.18 to 0.12, consistent with the reduction in MR for the granular base (see correlations in Section 5.4.5).
- The drainage coefficient m2 is reduced from 1.0 to 0.70 to reflect a reduction in drainage quality from good to poor, due to the substantially increased fines content.
- This yields an SN value of only 3.4 for the baseline design layer thicknesses. The W18 traffic capacity for this SN value is only 0.88x10⁶ ESALs, corresponding to an 86% decrease in initial service life.
The required structure is then determined from the design equations, as follows (again assuming changes only in the AC layer thickness):
- Required overall structural number SN = 4.6 (unchanged from baseline conditions)
- Structural number provided by granular base (same thickness D2 as in baseline design) SN2 = m2a2D2 = (0.7)(0.12)(12.7) = 1.07
- Required asphalt structural number SN1 = SN - SN2 = 4.61 - 1.07 = 3.54
- Required asphalt layer thickness D1 = SN1 / a1 = 8.0 inches
The design for the low quality base condition is thus 8.0 inches of AC over 12.7 inches of GAB (before rounding). This represents a significant increase in AC thickness as compared to the baseline AC design thickness of 5.3 inches and is even slightly thicker than the 7.9 inches of AC required for the soft subgrade scenario (Section 6.3.1). This translates to a 21% initial construction cost increase of about $38K per lane-mile (using the typical unit cost data in Table 6-1 and assuming that the unit cost for the low quality base is the same as for high quality crushed stone).
Rigid Pavement
Three modifications to the 1993 AASHTO rigid pavement baseline inputs (Table 6-3) are made to simulate the low quality subbase condition:
- The resilient modulus MR for the granular subbase is reduced from 40,000 to 26,000 psi.
- The Loss of Support LS coefficient is increased from 2 to 3 to reflect the increased erosion potential of the fines in the granular subbase.
- The drainage coefficient Cd is reduced from 1.0 to 0.85 to reflect a reduction in drainage quality from good to poor, due to the substantially increased fines content.
The W18 traffic capacity for the baseline rigid pavement section under the low quality subbase condition is reduced to 8.3x10⁶ ESALs, corresponding to a 50% decrease in initial service life.
The first two changes listed above will have a direct effect on the design modulus of subgrade reaction keff, which reduces from its baseline value of 38 pci to a value of 17 pci for the low quality subbase condition. The 1993 AASHTO design corresponding to this keff and Cd of 0.85 consists of an 11.5 inch PCC slab over 6 inches of GAB. Note that this design is substantially thicker than the 10.4" PCC over 6" subbase section for the 1993 AASHTO baseline scenario; this corresponds to an initial construction cost increase of $31K (9%) per lane-mile. The increase in slab thickness is due primarily to the reduction in the drainage coefficient Cd; only about 0.2 inches of the slab thickness increase is attributable to the increased erodibility of the subbase, as reflected in the larger LS value and the consequently reduced value for keff.
6.5.2 NCHRP 1-37A Design
Flexible Pavement
Changing the granular base soil type from A-1-a to A-2-6 changes many of the other Level 3 default inputs for this layer in the NCHRP 1-37A design methodology. The altered input parameters for the low quality base condition are summarized in Table 6-14. Figure 6-10 summarizes the predicted rutting vs. time for the baseline flexible pavement section (5.3" AC over 12.7" GAB); the time to the 0.65 inch total rutting design limit is only 153 months (12.75 years), corresponding to a 15% decrease in initial service life due to the low quality base. Although cracking is not the controlling distress for this scenario, reducing the quality of the base material does have a significant effect on cracking, more so than on rutting: predicted alligator cracking increases by a factor of 3 and longitudinal cracking by a factor of over 10 in the low quality base scenario, as compared to baseline conditions.
The trial designs and their corresponding predicted performance at end of the initial service life are listed in Table 6-15. Rutting is again the critical distress mode controlling the design in all cases; the design limit of 0.65 inches for total rutting is based on the performance of the baseline pavement section, as described previously in Section 6.2.2. Interpolating among the results in Table 6-15, the final flexible pavement design section for the low quality base condition consists of 5.8 inches of AC over 12.7 inches of GAB. This is significantly thinner than the 8 inches of asphalt required by the 1993 AASHTO design for this scenario, but only 0.5 inches (9%) thicker than in the baseline design, corresponding to a $7.1K/lane-mile (4%) increase in initial construction costs.
| Input Parameter | Design Value | Notes |
|---|---|---|
| Granular Base Layer | ||
| Unbound material type | AASHTO A-2-6 | |
| Analysis type | ICM Inputs | |
| Poisson's ratio | 0.35 | 1 |
| Coefficient of lateral pressure K0 | 0.5 | 1 |
| Modulus | 26,000 psi | 2 |
| Plasticity index | 15% | 1 |
| % passing #200 sieve | 20 | 1 |
| % passing #4 sieve | 95 | 1 |
| D60 | 0.1 mm | 1 |
| Compaction state | Compacted | |
| Maximum dry unit weight | 117.5 pcf | 1 |
| Specific gravity of solids | 2.71 | 1 |
| Saturated hydraulic conductivity | 1.73x10⁻⁵ ft/hr | 1 |
| Optimum gravimetric water content | 13.9% | 1 |
| Calculated degree of saturation | 85.9% | 1 |
| SWCC parameter af | 23.1 psi | 1 |
| SWCC parameter bf | 1.35 | 1 |
| SWCC parameter cf | 0.586 | 1 |
| SWCC parameter hr | 794 psi | 1 |
Notes:
- Level 3 default/calculated/derived value from NCHRP 1-37A software.
- Level 3 default value for this soil class. Input value is at optimum moisture and density conditions before adjustment for seasonal effects (adjustment performed internally within the NCHRP 1-37A software).
Figure 6-10. Predicted rutting performance for low quality base scenario.
| AC Thickness (in.) | Base Thickness (in.) | Total Rutting (in.) |
|---|---|---|
| 5.3 | 12.7 | 0.677 |
| 5.5 | 12.7 | 0.664 |
| 6.0 | 12.7 | 0.635 |
| Design Limit: | 0.65 | |
Rigid Pavement
Changing the granular base soil type from A-1-a to A-2-6 changes many of the other Level 3 default inputs for this layer in the NCHRP 1-37A design methodology. The altered input parameters for the base layer in the rigid pavement design are the same as those summarized earlier in Table 6-14 for the corresponding flexible design condition. In addition, the Erodibility Index for the base layer is changed from "Fairly Erodible (4)" to "Very Erodible (5)" (see Table 6-16) to reflect the increased fines content of the A-2-6 base material. In reality, the erodibility is probably somewhere in between these categories, but the NCHRP 1-37A does not permit input of intermediate erodibility conditions.
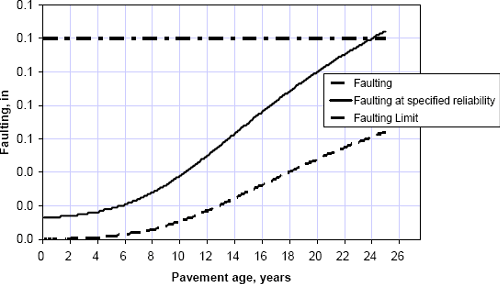
Figure 6-11 summarizes the predicted faulting vs. time for the baseline rigid pavement section (10.4" PCC over 6.0" GAB); the time to the 0.12 inch faulting design limit is only 24 years, corresponding to a 6% decrease in initial service life due to the low quality base condition.
The trial designs and their corresponding predicted performance at end of design life are listed in Table 6-17. Also shown in the table is the design limit for predicted faulting, which is the controlling distress for this scenario. A pavement section consisting of a 10.7 inch PCC slab over 6 inches of GAB (before rounding) meets the design faulting limit for the low quality base scenario. This pavement section is 0.3 inches thicker than the baseline design, but significantly thinner than the 11.5" slab from the 1993 AASHTO design for this scenario. Increased initial construction cost for the additional 0.3 inches of PCC slab is $8.5K (2.5%) per lane-mile.
Figure 6-11. Predicted faulting performance for low quality base scenario.
| Erodibility Class | Material Description and Testing |
|---|---|
| 1 |
|
| 2 |
|
| 3 |
|
| 4 | Unbound crushed granular material having dense gradation and high quality aggregates. |
| 5 | Untreated subgrade soils (compacted). |
| PCC Thickness (in.) | Base Thickness (in.) | Faulting (in.) |
|---|---|---|
| 10.4 | 6 | 0.124 |
| 10.6 | 6 | 0.121 |
| 10.7 | 6 | 0.119 |
| 11.0 | 6 | 0.113 |
| Design Limit: | 0.12 | |
6.5.3 Summary
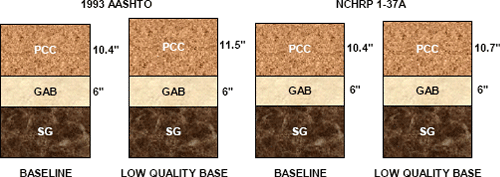
The design flexible pavement sections for the baseline and low quality base scenarios are summarized in Figure 6-12. As expected, the low quality base condition mandates a thicker pavement cross section in both design methodologies. For the 1993 AASHTO design, the required asphalt thickness increases from 5.3 to 8.0 inches (assuming constant granular base thickness); the NCHRP 1-37A design requires a significantly smaller increase of only an additional half-inch of asphalt thickness. Overall, these results suggest that the 1993 AASHTO Guide assigns more weight-at least with regard to rutting, the controlling distress in these scenarios-to the structural contributions from the unbound layers than does the NCHRP 1-37A methodology; this trend has been observed in other comparison studies between the 1993 AASHTO Guide and the new NCHRP 1-37A procedure.
Initial construction cost ranges (based on Table 6-1) for the flexible pavement designs are summarized in Figure 6-13. Note that these costs are very approximate; in particular, the same unit cost has been used for both the high quality (baseline) and low quality granular base materials, but in reality these would likely be different. The initial construction costs for the low quality base scenario (based on the typical unit costs in Table 6-1) increase by about 38K or 21% per lane-mile in the 1993 AASHTO designs and only by about $7.1K or 4% in the NCHRP 1-37A designs.
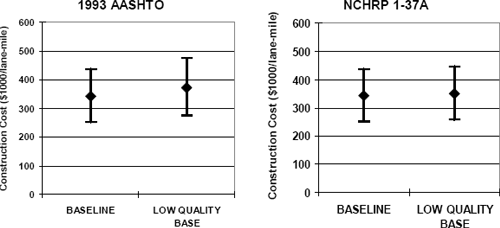
The design rigid pavement sections for the baseline and low quality base scenarios are summarized in Figure 6-14. The low quality base condition necessitates a significantly thicker pavement cross section in the 1993 AASHTO design, with the slab thickness increasing by 1.1 inches. The required slab thickness increased a much smaller 0.3 inches in the NCHRP 1-37A design. As for flexible pavements, the 1993 AASHTO Guide appears to attach more weight to the structural contributions of the unbound layers than does the NCHRP 1-37A procedure.
Figure 6-12. Summary of flexible pavement sections: low quality base scenario.
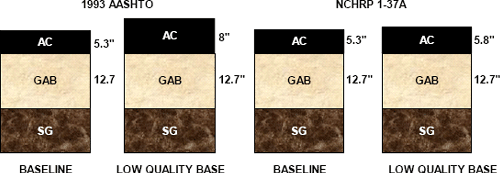
Figure 6-13. Example construction costs for flexible pavement sections: low quality base scenario.
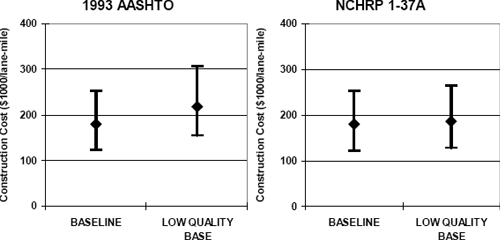
Figure 6-14. Summary of rigid pavement sections: low quality base scenario.
Initial construction cost ranges (based on Table 6-1) for the rigid pavement designs are summarized in Figure 6-15. Note again that these costs are very approximate; in particular, the same unit cost has been used for both the high quality (baseline) and low quality granular base materials, but in reality these would likely be different. The initial construction costs increase by about $31K (9%) per lane-mile for the 1993 AASHTO designs and by $8.4K (2.5%) per lane-mile for the NCHRP 1-37A pavement sections. Note again that the overall magnitudes of these initial construction costs for rigid pavements (Figure 6-15) cannot be fairly compared to the initial construction costs for flexible pavements (Figure 6-13) because of the different assumptions regarding initial service life and different maintenance and repair expenses over the design lives of these different pavement classes. A fair comparison would require evaluation of life-cycle costs, including maintenance, repair, rehabilitation, and perhaps user costs, in addition to the initial construction expense.
The base quality in this scenario is probably not sufficiently low to present a serious problem in design. However, if low base quality does become a critical issue and no high quality crushed material is available, cement or bituminous stabilization could be employed to improve the base quality substantially. Geosynthetics can also be employed for drainage and separation. These techniques are described more fully in Chapter 7.
Figure 6-15. Example construction costs for rigid pavement sections: low quality base scenario.
6.6 Poor Drainage
Good drainage conditions were explicitly assumed in the baseline design scenario. The values for the drainage coefficients in the 1993 AASHTO designs corresponded to a "good" drainage quality rating, defined as "water removed within 2 hours." This implies a high-permeability base layer (like the A-1-a material assumed in the baseline design scenario) and functioning edge drains. The material properties for the granular base and the drainage length specified in the NCHRP 1-37A design procedure were also consistent with a high-permeability base layer and functioning edge drainage.
In this poor drainage scenario, the material characteristics for the granular base layer remain the same as for the baseline conditions. However, it is now assumed that the edge drains are clogged (or perhaps nonexistent), and the consequences of the ineffective drainage are evaluated. Conceptually, these expected consequences are:
- a decrease in the stiffness (and strength) of the granular base layer because of higher average moisture content;
- a decrease in the stiffness (and strength) of the subgrade because of higher average moisture content;
- an increase in other moisture-related distresses (e.g., freeze/thaw cycles, mixing of granular base with subgrade, etc.).
6.6.1 1993 AASHTO Design
Flexible Pavement
Three modifications to the 1993 AASHTO flexible pavement baseline inputs (Table 6-2) are appropriate for simulating the poor drainage condition:
- The seasonally averaged resilient modulus and corresponding structural layer coefficient for the granular base material is reduced to reflect the higher average moisture content due to the ineffective drainage. From Table 5-39, the granular base resilient modulus value for wet conditions may be as low as about 40% of that for dry conditions. The EBS = 40,000 psi value for excellent drainage conditions in the baseline design scenario is therefore reduced 35% to 26,000 psi for the poor drainage condition. This corresponds to a structural layer coefficient a2 = 0.12 using the AASHTO correlation in Eq. (5.16). Note that these values coincide with those for the low quality granular base scenario in Section 6.5.
- The base layer drainage coefficient m2 is reduced from 1.0 to 0.6. This corresponds to a reduction in drainage quality rating from "good" to "very poor" under the assumption that the pavement is exposed to moisture conditions approaching saturation for 5-25% of the time.
- The seasonally averaged resilient modulus for the subgrade is reduced to reflect the higher average moisture content due to ineffective drainage. From Table 5-39, wet resilient modulus values for granular base and subbase materials may be as low as about 40% of those for dry conditions. It is likely that the stiffness decrease in moisture-sensitive fine-grained subgrade soils will be even greater. Consequently, it is assumed here that the MR = 7,500 psi value for good drainage conditions in the baseline design scenario is reduced by about 50% to 3,800 psi for the poor drainage condition (all MR values are after seasonal adjustment). Note that this value coincides with that for the weak subgrade scenario in Section 6.3.
The W18 traffic capacity for baseline flexible pavement section under these poor drainage conditions is only 0.67x10⁶ ESALs, corresponding to an 89% decrease in initial service life.
The required structure is then determined from the design equations, as follows (again assuming changes only in the AC layer thickness):
- Required overall structural number SN = 5.76 (unchanged from baseline conditions)
- Structural number provided by granular base (same thickness D2 as in baseline design) SN2 = m2a2D2 = (0.6)(0.12)(12.7) = 0.91
- Required asphalt structural number SN1 = SN - SN2 = 5.67 - 0.91 = 4.76
- Required asphalt layer thickness D1 = SN1 / a1 = 10.8 inches
The design for the poor drainage condition is thus 10.8 inches of AC over 12.7 inches of GAB (before rounding). This represents a significant increase in AC thickness, as compared to the baseline AC design thickness of 5.3 inches. The additional asphalt thickness required for the poor drainage condition is slightly more than the additional asphalt thicknesses for the soft subgrade and low quality base scenarios combined. This increase in asphalt thickness translates to a 43% initial construction cost increase of about $78K per lane-mile (using the typical unit cost data in Table 6-1).
Rigid Pavement
Four modifications to the 1993 AASHTO rigid pavement baseline inputs (Table 6-2) are appropriate for simulating the poor drainage condition:
- The resilient modulus for the granular subbase material is reduced to reflect the higher average moisture content due to the ineffective drainage. Consistent with the calculations for the 1993 AASHTO flexible design, the ESB = 40,000 psi value for excellent drainage conditions in the baseline design scenario is reduced to 26,000 psi for the poor drainage condition.
- The Loss of Support LS coefficient is increased from 2 to 3 to reflect the increased erosion potential in the granular subbase due to the increased moisture levels.
- The resilient modulus for the subgrade is reduced to reflect the higher average moisture content due to the ineffective drainage. Consistent with the calculations for the 1993 AASHTO flexible design in the preceding subsection, the MR = 7,500 psi value for good drainage conditions in the baseline design scenario is reduced to 3,800 psi for the poor drainage condition (all MR values are after seasonal adjustment).
- The drainage coefficient Cd is reduced from 1.0 to 0.75. This corresponds to a reduction in drainage quality rating from "good" to "very poor" under the assumption that the pavement is exposed to moisture conditions approaching saturation for 5-25% of the time.
The W18 traffic capacity for the baseline rigid pavement section under these postulated poor drainage conditions is reduced to 5.2x10⁶ ESALs, corresponding to a 68% decrease in initial service life.
The first three changes listed above will have a direct effect on the design modulus of subgrade reaction keff, which reduces from its baseline value of 38 pci to a value of 12 pci for the poor drainage conditions. The 1993 AASHTO design corresponding to this keff and Cd of 0.75 consists of a 12.3 inch PCC slab over 6 inches of GAB. Note that this design is substantially thicker than the 10.4" PCC over 6" subbase section for the 1993 AASHTO baseline scenario; this corresponds to an initial construction cost increase of $53K (16%) per lane-mile. As was the case for the low quality subbase scenario, the increase in slab thickness is due primarily to the reduction in the drainage coefficient Cd attributable to the subbase; only about 0.25 inches of the slab thickness increase is due to the increased erodibility of the subbase as reflected in the larger LS value and the consequently reduced value for keff.
6.6.2 NCHRP 1-37A Design
Flexible Pavement
The current version of the NCHRP 1-37A design software does not yet include the capability for directly modeling drainage influences. This in part is due to the paucity of field data available for calibrating the empirical distress models for drainage effects. As stated in the NCHRP 1-37A final report (NCHRP 1-37A, 2004):
"The calibration of the flexible pavement distress models assumed that no infiltration of moisture occurred throughout the design period. Thus, the flexible pavement design procedure does not allow the designer to choose any level of infiltration at this time. However, adequate consideration to subdrainage should be given when designing flexible pavements."
Although it would be possible to run the NCHRP 1-37A analyses using the moduli values assumed for the 1993 AASHTO designs (Section 6.6.1), this defeats the purpose of including the analysis of seasonal moisture variations on material properties in the mechanistic-empirical methodology. It is also probable that this approximate approach would underestimate the detrimental effects of excess moisture in the pavement structure.
Rigid Pavement
Three modifications to the NCHRP 1-37A rigid pavement baseline inputs (Table 6-9) are appropriate for simulating the poor drainage condition:
- The surface infiltration condition is changed from "Minor (10%)" to "Extreme (100%)".
- The granular base layer is changed from a free-draining A-1-a to a much less permeable A-2-6 material. This is the same material as for the low quality base scenario in Section 6.5; the modified NCHRP 1-37A design inputs for this material are given in Table 6-14.
- The Erodibility Index for the base layer is changed from "Fairly Erodible (4)" to "Very Erodible (5)" to reflect the increased fines content of the A-2-6 base material (see Table 6-16).
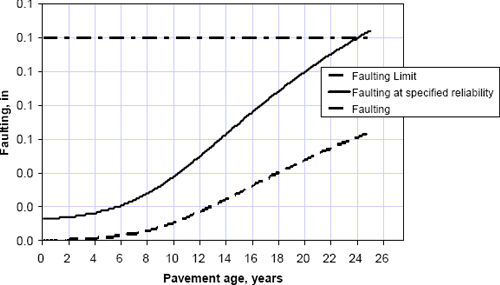
Figure 6-16 summarizes the predicted faulting vs. time for the baseline rigid pavement section (10.4" PCC over 6.0" granular base); the time to the 0.12 inch faulting design limit is only 24 years, corresponding to a 6% decrease in initial service life due to the low poor drainage conditions.
The trial designs and their corresponding predicted performance at end of design life are listed in Table 6-18. Also shown in the table is the design limit for predicted faulting, which is the controlling distress for this scenario. A pavement section consisting of a 10.7 inch PCC slab over 6 inches of GAB meets the design faulting limit for the poor drainage scenario. This pavement section is significantly thinner than the 12.3 inch slab required by 1993 AASHTO design for this scenario, but only 0.3 inches thicker than the design for the baseline conditions, corresponding to an $8.5K per lane-mile (2.5%) increase in initial construction costs.
Figure 6-16. Predicted faulting performance for poor drainage scenario.
| PCC Thickness (in.) | Base Thickness (in.) | Faulting (in.) |
|---|---|---|
| 10.4 | 6 | 0.124 |
| 10.7 | 6 | 0.119 |
| 11.0 | 6 | 0.113 |
| Design Limit: | 0.12 | |
6.6.3 Summary
The design flexible pavement sections for the baseline and poor drainage scenarios are summarized in Figure 6-17. Only designs from the 1993 AASHTO procedure are included here; as described previously, the NCHRP 1-37A procedure in its present form does not have the capability to analyze this scenario. As expected, the poor drainage condition mandates a substantially thicker pavement cross section, with the required thickness of the asphalt increasing from 5.3 to 10.8 inches (for the simple assumption of constant graded aggregate base thickness).
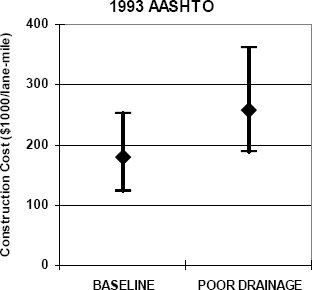
Initial construction cost ranges (based on Table 6-1) for the flexible pavement designs are summarized in Figure 6-18. The initial construction costs based on the typical unit costs in Table 6-1 increase by about $78K or 44% per lane-mile as a consequence of the poor drainage conditions for the 1993 AASHTO designs.
Figure 6-17. Summary of flexible pavement sections: poor drainage scenario.
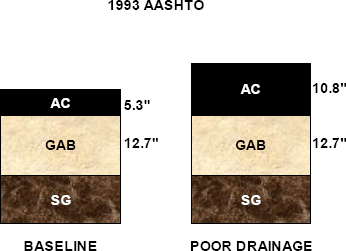
Figure 6-18. Example construction costs for flexible pavement sections: poor drainage scenario.
The design rigid pavement sections for the baseline and poor drainage scenarios are summarized in Figure 6-19. Again, the poor drainage necessitates a thicker pavement cross section. For the 1993 AASHTO design, the required thickness for the PCC slab increases substantially from 10.4 to 12.3 inches (before rounding). For the NCHRP 1-37A designs, the PCC slab thickness increases only from 10.4 to 10.7 inches. These disparities suggest that the 1993 AASHTO procedure overestimates and/or the NCHRP 1-37A methodology underestimates the impact of poor drainage on pavement performance and design requirements. Poor drainage impacts the unbound layers most significantly, and so these disparities are consistent with the trends observed in the low quality base scenario in Section 6.5.
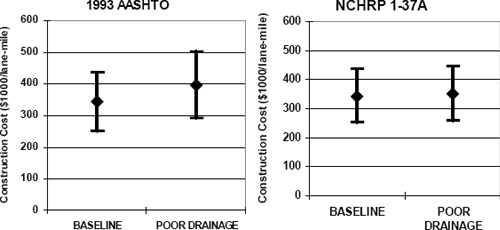
Initial construction cost ranges (based on Table 6-1) for the rigid pavement designs are summarized in Figure 6-20. The initial construction costs increase by about $54K (16%) per lane-mile due to the poor drainage for the 1993 AASHTO designs and by about $8.5K (2.5%) per lane-mile in the NCHRP 1-37A designs. Note again that these construction costs for rigid pavements (Figure 6-20) cannot be fairly compared to the construction costs for flexible pavements (Figure 6-18) because of the different initial service lives and the different maintenance and repair expenses incurred over their design lives. A fair comparison would require evaluation of life-cycle costs, including maintenance, repair, rehabilitation, and perhaps user costs, in addition to the initial construction expense.
These examples clearly show the very substantial effect that ineffective or nonexistent drainage can have on the pavement design thickness. Methods for ensuring adequate drainage in pavements are described in Chapter 7.
Figure 6-19. Summary of rigid pavement sections: poor drainage scenario.
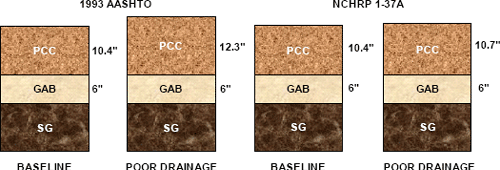
Figure 6-20. Example construction costs for rigid pavement sections: poor drainage scenario.
6.7 Shallow Bedrock
6.7.1 1993 AASHTO Design
Flexible Pavement
Although the presence of shallow bedrock will clearly have a beneficial stiffening effect on the pavement foundation, the 1993 AASHTO Guide does not include any provision for including this benefit in the flexible design procedure. Consequently, the design pavement section for the shallow bedrock scenario will be identical to that for the baseline conditions.
Rigid Pavement
The presence of shallow bedrock will increase the design modulus of subgrade reaction keff via the shallow bedrock correction factor (Figure 5.25). Values of keff for several bedrock depths are summarized in Table 6-19, along with the corresponding values of required slab thickness. All design inputs other than depth to bedrock are equal to the baseline conditions (Table 6-3), and the granular subbase thickness is held constant at 6 inches. The results in Table 6-19 indicate that, for the design conditions in this example, the depth to bedrock has a moderate effect on the design modulus of subgrade reaction keff, but that this has a nearly negligible effect on the required slab thickness. The design pavement section for the case of a 4 foot depth to bedrock is a slightly thinner 10.3 inch PCC slab over 6 inches of GAB. Viewed alternatively, bedrock at a 4 foot depth will increase the allowable traffic W18 to 17.0x10⁶, increasing the initial service life of the baseline rigid pavement section by approximately 1 year (4%).
| Depth to bedrock (ft) | ∞ | 8 | 4 | 2 |
|---|---|---|---|---|
| Composite subgrade modulus k∞ (pci) | 423 | 474 | 577 | 704 |
| Design subgrade modulus keff (pci) | 38 | 41 | 46 | 52 |
| Slab thickness D (in.) | 10.4 | 10.4 | 10.3 | 10.3 |
6.7.2 NCHRP 1-37A Design
Flexible Pavement
Depth to bedrock is an explicit design input in the NCHRP 1-37A procedure. Table 6-20 summarizes the predicted total rutting (adjusted for reliability) for the baseline flexible pavement conditions (Table 6-4) as a function of depth to bedrock, as predicted by the NCHRP 1-37A methodology. For the conditions in this example, a 4 foot depth to bedrock will reduce the predicted rutting by about 17%, or increase the initial service life by about 18 years (120%). This translates directly to a thinner required pavement section. Trial designs and their corresponding predicted performance at end of design life for the case of a 3 foot depth to bedrock are summarized in Table 6-21. A pavement section consisting of 3 inches of AC over 12.7 inches of GAB is sufficient for the shallow bedrock scenario. This corresponds to an initial construction cost reduction of about $38K (18%).
| Depth to Bedrock (ft) | Total Rutting (in.) |
|---|---|
| ∞ | 0.646 |
| 10 | 0.578 |
| 8 | 0.544 |
| 4 | 0.533 |
| AC Thickness (in.) | Base Thickness (in.) | Total Rutting (in.) |
|---|---|---|
| 5.3 | 12.7 | 0.533 |
| 4.0 | 12.7 | 0.593 |
| 3.0 | 12.7 | 0.651 |
| Design Limit: | 0.65 | |
Rigid Pavement
Depth to bedrock is an explicit design input in the NCHRP 1-37A procedure. Table 6-22 summarizes the predicted joint faulting (adjusted for reliability) for the baseline rigid pavement conditions (Table 6-9) as a function of depth to bedrock, as predicted by the NCHRP 1-37A methodology. For the conditions in this example, a 4 foot depth to bedrock will reduce the predicted faulting by about 75%. This translates directly to a thinner required pavement section. Trial designs and their corresponding predicted performance at end of design life for the case of a 4 foot depth to bedrock are summarized in Table 6-23. The NCHRP 1-37A software cannot model PCC thicknesses less than 7 inches. Even at this reduced thickness, however, the predicted faulting for the shallow bedrock conditions is well below the design limit.
| Depth to Bedrock (ft) | Faulting (in.) |
|---|---|
| ∞ | 0.117 |
| 20 | 0.093 |
| 10 | 0.040 |
| 8 | 0.033 |
| 4 | 0.028 |
| PCC Thickness (in.) | Base Thickness (in.) | Faulting (in.) |
|---|---|---|
| 10.4 | 6.0 | 0.028 |
| 9.0 | 6.0 | 0.041 |
| 7.0 | 6.0 | 0.079 |
| Design Limit: | 0.12 | |
6.8 Concluding Comments
It is worthwhile to review the primary objectives of the design studies presented in this chapter:
- to illustrate via examples how the geotechnical properties described in Chapter 5 are incorporated in the pavement design calculations in the 1993 AASHTO and NCHRP 1-37A procedures; and
- to highlight the effects of the geotechnical factors and inputs on pavement design performance.
The design scenarios are intentionally highly idealized and simplified. Their point is to emphasize in quantitative terms how changes in geotechnical inputs affect the overall pavement design and performance. These design scenarios are also good examples of the types of sensitivity studies one should perform during design to evaluate the importance of the various design inputs, especially with reference to the quality of the information used to determine these inputs. As succinctly stated by Hamming (1973) in the frontispiece of his pioneering book on engineering computation: "The purpose of computing is insight, not numbers."
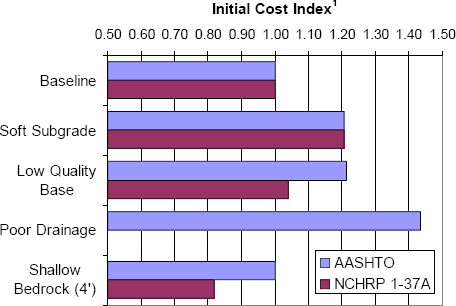
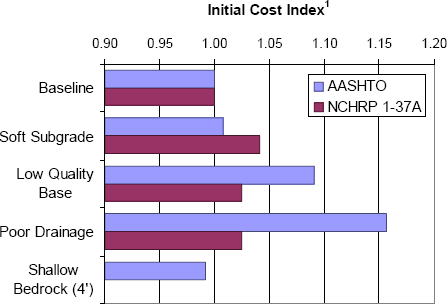
The ultimate measure for comparing the designs for the various scenarios is cost. Life-cycle costs are the best measure, but calculation of life-cycle costs is beyond the scope of these exercises. As a fallback, the various design scenarios can be compared in terms of their initial construction cost ratios using the example unit cost data from Table 6-1 and the baseline design conditions as the reference (i.e., cost index=1). These comparisons are presented in Figure 6-21 and Figure 6-22 for flexible and rigid pavement designs, respectively. Remember that it is inappropriate to compare flexible versus rigid pavements based only on initial construction costs because of the different assumptions regarding initial service life and different maintenance and repair expenses that would be incurred over the design lives of these different pavement classes.
Some key observations to be drawn from Figure 6-21 and Figure 6-22 include the following:
- Poor drainage is by far the most detrimental geotechnical factor for flexible pavements. For the conditions in these examples, poor drainage drives up the initial cost of the flexible pavement design by nearly 50%.
- For the flexible pavement scenarios considered here, a very soft subgrade is the second most detrimental geotechnical factor, driving initial costs up by about 20%. However, the soft subgrade condition can be mitigated by lime stabilization or other remedial measures, as described in more detail in Chapter 7.
- More thickness may be required if lower quality materials are used for the granular base layers in flexible pavements, but the thickness increase may be partially or fully compensated by lower unit costs for the lower quality materials. This will be very sensitive to the specific unit costs of competing materials in the project location.
- Overall, the rigid pavement designs were much less sensitive to geotechnical factors than were the flexible designs. The range and variations in the cost index among the various design scenarios were much less for the rigid pavement designs (Figure 6-22) than for the flexible pavements (Figure 6-21).
Figure 6-21. Summary of costs for example design scenarios: flexible pavement designs.
|
Figure 6-22. Summary of costs for example design scenarios: rigid pavement designs.
|
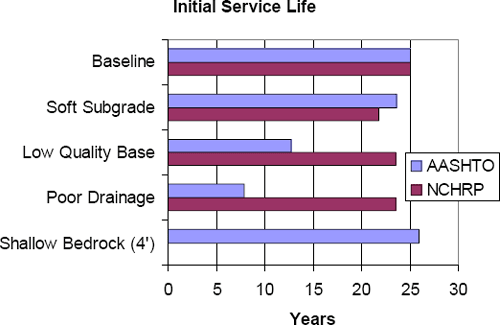
An alternate way of looking at the impact of the various geotechnical design parameters is in terms of their effect on initial service life for the baseline pavement section. Initial service lives for the various design scenarios are summarized in Figure 6-23 and Figure 6-24 for the flexible and rigid pavement sections, respectively. The observations in terms of service life are similar to those from costs. For the flexible pavements, poor drainage, soft subgrade, and low quality base had the most impact on service life (especially for the AASHTO designs), reducing the initial service life from 15 to as little as 2 years in the most extreme case. For the rigid pavements, poor drainage and low quality base again had the most significant impact (again, especially for the AASHTO designs), reducing the initial service life from 25 to as little as 8 years. The soft subgrade conditions had comparatively less effect on the rigid pavement service life, as compared to the flexible pavements, confirming the advantages of rigid pavements for very poor foundation conditions.
Figure 6-23. Initial service lives for example design scenarios: flexible pavement designs.
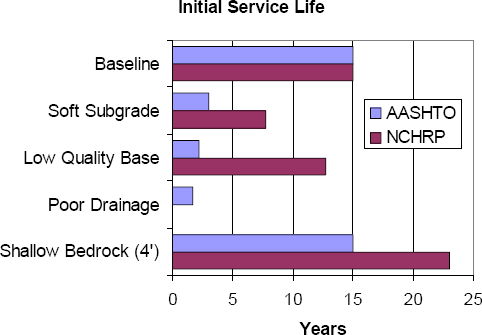
Figure 6-24. Initial service lives for example design scenarios: rigid pavement designs.
Of course, all of the specific observations from these results apply only to the particular design scenarios considered in these illustrative studies. Pavement design conditions and in-place unit costs will vary considerably across agencies and regions. Nevertheless, the simple design scenarios presented here demonstrate quite convincingly the important effects that geotechnical factors can have on design pavement sections and costs.
6.9 Exercises
Students will divide into groups to develop designs for the Main Highway project. Each group will focus on either a flexible or a rigid pavement design. Specific tasks for each group are as follows:
- Develop a pavement design based on the most-likely conditions expected at the site.
- Identify the short list of critical geotechnical inputs to which the design is expected to be most sensitive.
- Perform some initial sensitivity evaluation for the critical geotechnical inputs.
- Complete computations using a simple Excel spreadsheet provided by the instructors.
6.10 References
- AASHTO (1993). AASHTO Guide for Design of Pavement Structures, American Association of State Highway and Transportation Officials, Washington, D.C.
- Christory, J.P. (1990). "Assessment of PIARC Recommendations on the Combating of Pumping in Concrete Pavements," Proceedings of the Second International Workshop on the Design and the Evaluation of Concrete Pavements, Siguenza, Spain.
- Hamming, R.W. (1973). Numerical Methods for Scientists and Engineers, McGraw-Hill, New York, NY.
- MDSHA (2002). Pavement Design Guide, Pavement Division, Office of Materials and Technology, Maryland State Highway Administration, Baltimore, MD.
- NCHRP 1-37A (2004). Mechanistic-Empirical Design of New and Rehabilitated Pavement Structures, Draft Report, Transportation Research Board, National Research Council, Washington, D.C.
- PIARC (1987). "Combating Concrete Pavement Slab Pumping," PIARC Technical Committee on Concrete Roads.
Notes
- Note: The NCHRP 1-37A design methodology has not been calibrated for lime stabilization because of an insufficient numbers of appropriate field sections in the LTPP database. Return to Text
| << Previous | Contents | Next >> |