
Also in PDF, 5.5MB
This project was carried out in support of 23 U.S.C. §503(b)(3)(B)(viii), which directs the Department of Transportation "to carry out research and development activities ... to study the vulnerabilities of the transportation system to ... extreme events and methods to reduce those vulnerabilities."
1. Report No. |
2. Government Accession No. |
3. Recipient's Catalog No. |
|||
4. Title and Subtitle |
5. Report Date |
||||
7. Author(s) |
6. Performing Organization Code |
||||
8. Performing Organization Report No. |
|||||
| 9. Performing Organization Name(s) and Address(es)
ICF
1725 Eye Street, NW, Suite 1000 Washington, DC 20006
South Coast Engineers (SCE)
P.O. Box 72 Fairhope, AL 36533 |
10. Work Unit No. (TRAIS) |
||||
11. Contract or Grant No. |
|||||
12. Sponsoring Agency Name(s) and Address(es) |
13. Type of Report and Period Covered |
||||
14. Sponsoring Agency Code |
|||||
15. Supplementary Notes |
|||||
16. Abstract |
|||||
17. Key Words |
18. Distribution Statement |
||||
19. Security Classif. (of this report) |
18. Security Classif. (of this page) |
20. No. of Pages |
22. Price |
||
| BI | Initial beach width |
|---|---|
| Bm | Present beach width |
| cot (θ) | Side slope of the structure |
| D | Stone dimensions |
| Ebe | Background erosion |
| Et | Erosion over time |
| Gb | Breakwater gap |
| H | Design wave height |
| hb | Water depth |
| Lb | Length of breakwater crest |
| Mb | Maximum bay indentations |
| T | Storm return period |
| V | Dune volume above the stillwater level |
| Wb | Width of beach |
| Xb | Distance offshore |
| AASHTO | American Association of State Highway and Transportation Officials |
|---|---|
| BACI | Before-After-Control-Impact |
| BLM | Bureau of Land Management |
| BMP | Best Management Practices |
| BwN | Building with Nature |
| CatEx | Categorical Exclusion |
| CEQ | Council on Environmental Quality |
| CWA | Clean Water Act |
| CZMA | Coastal Zone Management Act |
| CZMP | Coastal Zone Management Plan |
| DEQ | Department of Environmental Quality |
| DNREC | Delaware Department of Natural Resources and Environmental Control |
| DOT | Department of Transportation |
| EA | Environmental Assessment |
| EFH | Essential Fish Habitat |
| EIS | Environmental Impact Statement |
| EO | Executive Order |
| ESA | Endangered Species Act |
| EWN | Engineering With Nature® |
| FAST Act | Fixing America's Surface Transportation Act |
| FEMA | Federal Emergency Management Agency |
| FFRMS | Federal Flood Risk Management Standard |
| FHWA | Federal Highway Administration |
| GIS | Geographic Information System |
| GMSLR | Global Mean Sea Level Rise |
| ILF | In-Lieu Fee |
| LiDAR | Light Detection and Ranging |
| LRSTP | Long-Range Statewide Transportation Plan |
| MHHW | Mean Higher High Water |
| MHW | Mean High Water |
| MLLW | Mean Lower Low Water |
| MLW | Mean Low Water |
| MMPA | Marine Mammal Protection Act |
| MPO | Metropolitan Planning Organization |
| MSA | Magnuson-Stevens Act |
| MSE | Mechanically Stabilized Earth |
| MSL | Mean Sea Level |
| MTP | Metropolitan Transportation Plan |
| NACCS | North Atlantic Comprehensive Coastal Study |
| NBS | Nature-Based Solutions |
| NEP | National Estuary Program |
| NEPA | National Environmental Policy Act |
| NERRS | National Estuarine Research Reserve System |
| NGO | Nongovernmental Organization |
| NHPA | National Historic Preservation Act |
| NMFS | National Marine Fisheries Service |
| NNBF | Natural and Nature-Based Features |
| NOAA | National Oceanic and Atmospheric Administration |
| NPS | National Park Service |
| ppt | Parts per Thousand |
| PRM | Permittee-Responsible Mitigation |
| PSU | Partial Salinity Unit |
| REF | Regional Ecosystem Framework |
| RFI | Request for Information |
| RFP | Request for Proposal |
| RFQ | Request for Quotation |
| RFT | Request for Tender |
| RIBITS | Regulatory In-Lieu Fee and Bank Information Tracking System |
| ROD | Record of Decision |
| RSLR | Relative Sea Level Rise |
| SAGE | Systems Approach to Geomorphic Engineering |
| SAV | Submerged Aquatic Vegetation |
| SHPO | State Historic Preservation Office |
| SMART | Specific, Measurable, Achievable, Relevant, and Time Bound |
| TMDL | Total Maximum Daily Load |
| USACE | U.S. Army Corps of Engineers |
| USCG | U.S. Coast Guard |
| USDA FS | U.S. Department of Agriculture Forest Service |
| USDOT | U.S. Department of Transportation |
| USEPA | U.S. Environmental Protection Agency |
| USFWS | U.S. Fish and Wildlife Service |
| USGS | U.S. Geological Survey |
| UV | Ultraviolet |
| VIMS | Virginia Institute of Marine Science |
| WwN | Working with Nature |
Nature-based solutions can serve as a first line of defense and improve the resilience of coastal highways. FHWA developed Nature-Based Solutions for Coastal Highway Resilience: An Implementation Guide to help transportation professionals understand when, where, and which nature-based solutions may work for them. The guide follows the project implementation process from planning all the way through construction and maintenance.
Nature-based solutions provide risk-reduction benefits to coastal highways by reducing coastal flooding, wave heights, and erosion. These reductions are the result of both physical and biophysical processes, underscoring the importance of the ecological components of a nature-based solution. Vegetative features like tidal marshes, mangroves, and maritime forests can reduce coastal flooding and effectively dissipate wave energy that contributes to wave-induced flooding, erosion, and infrastructure damage. Reefs dissipate wave energy and force waves to break further from shore, leading to reductions in wave runup and overtopping, wave energy, and erosion. Beaches and dunes dissipate wave energy and reduce coastal flooding and are known to effectively minimize damage to the built environment during extreme events.
Nature-based solutions offer habitat, water quality, and recreational benefits. The natural aquatic edge or shoreline, provision of substrate, and/or use of structures like marsh sills or breakwaters provide habitat for juvenile finfish and shellfish as well as foraging opportunities for birds and mammals. Water quality improvements result from reductions in available nitrogen, phosphorous, and total suspended solids. The habitat and water quality benefits combine to produce beneficial opportunities for recreational fishing, kayaking, paddle boarding, and bird watching.
Nature-based solutions are often equal to or less than the initial cost of traditional shoreline armoring, such as rock revetments, and have lower replacement costs following extreme events. However, nature-based solutions may require a level of routine maintenance that traditional shoreline protection does not. Unlike traditional engineering approaches that require replacement or retrofit, nature-based solutions can naturally adapt to sea level rise over time when conditions are suitable. Funding for nature-based solutions is available within the transportation sector, as part of coastal restoration grant efforts, and through hazard mitigation programs.
Incorporating nature-based solutions into transportation planning enables systematic consideration across a planning area or state and allows for identification of opportunities at an early stage. Transportation planners can facilitate coordination and collaboration with key stakeholders to mobilize larger projects, which increases the project benefits and can reduce costs. Potential partners include state coastal zone management programs, natural resource agencies, national estuarine research reserves, U.S. Army Corps of Engineers District Offices, and non-profit organizations. Coordination includes early engagement with the public as well as appropriate regulatory professionals. Transportation agencies can leverage Eco-Logical, an ecosystem-based approach to transportation planning developed by FHWA and stakeholders, to pre-identify locations where nature-based solutions may be appropriate given existing natural resources and ecological priorities.
Selecting an appropriate nature-based solution involves site characterization and resilience characterization. This guide describes the characterization process so the practitioner can determine what type of solution will best fit project needs. Site characterization is the process of developing an understanding of historical and present site conditions. This process allows you to answer the simple question, What does nature support at this location? When thinking about nature-based solutions, it is best to let nature be your guide. The types of site characterization parameters addressed in the guide include:
| System Parameters | Hydrodynamic Parameters | |
|---|---|---|
| 1. Shoreline Type 2. Infrastructure 3. Erosion Rate 4. Sea Level Rise 5. Tide Range |
1. Wind Waves 2. Boat Wakes 3. Currents 4. Ice 5. Storm Surge |
|
| Terrestrial Parameters | Ecological Parameters | |
| 1. Upland Slope 2. Shoreline Slope 3. Width 4. Nearshore Slope 5. Water Depth 6. Soil Strength |
1. Water Quality 2. Soil Type 3. Sunlight 4. Salinity |
|
| Additional Parameters | ||
| 1. Permits 2. End Effects 3. Constructability |
4. Species 5. Debris 6. Monitoring |
|
Resilience characterization involves identifying coastal highway vulnerabilities to determine resilience needs. Resilience needs may include flood reduction, wave attenuation, erosion reduction, shoreline stabilization, etc. Nature-based solutions can play an important role in enhancing resilience to events, including long-term sea level rise, ranging from minor and frequent to extreme and infrequent. The guide provides potential nature-based solutions to address the following vulnerabilities:
| Highway Hydraulics | Coastal Roadways |
|---|---|
| 1. Sea Level Rise 2. Increased Flooding from Sea Level Rise 3. Storm Surge 4. Sedimentation |
1. Sea Level Rise 2. Increased Flooding from Sea Level Rise 3. Storm Surge 4. Wave Action 5. Erosion 6. Shoreline Retreat |
| Coastal Bridges | Coastal Tunnels |
| 1. Sea Level Rise 2. Storm Surge 3. Wave Action 4. Erosion |
1. Sea Level Rise 2. Storm Surge 3. Wave Action |
Successful nature-based solutions benefit from a wide variety of technical expertise applied throughout the entire implementation process. This guide contains helpful information regarding engineering and ecological design considerations for common nature-based materials and techniques. The guide refers to established methods and techniques for project design. It also provides important lessons learned regarding structure design, selection of materials, addressing ecological needs, and accommodating coastal processes. The guide illustrates the protective benefits of nature-based solutions through examples, which serve as a framework for performing similar analyses on a case-by-case basis. Six design examples demonstrate the wide variety of nature-based solutions, each created for a site-specific application that addresses the relevant vulnerabilities while accommodating the regional setting.

Nature-based solutions require Federal, State, and perhaps even local/municipal review for compliance and permitting. Nationwide, regional, and individual permits exist at the Federal level, each having their own set of requirements when permitting a nature-based solution. Working in consultation with district mitigation leads, nature-based solutions can be used to meet compensatory mitigation requirements.
Performance-based contracts allow innovation in construction techniques and can be a good option for including maintenance. For land-based construction, soft soils may require a timber mat or lighter equipment. Water-based construction may need to be timed for high tide in shallow areas. You may need to avoid nesting season for sensitive species or time vegetation planting or oyster placement for seasonal growth windows. "Pardon our Mess" signs during construction and interpretive signs explaining project benefits aid public support.
Monitoring a project's performance provides an opportunity to measure and assess impacts. There are three key monitoring plan components: identify project goals; identify relevant performance metrics; and select appropriate measurement methods. Maintenance requirements vary by project type and setting. Once established, routine maintenance costs for nature-based solutions should be minimal but are unlikely to be zero. Transportation professionals can use the monitoring results as part of an adaptive management strategy to help ensure project success and longevity as site conditions, or transportation needs, evolve.
The decision to use a purely nature-based approach, a fully structural approach, or a hybrid solution to mitigate coastal hazards depends on (1) the type of nature-based solution that your site will support (e.g., Is it a beach or a marsh?), and (2) the infrastructure vulnerabilities or risks you seek to mitigate through project implementation. To help understand the options available for a given site, the following table presents common coastal hazards (column 1), relevant transportation asset types (column 2), and representative examples of possible management strategies (nature-based, structural, and hybrid)
| Issue | Application | Natural & Nature-Based | Structural | Hybrid (possible examples) |
|---|---|---|---|---|
| Nuisance Flooding | Roads Causeways Drainage |
Dunes Berm |
Elevate Bulkhead Seawall Flood Barrier |
Dunes + Bulkhead/Seawall/Barrier Berm + Bulkhead/Seawall/Barrier |
| Storm Flooding | Roads Causeways Bridges Tunnels Drainage |
Beach Dunes Maritime Forest Marsh Mangroves |
Elevate Bulkhead Seawall Flood Barrier |
Beach + Dunes + Seawall/Barrier Marsh/Mangrove + Seawall/Barrier |
| Wave Runup & Overtopping | Roads Causeways Tunnels |
Dunes Marsh Mangroves Reefs |
Elevate Revetment Flood Barrier Breakwaters Sill |
Dunes + Seawall/Barrier Marsh/Mangrove + Revetment Marsh/Mangrove + Sill Marsh/Mangrove + Reef/Breakwater |
| Wave Forces | Bridges Revetments |
Marsh Mangroves Reefs |
Elevate Breakwaters |
Beach + Dunes + Reef/Breakwater Marsh/Mangrove + Reef/Breakwater |
| Erosion | Roads Causeways Bridges |
Dunes Marsh Mangroves Reefs |
Revetment Armoring Sill |
Dunes + Vegetation Marsh/Mangrove + Sill Marsh/Mangrove + Revetment |
| Shoreline Retreat | Roads Bridges |
Beach Marsh Mangrove Reefs |
Bulkhead Seawall Revetment Breakwaters |
Beach + Reef/Breakwater Marsh/Mangrove + Reef/Breakwater Beach + Revetment/Wall Marsh/Mangrove + Revetment/Wall |
For More Information
Visit Nature Based Resilience for Coastal Highways project website for the following resources:
This guide describes how transportation professionals can implement nature-based solutions that enhance the resilience of coastal highways under conditions ranging from typical to extreme weather events and sea level rise. Here the term coastal highway describes the roads, bridges, and other infrastructure that make up transportation systems exposed to, or occasionally exposed to, tides, storm surge, waves, and sea level rise. Briefly, the term nature-based solution describes a natural or nature-based (i.e., engineered) approach that reduces coastal hazards and damage as an alternative to, or in combination with, traditional engineered solutions.
The purpose of this guide is to provide information to transportation professionals that will enable them to consider nature-based solutions for protecting coastal highways as part of a broader portfolio, or system, of resilience measures. There are many reasons why transportation agencies should consider implementing nature-based solutions:
The scope of this guide is intentionally broad. The document aims to provide transportation professionals with relevant, timely, and science-based information regarding the complete project implementation process for nature-based solutions. Where possible, the guide summarizes existing design guidance with the caveat that the design of nature-based solutions requires a complete understanding of the site-specific issues that often drive the design, types of materials, and construction methods. Transportation professionals will benefit from a more fundamental understanding of programmatic implementation issues related to nature-based solutions, particularly considering the lack of coastal ecological and/or coastal engineering design expertise in the broader transportation community at this time. To that end, this guide recommends that transportation professionals engage the services of local practitioners with the requisite expertise in the design of nature-based solutions (Section 5.1).
Nature-based solutions use natural materials and processes to reduce erosion, wave damage, and flood risks. Nature-based solutions often serve as alternatives to, or ecological enhancements of, traditional shoreline stabilization and infrastructure protection techniques. In this guide, the term nature-based solution is inclusive of both natural and nature-based features. Natural features are created through the action of physical, geological, biological, and chemical processes over time; nature-based features are created by human design, engineering, and construction to provide risk reduction in coastal areas (WIIN Act 2016, Section 1184).
A wide variety of terminology describes nature-based solutions, some of which are listed in the text box at left. The common thread connecting these approaches is the desire to protect or improve the built environment while maximizing the ecological function of the natural system. Because they address a specific ecological or ecosystem function, nature-based solutions are often site-specific and scenario-specific, and their design requires a cross-section of expertise drawing on the fields of coastal ecology, coastal geology, coastal oceanography, and coastal engineering.
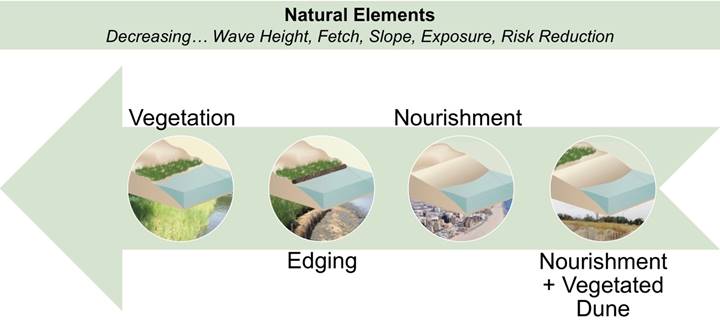
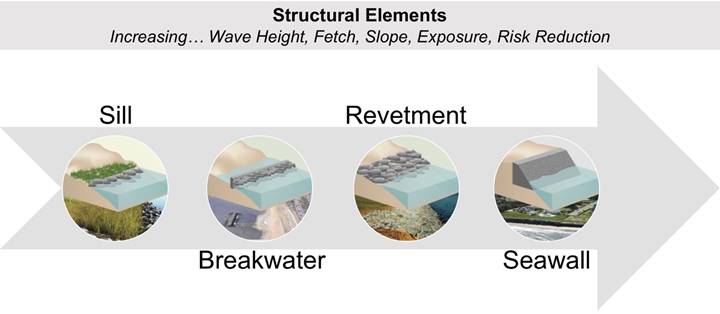
This guide addresses the following examples of nature-based solutions: tidal marshes, mangroves, maritime forests, reefs, beaches, and dunes. In this case, the nature-based solutions considered can mitigate storm surge flooding, wave-related damage, erosion, shoreline retreat, and the potential impacts of sea level rise, which pose threats to coastal infrastructure. A nature-based solution may consist entirely of natural elements (e.g., vegetation, beach, dune) or some combination of natural elements, constructed natural elements, and traditional coastal structures (e.g., sill, breakwater, revetment, seawall). A nature-based solution that combines natural and constructed elements is called a hybrid approach. Table 1-1 includes brief definitions and examples for each of these measures.
Along a continuous spectrum from mild to steep slopes, small to large waves, and sheltered shorelines (e.g., estuaries, bays, sounds) to open coast environments, nature-based solutions increasingly rely on some sort of coastal structure or armoring (Figure 1-1). For example, in that figure, as exposure to large waves or the level of desired risk reduction increases, a more substantial coastal structure and/or armoring are likely. The progression of structural armoring might include a small structure close to the shoreline (e.g., a sill); a more substantial structure located some distance from the shore (e.g., a breakwater); or a continuous rock revetment or seawall in some cases. In some parts of the United States, particularly in the Pacific Northwest, the use of dynamic revetments requires an important caveat. While incorporating many of the engineering features of a traditional revetment, a dynamic revetment mimics the behavior of a cobble beach while offering the protective benefits of a revetment (see the Oregon Department of Transportation (DOT) case study in Section 5.7 for more information).
| Terminology | Brief Description and Examples |
|---|---|
| Policy Measures | Policy measures, also called non-structural measures, are instituted at the programmatic level through public policy, management practices, and/or regulatory requirements. Examples: acquisition/buyout, relocation, land use, zoning changes |
| Natural Features | Natural features are created through physical, biological, geological, and chemical processes, over time, by nature. Examples: marshes, mangroves, maritime forests, reefs, beaches, dunes |
| Nature-Based Features | Nature-based features are created by human design, engineering, and construction to mimic nature and include natural features. Examples: constructed marshes, mangrove restoration, constructed reefs, nourished beaches, restored/constructed dunes |
| Structural Features | Structural features are engineered structures implemented for the purpose of coastal risk reduction by decreasing flooding, wave action, and/or erosion. Examples: sills, breakwaters, bulkheads, revetments, seawalls |
| Hybrid Approaches | Hybrid approaches incorporate a combination of natural or nature-based measures and structural measures. Many nature-based solutions, including living shorelines, use hybrid approaches. Examples: marsh and sill, mangrove and reef breakwater, beach and breakwater |
When exposure to large waves or the required level of risk reduction decreases, an appropriate nature-based solution may require little to no structure, instead focusing more on natural features or engineered and constructed nature-based features. The example provided in Figure 1-1 includes, but is not exclusive to, beach nourishment with and without vegetated dunes; edging, which is a form of low shoreline bank stabilization typically used in conjunction with newly placed sediment and planted vegetation; and shoreline and/or upland stands of vegetation.
The purpose of a coastal structure in a hybrid nature-based solution is to protect or enhance the natural features and/or provide additional risk reduction for adjacent infrastructure. Functionally, the coastal structure achieves these outcomes by manipulating the wave conditions (i.e., wave height and direction) at the site, by directly stabilizing sediments, or through a combination of both actions. The combination of natural and structural elements in a hybrid nature-based solution provide benefits that traditional armoring does not achieve on its own. Specifically, the combination of features used in hybrid nature-based solutions are effective at attenuating wave energy and provide superior habitat value and ecosystem services (Gittman et al. 2016b).
The decision to use a purely nature-based approach, a fully structural approach, or a hybrid solution depends on the following:
This guide was developed to be complementary but not redundant to existing guides and sources of information. The U.S. Department of Transportation (USDOT) provides technical guidance and recommendations to transportation professionals charged with the planning, design, and operation of highways. In addition to this implementation guide, the USDOT Federal Highway Administration (FHWA) offers relevant coastal highway information in their Hydraulic Engineering Circulars HEC-25 2nd ed. (FHWA 2008), HEC-25 Volume 2 (FHWA 2014), and also HEC-25 3rd ed. (FHWA 2019a). Other Federal agencies are also including nature-based solutions as part of their systems approach to addressing flood risks and hazards along the coast (Table 1-2).
Additionally, there are international efforts aimed at the implementation of nature-based solutions. For example, the World Bank (2017) provides an international perspective on the principles of implementing nature-based flood protection.
This implementation guide is part of the USDOT FHWA effort to develop information for transportation professionals that illustrates how nature-based solutions can protect coastal highways from flood and flood-related risks while also providing environmental benefits. Prior to developing this guide, FHWA partnered with State departments of transportation (DOTs) and others on five pilot projects to assess the potential for nature-based solutions to improve the resilience of coastal roads and bridges (FHWA 2019b). The findings from these pilot projects are used to illustrate key concepts throughout this guide. FHWA also published a white paper that describes the potential use of nature-based solutions for coastal highway resilience (FHWA 2018e); conducted four regional peer exchanges to solicit input from experts, end users, and key stakeholders on nature-based solutions; and later published a report that synthesizes the major findings and outcomes of those meetings (FHWA 2018b).
The audience for this implementation guide includes transportation planners, engineering practitioners, operations and maintenance professionals, environmental permitting staff, partnering agencies, and specialized consultants assisting transportation agencies with their work.
| Agency | Nature-Based Solutions Efforts |
|---|---|
| Federal Emergency Management Agency (FEMA) | FEMA describes the benefits of using bioengineering stabilization methods, such as nature-based solutions, as long-term solutions to reduce risk from natural hazards in FEMA (2019). FEMA also supports flood risk-reduction practices as part of their Hazard Mitigation Assistance grant programs (FEMA 2018). |
| U.S. Army Corps of Engineers (USACE) | As part of their North Atlantic Comprehensive Coastal Study (USACE 2015). USACE developed the report, Use of Natural and Nature-Based Features (NNBF) for Coastal Resilience (Bridges et al. 2014). This report provides an integrative framework that classifies NNBF approaches, characterizes vulnerability, develops performance metrics, places monitoring and adaptive management within a systems perspective, and addresses important policy issues. Through their Engineering With Nature® initiative and international collaboration, USACE is developing international guidelines for NNBF to support engineering functions that achieve sustainability and resilience within coastal systems (EWN 2019). |
| National Oceanic and Atmospheric Administration (NOAA) | NOAA serves as the program administrator for the National Coastal Zone Management Program (CZMP). CZMP is a voluntary partnership between the Federal Government and U.S. coastal and Great Lakes States and territories (see Appendix D, Table 10-11, for a list of State CZMP agencies). CZMP aims at protecting, restoring, and responsibly developing our Nation's coastal areas and resources. NOAA encourages the use of nature-based solutions to provide, maintain, or improve habitat or ecosystem function and enhance coastal resilience (NOAA 2015). |
| USACE and NOAA | USACE and NOAA developed a community of practice, the Systems Approach to Geomorphic Engineering (SAGE) group, to help broaden participation in the implementation of nature-based solutions (SAGE 2017). The SAGE group consists of Federal, State, and local agencies; nongovernmental organizations (NGOs); academic institutions; engineering practitioners; and private companies. |
Following this introduction, we provide factsheets on nature-based solutions that give an overview of techniques; a short case study of where each was used; notes on their benefits, challenges, and costs; and some regional considerations. Section 2, which follows the factsheets, provides readers with a summary of the benefits (flood reduction, ecological benefits, long-term performance, and other co-benefits) and typical costs of nature-based solutions. The remaining sections of the guide are intentionally organized to closely mimic the project delivery process. A brief description of each section follows.
The appendices of this guide provide site characterization tools and resources, decision trees for selecting nature-based solutions, suggested performance metrics, and lists of other tools and resources for nature-based solutions.
These technical factsheets for select nature-based solutions can be helpful to practitioners considering implementing one of these strategies. The factsheets cover the following solutions:
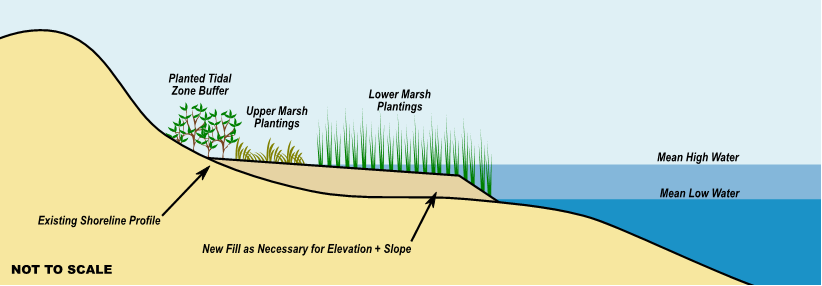
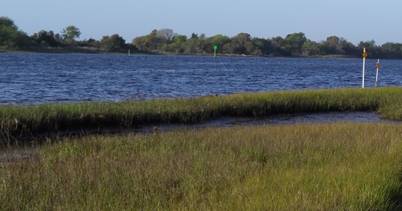
The construction of a marsh, including fill and plantings but without structural elements, in the intertidal zone of a shoreline.
Materials
Native marsh plants appropriate for the site conditions (e.g., tide range, salinity, wave energy) along with sediment, if necessary, to build a platform of gradual slope at an appropriate elevation for the marsh to sustain itself.
Habitat Components
Salt marsh habitat
Durability and Maintenance
Maintenance is most important early in the life of a marsh. Waterfowl can damage young plants, and lost plants must be replaced quickly to ensure the health of the entire marsh. After the early stages, invasive species and runoff issues can affect long-term success. Frequent removal of debris and large items in the wrack line will reduce plant breakage.
Design Life
Because of changes that are difficult to predict, such as sediment supply and ability to keep pace with sea level rise, it is difficult to predict the design life of a marsh. There are many examples of constructed marshes in Maryland and Virginia that are thriving 30+ years after construction. If marsh slope and elevation maintain appropriate values, marshes should be resilient with considerable longevity.
Ecological Services Provided
Marshes provide a number of ecological benefits. They can filter water, including runoff, and they increase the uptake of nutrients, filtration, denitrification, and sediment retention. The root systems of marsh vegetation help stabilize the soil they inhabit, reducing erosion. The marsh platform and plant stems attenuate wave energy, further reducing erosion risk.
"The Teaching Marsh at the Virginia Institute of Marine Science (VIMS) in Gloucester Point, VA is a one-acre site restored to marshland for both practical and educational purposes. The marsh is designed and maintained by VIMS wetlands experts to naturally remove contaminants from Coleman Bridge stormwater runoff, improving water quality in the York River. The Teaching Marsh also provides a demonstration area for regulated wetland plant species identified in the Tidal Wetlands Act of 1972." http://ccrm.vims.edu/wetlands/teaching_marsh/
| Project Proponent | Virginia Institute of Marine Science (VIMS) |
|---|---|
| Status | Completed (1999) |
| Permitting Insights | Establish open and direct communication with local, State & Federal regulatory authorities, rather than assume permit requirements or exemptions will apply to government public education and wetland restoration project. |
| Construction Notes | Excess fill excavated to the appropriate marsh elevation and used to create berms between salt/fresh marshes and walkways. 12,000 plants of various species. |
| Maintenance Issues | Some species died out and were replaced with saltmarsh cordgrass. |
| Final Cost | $25,000 |
| Challenges | Failure of some species may be because of salinity incompatibility. |
Summary of Benefits
Marshes provide a variety of ecological benefits, generally improving water quality and reducing erosion risk while providing habitat for a variety of species.
Challenges
The flood risk reduction and wave attenuation benefits of marshes depend heavily on the water level. Marshes best attenuate waves when the water surface elevation is below the tops of the plantings.
Initial Cost
Upfront costs include the procurement of sediment and plantings for the marsh area, as well as any preventative measures such as bird exclusionary fencing. Upland stormwater BMPs and pruning of shade trees may also factor into initial cost.
O&M Cost
Maintenance costs will likely include the removal of dead plants and debris from the marsh and the planting of new plants, especially early in the life of the marsh.
| Issue | Description |
|---|---|
| Flooding Reduction | Low, some reductions to flooding caused by reducing wave action |
| Wave Attenuation | Medium, marsh platform and plant stems break waves |
| Erosion Reduction | Medium, root systems hold soil in place |
| Multi-Benefits | High, creates/restores habitat, educational opportunity |
| Locale | Various, adaptable to site |
| Elevation + Slope | Low/Medium + Low/Medium, most valuable in the intertidal zone |
| Width | High, the area of marsh created is an important metric of success |
| Issue | Description |
|---|---|
| Gulf of Mexico | Intertidal marsh slope, elevation, selection of appropriate plant species are keys to success. Some marshes vulnerable to high rates of RSLR. |
| Southeast | Intertidal marsh slope, elevation, and selection of appropriate plant species are keys to success. |
| Mid-Atlantic | Intertidal marsh slope, elevation, and selection of appropriate plant species are keys to success. Marshes vulnerable to high rates of RSLR. |
| Northeast | Large tidal fluctuations may preclude intertidal marshes in some areas. Ice formation may damage plants. |
| Great Lakes | Large lake-level fluctuations may preclude intertidal marshes. Ice formation may damage plants. |
| Pacific Northwest | Large tidal fluctuations may preclude intertidal marshes in some areas. Ice formation may damage plants. |
| Pacific Southwest | Select appropriate species based on salinity and marsh elevation. |
| Hawaii & Pacific Islands | Mangroves more common than intertidal marshes. |
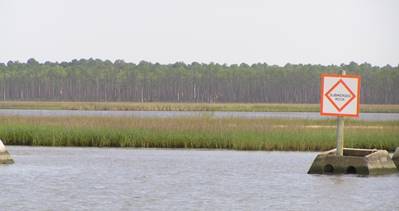
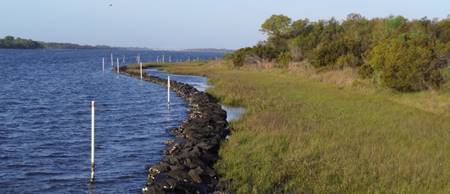
The construction of a marsh, including fill and plantings, in the intertidal zone of a shoreline, including segmented breakwaters to reduce incident wave energy.
Materials
Native marsh plants appropriate for the site conditions (e.g., tide range, salinity, wave energy) along with sediment, if necessary, to build a platform of gradual slope at an appropriate elevation for the marsh to sustain itself. Shore parallel breakwaters are usually made of stone, formed concrete units, or bagged shell material.
Habitat Components
Intertidal salt marsh habitat, potentially with oyster habitat on the structural elements.
Durability and Maintenance
Maintenance is most important early in the life of a marsh. Waterfowl can damage young plants, and lost plants must be replaced quickly to ensure the health of the entire marsh. After the early stages, invasive species and runoff issues can affect long-term success. Frequent removal of debris and large items in the wrack line will reduce plant breakage
Design Life
Because of changes that are difficult to predict, such as sediment supply and ability to keep pace with sea level rise, it is difficult to predict the design life of a marsh. There are many examples of constructed marshes in Maryland and Virginia that are thriving 30+ years after construction. If marsh slope and elevation maintain appropriate values, marshes should be resilient with considerable longevity.
Ecological Services Provided
Marshes provide a number of ecological benefits. They can filter water, including runoff, and they increase the uptake of nutrients, filtration, denitrification, and sediment retention. The root systems of marsh vegetation help stabilize the soil they inhabit, reducing erosion. The marsh platform and plant stems attenuate wave energy, further reducing erosion risk.
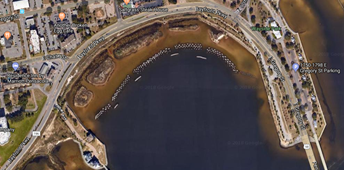
Project GreenShores (Pensacola, FL) is a marsh creation project protected by several types of oyster reef breakwaters. Site 1 used traditional emergent breakwaters, while Site 2 used broad-crested submerged reefs. The project protects a one mile segment of Bayfront Parkway from wave impacts and erosion.
| Project Proponent | Florida Department of Environmental Protection |
|---|---|
| Status | Completed (2008) |
| Permitting Insights | Not available |
| Construction Notes | Phased construction at two sites. Site 1 breakwaters were built from > 20,000 tons of limestone, recycled concrete, and concrete blocks. Marsh islands constructed using 35,000 cubic yards of sand and 41,000 Spartina alterniflora plants. Site 2 used 25,000 cubic yards of recycled concrete, 16,000 cubic yards of sand, and 30,000 plants. Site 2's breakwaters were built to be submerged. |
| Maintenance Issues | The submerged breakwaters at Site 2 have not effectively attenuated wave energy, leading to erosion of the marsh islands and loss of plants at that site. |
| Final Cost | $6,000,000 |
| Challenges | Not available |
Summary of Benefits
Marshes provide a variety of ecological benefits, generally improving water quality and reducing erosion risk while providing habitat for a variety of species. The marsh is stabilized with offshore breakwaters that attenuate wave energy.
Challenges
The flood risk reduction and wave attenuation benefits of marshes depend heavily on the water level. Marshes best attenuate waves when the water surface elevation is below the tops of the plantings.
Initial Cost
Upfront costs will focus on the procurement of sediment and plantings for the marsh area, as well as the toe protection material and any preventative measures such as bird exclusionary fencing. Likely initial cost of $150–340 per linear foot of marsh protected by breakwaters.
O&M Cost
Maintenance costs will likely include the removal of dead plants and debris from the marsh and the planting of new plants, especially early in the life of the marsh.
| Issue | Description |
|---|---|
| Flooding Reduction | Low, some reductions to flooding caused by reduced wave action |
| Wave Attenuation | Medium, breakwater, marsh platform and plant stems break waves |
| Erosion Reduction | Medium, root systems hold soil in place |
| Multi-Benefits | High, creates/restores habitat, educational opportunity |
| Locale | Various, adaptable to site |
| Elevation + Slope | Low/Medium + Low/Medium, most valuable in the intertidal zone |
| Width | High, the area of marsh created is an important metric of success |
| Issue | Description |
|---|---|
| Gulf of Mexico | Intertidal marsh slope, elevation, and selection of appropriate plant species are keys to success. Some marshes are vulnerable to high rates of RSLR. |
| Southeast | Intertidal marsh slope, elevation, and selection of appropriate plant species are keys to success. |
| Mid-Atlantic | Intertidal marsh slope, elevation, and selection of appropriate plant species are keys to success. Marshes are vulnerable to high rates of RSLR. |
| Northeast | Large tidal fluctuations may preclude intertidal marshes in some areas. Ice formation may damage plants. |
| Great Lakes | Large lake-level fluctuations may preclude intertidal marshes. Ice formation may damage plants. |
| Pacific Northwest | Large tidal fluctuations may preclude intertidal marshes in some areas. Ice formation may damage plants. |
| Pacific Southwest | Select appropriate species based on salinity and marsh elevation. |
| Hawaii & Pacific Islands | Intertidal marshes not widespread. |
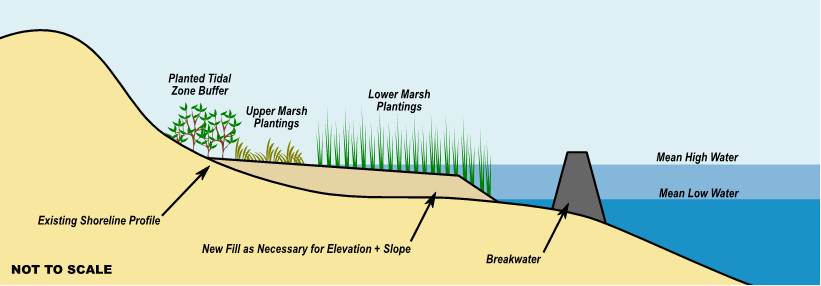
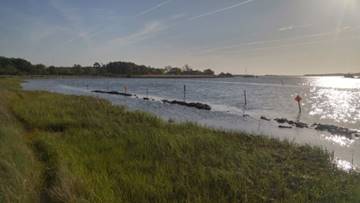
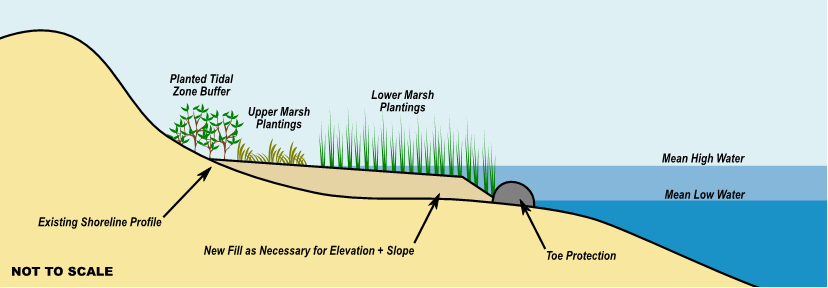
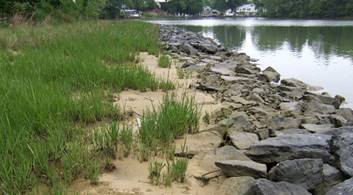
The construction of a marsh, including fill and plantings, fronted by toe protection in the intertidal zone of a shoreline
Design Schematics
Materials
Native marsh plants appropriate for the site conditions (e.g., tide range, salinity, wave energy) along with sediment, if necessary, to build a platform of gradual slope at an appropriate elevation for the marsh to sustain itself. Toe protection is provided around the edge of the marsh, usually in the form of a rock revetment. Other materials have been used for toe protection as well.
Habitat Components
Salt marsh habitat, potentially with oyster habitat on the structural elements.
Durability and Maintenance
Maintenance is most important early in the life of a marsh. Waterfowl can damage young plants, and lost plants must be replaced quickly to ensure the health of the entire marsh. After the early stages, invasive species and runoff issues can affect long-term success. Sill maintenance is typically
very low.
Design Life
Stone sills have an indefinite design life and do not require replacement. Timber sills will require complete replacement after 20 to 30 years because of degradation. Coir logs and similar edging materials used as toe protection will naturally biodegrade over the span of a few years, during which time the restored marsh should have stabilized.
Ecological Services Provided
Marshes provide a number of ecological benefits. They can filter water, including runoff, and they increase the uptake of nutrients, filtration, denitrification, and sediment retention. The root systems of marsh vegetation help stabilize the soil they inhabit, reducing erosion. The marsh platform and plant stems attenuate wave energy, further reducing erosion risk.
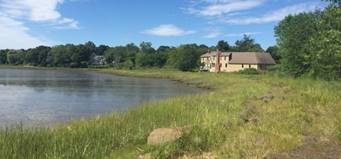
Restoration of low and high marsh along North Mill Pond, in Portsmouth, NH, with about half of the area consisting of new marsh creation, and the other half of the area consisting of restoration of degraded low and high marsh through sediment addition. The purpose of this project was to re-establish the natural, intertidal marsh shoreline.
Photo courtesy of David Burdick
| Project Proponent | City of Portsmouth, Stantec (wetlands consultant), University of New Hampshire (assisted plan development) |
|---|---|
| Status | Completed (May 2016) |
| Permitting Insights | NH Dept. of Environmental Services and USACE permits for drainage outfall into pond. Affected 600 square feet of coastal wetland; salt marsh restoration used as mitigation. |
| Construction Notes | Imported fill to create marsh platform, planted 3,055 square feet of high marsh area. Created microtopography and interior drainage channels. 12-inch diameter coir logs staked at seaward edge of marsh to stabilize toe. Large boulders used to break up winter ice sheets. |
| Maintenance Issues | Survival of low marsh plants is good; survival of high marsh salt hay is fair to poor. Survived 2016–2017 winter well. |
| Final Cost | $60,000 |
| Challenges | Construction did not have a provision for within plot drainage; many plants were washed out by runoff gullies during the first year. |
Summary of Benefits
Marshes provide a variety of ecological benefits, generally improving water quality and reducing erosion risk while providing habitat for a variety of species. The marsh is stabilized with toe protection in the form of a sill.
Challenges
The flood risk-reduction and wave attenuation benefits of marshes depend heavily on the water level. Marshes best attenuate waves when the water surface elevation is below the tops of the plantings, and what flood reduction benefits they have are maximized at higher water levels.
Initial Cost
Upfront costs will focus on the procurement of sediment and plantings for the marsh area, as well as the toe protection material and any preventative measures such as bird exclusionary fencing. Likely initial cost of $150–340 per linear foot of marsh with sill.
O&M Cost
Maintenance costs will likely include the removal of dead plants and debris from the marsh and the planting of new plants, especially early in the life of the marsh.
| Issue | Description |
|---|---|
| Flooding Reduction | Low, some reductions to flooding caused by reducing wave action |
| Wave Attenuation | Medium, marsh platform and plant stems break waves |
| Erosion Reduction | Medium, root systems hold soil in place |
| Multi-Benefits | High, creates/restores habitat, educational opportunity |
| Locale | Various, adaptable to site |
| Elevation + Slope | Low/Medium + Low/Medium, most valuable in the intertidal zone |
| Width | High, the area of marsh created is an important metric of success |
| Issue | Description |
|---|---|
| Gulf of Mexico | Small tide range easily accommodates sill design. Timber structures have a limited life. |
| Southeast | Vertical sills occasionally used to minimize impacts to benthic resources. Marsh sills may incorporate oyster shell in some way. |
| Mid-Atlantic | Long record of successful stone sills. Designs range from continuous to segmented. |
| Northeast | Large tidal fluctuations may increase sill size and cost. Impact of ice formation on sill materials is a concern. |
| Great Lakes | Large lake-level fluctuations may increase size and cost. Low water levels undermine foundations. Impact of ice formation on sill materials is a concern. |
| Pacific Northwest | Large tidal fluctuations may increase sill size and cost. Impact of ice formation on sill materials is a concern. |
| Pacific Southwest | Sills may need to accommodate large tide ranges and long fetches. |
| Hawaii & Pacific Islands | Likely not applicable to these areas. |
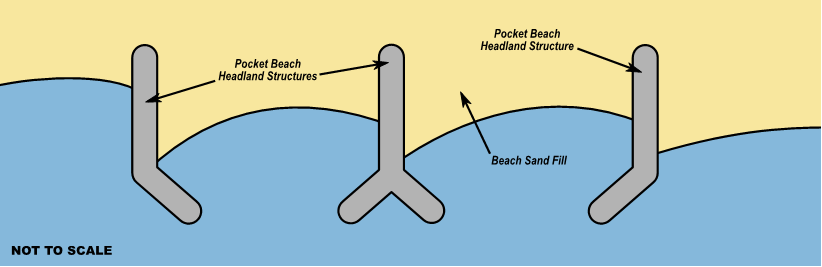
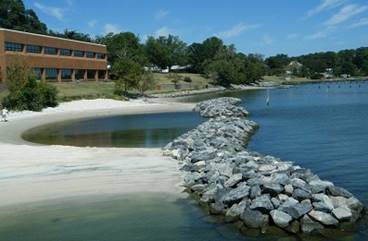
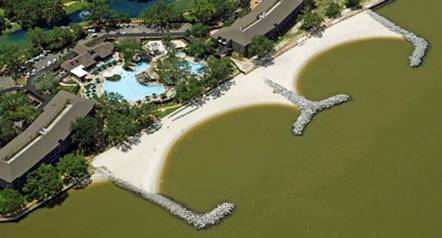
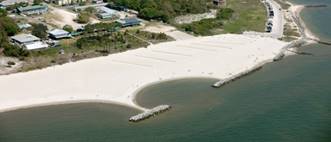
Beach nourishment coupled with the installation of headland breakwater structures to slow the movement of sand out of the project area.
Materials
Sand is sourced from an offshore borrow area, an upland sand pit, or a coastal dredging project. The grain size distribution of the fill sand is an important consideration and should closely match that of the native beach sand. Headland structures can be built from a variety of materials; however, rock is most common, especially for high-energy environments. Timber is a useful, lower cost option for low wave energy locales.
Habitat Components
As with beach nourishment, pocket beaches can provide habitat for foraging shorebirds and nesting sea turtles.
Durability and Maintenance
The proper application of headland structures should dramatically improve the stability and longevity of the beach fill. Some pocket beaches create enclosed, isolated littoral cells where little, if any, sand is lost to longshore sand transport. Correct sizing of the armor stone for the native wave environment is crucial to the stability of the structures and the beach as a whole. The use of standard riprap is typically inadequate.
Design Life
The headland structures should increase the design life of the beach project practically indefinitely. Sea level rise will eventually increase the wave forces the headlands experience, so this should be a consideration in design. Ongoing erosion updrift or downdrift could flank shore-perpendicular structures or affect the incident waves that the structures experience.
Ecological Services Provided
The beach fill itself provides additional beach habitat. The structural elements attenuate waves and improve the stability of the beach, which, in turn, can also attenuate waves during storm events for upland resources.
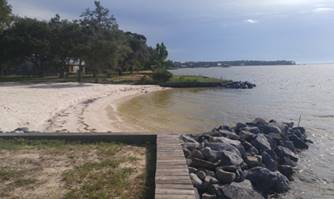
Perdido Bay, AL, Pocket Beach between two timber and sheet-pile bulkheads. This beach was built on the property of a single homeowner to restore a beach on a stretch of shoreline that is heavily armored by individual bulkheads.
| Project Proponent | Homeowner |
|---|---|
| Status | Completed (2018) |
| Permitting Insights | Easement for a non-existent county road runs just bayward of the site. |
| Construction Notes | Neighboring bulkheads were used with permission as the landward anchor points for the headlands (cost to homeowner reduced). |
| Maintenance Issues | None noted. The beach is an isolated littoral cell. As a small scale, homeowner-level project, this beach needed to be "fire and forget," as there is no guarantee the homeowner will maintain it. |
| Final Cost | $40,000 |
| Challenges | Ensuring that the beach will be monitored in the future. |
Summary of Benefits
Combined approach of beach nourishment and headland structures stabilizes the beach project significantly.
Challenges
The inclusion of structural elements (especially those that are partly shore-perpendicular) that may trap sand is a hurdle to permitting. The pocket beach must be designed to improve the stability of the beach with minimal impact to adjacent shorelines.
Initial Cost
Upfront costs will focus on the procurement of sand and construction of the headland structures.
O&M Cost
When properly designed and constructed, a combination of structures and beach should be more stable than a typical beach nourishment project.
Right-of-Way Issues
Conversion of submerged lands to emergent dry beach may cause the property interest to revert to the State, which is both a regulatory concern and can be an implementation barrier. Almost every project requires temporary construction easements to work on/over/across private property.
| Issue | Description |
|---|---|
| Flooding Reduction | High, protects upland resources during storms |
| Wave Attenuation | High, protects upland resources during storms |
| Erosion Reduction | High, beach fill should be very stable |
| Multi-Benefits | High, creates/protects habitat, recreational use |
| Locale | Various, adaptable to site |
| Elevation + Slope | Various + Various |
| Width | Moderate to High |
| Issue | Description |
|---|---|
| Gulf of Mexico | Cultural resource issues (e.g., submerged sites or artifacts of historical significance) may limit activities. Availability of suitable armor stone is poor. Use of limestone requires larger rock for stability. |
| Southeast | Cultural resource issues may limit activities. Availability of suitable armor stone is poor. Use of limestone requires larger rock for stability. |
| Mid-Atlantic | Cultural resource issues may limit activities. Use of structures may require mitigation for impacts on benthic resources. |
| Northeast | High tide ranges and long fetches may increase the cost of structural elements. Regulatory restrictions may limit the use of structures. |
| Great Lakes | Large lake-level fluctuations and long fetches may increase the cost of structural elements. Extreme low water conditions may undermine foundations. |
| Pacific Northwest | High tide ranges and long fetches may increase the cost of structural elements. |
| Pacific Southwest | High tide ranges and long fetches may increase the cost of structural elements. |
| Hawaii & Pacific Islands | High tide ranges and long fetches may increase the cost of structural elements. |
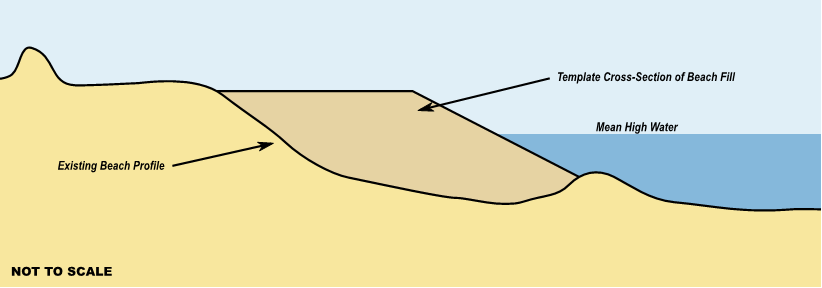
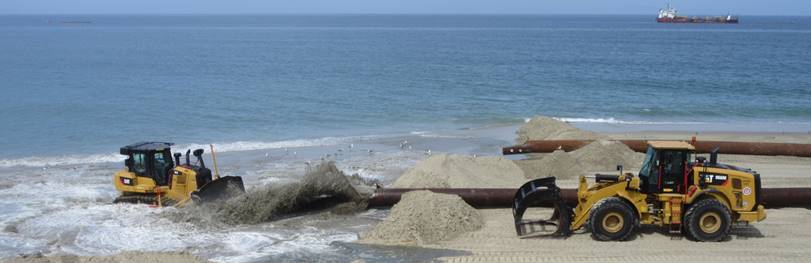
The placement of large quantities of good-quality sand directly on the beach to restore the beach.
Materials
Sand is sourced from an offshore borrow area, an upland sand pit, or a coastal dredging project (i.e., beneficial use). The grain size distribution of the fill sand is an important consideration and should closely match that of the native beach sand.
Habitat Components
Restored beaches provide habitat to a variety of species, including nesting and feeding habitat for shorebirds and nesting habitat for sea turtles.
Durability and Maintenance
Beach nourishment does not, by itself, resolve the causes of beach erosion, so restored beaches require maintenance through periodic renourishment. The renourishment interval, determined before construction, is a function of the existing erosion rate, beach fill project, and minimum design beach width. The renourishment volume is sacrificial and will erode during storm events and regular conditions.
Design Life
Subject to site-specific characteristics such as grain size distribution and beach slope, increasing the volume, elevation, and width of the beach berm enhances the longevity of the project. The estimated project half-life–the time required for 50 percent of the material to leave the project–is a function of the project length squared. Increasing the length of a project substantially increases the project's half-life. In some cases, structures are used to extend the half-life of a beach nourishment project.
Ecological Services Provided
Wide nourished beaches provide improved wave attenuation during storms for natural resources (dunes and other coastal habitats) and human infrastructure (roadways and structures). Sand may erode from nourished beach projects and migrate to other beach areas, improving the performance of local beaches.
The Dauphin Island East End Beach and Barrier Island Restoration Project in coastal Alabama placed 320,000 cubic yards of sand on an eroding beach that protects a maritime forest, freshwater lake, and substantial upland infrastructure.
| Project Proponent | Town of Dauphin Island |
|---|---|
| Status | Completed (March 2016) |
| Permitting Insights | Extensive, detailed cultural resources survey in an offshore borrow area, interaction of State law and Federal policy with a U.S. Coast Guard facility within the project limits. |
| Construction Notes | Included rehabilitation of existing, detached, shore-perpendicular rock groins into breakwater headlands. |
| Maintenance Issues | Ongoing erosion mitigated by rock headland breakwaters; project has endured several tropical storms and hurricanes. |
| Final Cost | $6.7M |
| Challenges | Initial project grant funding was inadequate to cover all project costs. The project owner secured additional grant funding to cover the shortfall without compromising project design. |
Summary of Benefits
Nourished beaches improve habitats, improve recreational and economic value, improve risk reduction factors, and help maintain the shoreline position.
Challenges
Borrow sand sources can contain historical or cultural resources, such as shipwrecks and other artifacts, which must be avoided. Construction activities can affect these and ecological resources, including habitat. Beach nourishment construction affects nesting activities, and often must occur outside of nesting seasons.
Initial Cost
Upfront costs include the procurement of beach fill material and dredge/equipment mobilization. These costs vary widely but are typically ~ $600–900 per linear foot for small to moderate projects. Dredge mobilization is often a considerable expense for small to moderate projects.
O&M Cost
Renourishment has similar requirements to the initial placement of beach sand. Renourishment volumes are often less than the original volume placed for the nourishment project, but mobilization costs remain unchanged.
Right-of-Way Issues
Conversion of submerged lands to emergent dry beach may cause the property interest to revert to the State, which is both a regulatory concern and can be an implementation barrier. Almost every project requires temporary construction easements to work on/over/across private property.
| Issue | Description |
|---|---|
| Flooding Reduction | High, protects upland resources during storms |
| Wave Attenuation | High, protects upland resources during storms |
| Erosion Reduction | Medium, may require renourishment |
| Multi-Benefits | High, habitat, recreation, tourism, property values, etc. |
| Locale | Various, adaptable to site, but may require structural elements in some situations |
| Elevation + Slope | Various + Various |
| Width | High |
| Issue | Description |
|---|---|
| Gulf of Mexico | Cultural resources, oil and gas pipelines complicate offshore dredging. Working outside of turtle nesting season. Avoiding impacts on critical/essential habitat. |
| Southeast | Cultural resources, offshore reefs complicate offshore dredging. Working outside of turtle nesting season. Avoiding impacts to critical/essential habitat. |
| Mid-Atlantic | Cultural resources may complicate offshore dredging and/or onshore work. |
| Northeast | Cultural resources may complicate offshore dredging and/or onshore work. |
| Great Lakes | Regulatory restrictions for fill taken from or used beyond regulatory limit. |
| Pacific Northwest | Compatibility of borrow source material and mixtures of sand and cobble may complicate the project. Integration of beach with coastal bluffs is challenging. |
| Pacific Southwest | Avoiding impacts on critical/essential habitat. Integration of beach with coastal bluffs is challenging. |
| Hawaii & Pacific Islands | Cost and availability of borrow material, critical and endangered species protection, turtle nesting, cultural resource concerns, and offshore reefs result in complex project requirements. |
The placement of good-quality sand to either rebuild existing dunes or create an artificial dune by building up a mound of sand at the back of the beach.
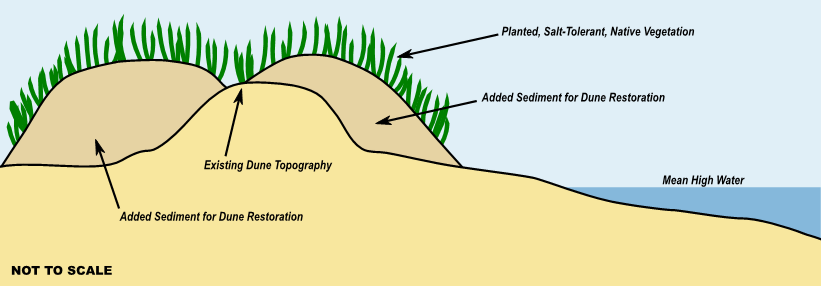
Materials
Sand is sourced from an offshore borrow area, an upland sand pit, or a coastal dredging project (i.e., beneficial use). The grain size distribution of the fill sand is an important consideration and should closely match that of the native beach sand.
Habitat Components
With incorporated grass plantings, restored or created dunes provide habitat for beach-going animals such as shorebirds.
Durability and Maintenance
Dunes with plantings are more stable and more resilient, so any planted grasses should be replaced if damaged. Dunes may lose sand or be damaged by waves during storm events and may need periodic placement of sand. Provide dune walkovers or designated paths to prevent foot traffic from destroying vegetation.
Design Life
Dunes at the rear of a beach that is dry at high tide will survive the longest. Without a significant beach seaward of the dune, the dune will erode quickly.
Ecological Services Provided
Dunes enhance existing beaches or beach nourishment projects by helping to keep sand on the beach (as opposed to blowing landward). When dunes are damaged by waves during storms, the "lost" material helps to replenish the sandy beach. Dunes act as a wave and flooding barrier during storms for upland resources. Dunes may also protect roads by burying them in sand during overtopping conditions.
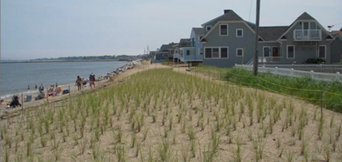
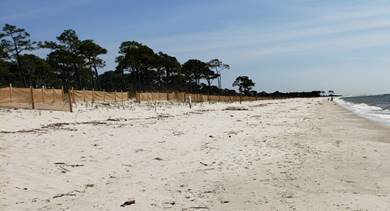
Relatively high beach and dune erosion (approximately 3 feet per year) prompted Ferry Beach Park Association (FBPA) in Saco, ME to undertake a dune restoration project to help protect roads and homes from flooding and erosion. Given the relatively high erosion rate, it was decided that placing sediment for restoration seaward of the existing dune would be short-lived. A secondary dune ridge landward of the existing dune crest was constructed instead, allowing native vegetation to establish.
| Project Proponent | FBPA |
|---|---|
| Status | Completed (Spring 2009) |
| Permitting Insights | Permit-by-Rule needed from Maine Department of Environmental Protection |
| Construction Notes | Included 800-foot-long secondary dune built 1 foot above effective FEMA 100-year base flood elevation. Volunteers planted native American Beach grass. |
| Maintenance Issues | Sand fencing installed to help trap sand in the constructed dune. Continued shoreline erosion has eaten into the dune since May 2017. |
| Final Cost | $29,000+ volunteer hours |
| Challenges | Dump trucks hauling sand when passing through the community. Construction and planting timing restricted during piping plover nesting season. |
The placement of good-quality sand to either rebuild existing dunes or create an artificial dune by building up a mound of sand at the back of the beach.
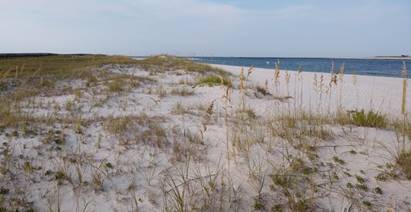
Summary of Benefits
Restored and created dunes offer wave and flooding risk reduction during storms, especially when coupled with an existing wide beach or a beach nourishment project. They also provide dry beach habitat.
Challenges
This approach depends on the existence of a wide beach, and similar to beach nourishment, borrow site investigations are needed. Construction will likely be structured around the nesting seasons of shorebirds.
Initial Cost
Upfront costs will focus on the procurement of sand and planting of grasses on the dunes. Low cost compared to, but often coupled with, beach nourishment.
O&M Cost
Varies by site and depends on the width of the adjacent beach, vulnerability to foot traffic, and maintenance of vegetation.
Right-of-Way Issues
Construction of dunes within the right-of-way is possible, but space constraints may reduce dune performance. Sand-filled geotextiles are often used to anchor dunes in narrow easements. The reinforced dune core also provides erosion mitigation during major storm events. Dunes constructed within utility easements will require special provisions for access to fire hydrants, utility boxes, and overhead power transmission lines.
| Issue | Description |
|---|---|
| Flooding Reduction | High, protects upland resources during storms |
| Wave Attenuation | High, protects upland resources during storms |
| Erosion Reduction | N/A, often coupled with beach nourishment, may reduce erosion by replenishing beach |
| Multi-Benefits | Medium, provides habitat for animals, but not suitable for recreation or human use |
| Locale | Various, adaptable to site |
| Elevation + Slope | Various + Various |
| Width | High, wide beach needed for success |
| Issue | Description |
|---|---|
| Gulf of Mexico | Beach-compatible material, vegetation type, dune walkovers |
| Southeast | Beach-compatible material, vegetation type, dune walkovers |
| Mid-Atlantic | Beach-compatible material, vegetation type, dune walkovers |
| Northeast | Beach-compatible material, vegetation type, dune walkovers, interaction with coastal bluffs |
| Great Lakes | Beach-compatible material, vegetation type, dune walkovers, interaction with coastal bluffs |
| Pacific Northwest | Beach-compatible material, interaction with cobble beach and sand veneer, interaction with coastal bluffs |
| Pacific Southwest | Beach-compatible material, vegetation type, dune walkovers, interaction with coastal bluffs |
| Hawaii & Pacific Islands | Beach-compatible material, vegetation type |
This section plays an important role in the rest of the guide, allowing readers to answer the question, Why consider nature-based solutions for coastal highway resilience? Feedback from transportation professionals during the regional peer exchanges (FHWA 2018b) underscored the importance of being able to communicate to stakeholders that nature-based solutions offer some risk-reduction potential, provide multiple benefits, and have reasonable costs. This section aims to provide that information and cites specific studies, reports, and other documents that underpin the characterization of nature-based solutions. This section begins with a summary of risk-reduction benefits relevant to coastal highways, namely the reduction of flooding, wave heights, and erosion. The reader then will learn about habitat, water quality, and the recreational benefits provided by nature-based solutions. The text then introduces the typical costs of nature-based solutions and concludes with a discussion on long-term performance, including the potential impacts of long-term sea level rise on nature-based solutions.
Nature-based solutions reduce coastal flooding, wave heights, and erosion (Bridges et al. 2014; Cunniff and Schwartz 2015; Shepard et al. 2011; Spalding et al. 2014; Sutton-Grier et al. 2015, 2018; USACE 2015). Nature-based solutions provide flood-reduction benefits through a variety of physical and biophysical means (Narayan et al. 2016). For example, bottom friction and drag provided by vegetation, reefs, and inundated landscapes are effective at reducing flow velocities and wave heights. These reductions inhibit or lessen the potential for erosion and, in some cases, are effective at promoting sediment deposition (Shepard et al. 2011). Some nature-based solutions can adapt to sea level rise through trapping sediment or migrating inland to higher elevations (Spalding et al. 2014; Beck et al. 2018). The flood-reduction performance of nature-based solutions is sensitive to location, setting, and wave energy exposure.
The benefits of flood reduction (broadly summarized in Table 2-1) to coastal highway resilience include, but are not limited to the following:
| KEY High: Significant benefit Medium: Some benefit Low: Minimal benefit None: No benefit |
Risk-Reduction Benefit | Multiple Benefits1 | Resilience | ||||
|---|---|---|---|---|---|---|---|
| Flooding | Wave Attenuation | Erosion | Adaptive Capacity2 | ||||
| RESILIENCE MANAGEMENT STRATEGY | Policy (Non-Structural) | Acquisition | High | High | High | High | High |
| Retrofit | High | Low | Low | Low | Low | ||
| Land-Use Mgmt. | Medium | None | None | High | Medium | ||
| Structural | Floodwalls and Levees | High | Low | None | Low | Low | |
| Storm Surge Barriers | High | Medium | None | Low | Low | ||
| Seawalls and Revetments | Low | High | High | Low | Low | ||
| Nature-Based Solutions | Beach Restoration (nourishment, dunes) | High | High | Medium | High | High | |
| Beach and Breakwaters | High | High | High | High | Medium | ||
| Living Shorelines | Low | Medium | Medium | High | High | ||
| Reefs | Low | Medium | Medium | High | High | ||
| Marshes/ Mangroves | Low | Medium | Medium | High | High | ||
| Maritime Forests | High | Medium | Medium | High | High | ||
1 Multiple benefits include socioeconomic contributions to human health and welfare above and beyond flood-reduction benefits, such as recreation, habitat, and water quality improvements.
2 Measure of a strategy's ability to adjust to changing conditions and forces through natural processes, operation and maintenance, and/or adaptive management.
Saltwater marshes and similar coastal wetlands provide many direct benefits during storm and non-storm conditions. Marsh vegetation is effective at dissipating wave energy, reducing water velocity, reducing flood depths in the marsh, and minimizing net sediment loss (FHWA 2018e). The capacity of marsh vegetation to provide these benefits changes with water level, growing season, and age. Manis et al. (2015) shows that some coastal wetland benefits increase over time as the marsh matures.
The reduction in wave height is non-linear and occurs quickly as waves interact with vegetation at the edge of the marsh. The rate of wave height decay diminishes with distance into the marsh (e.g., Anderson et al. 2013). Laboratory and field studies both confirm this rapid attenuation, with reductions in wave height on the order of 60 percent to 80 percent over an approximately 30-foot-wide span of emergent marsh grass (in the direction of wave travel) (Anderson et al. 2013), and up to 50 percent reductions in wave energy, which is proportional to the wave height squared, within the first 10 feet of the marsh edge (Knutson et al. 1982). This means that even relatively narrow marshes provide measurable wave attenuation benefits that can lead to reductions in wave-induced flooding, erosion, and/or damage. Coastal marshes are less effective at reducing wave heights during extreme events when water levels are above the height of the grasses, but are still more effective than bare, unvegetated mudflats (Garzon et al. 2019).
Wave height attenuation and velocity reduction are most pronounced when the plant height is large relative to the water depth. The substantial reductions in velocity translate to positive benefits, such as reduced erosion and sediment loss from the marsh surface. Shepard et al. (2011) demonstrate a strong positive correlation between the presence of marsh vegetation and sediment/shoreline stabilization, and note the role that belowground biomass, in the form of roots and rhizomes, plays in enhancing soil shear strength and resistance to erosion.
Tidal marshes can mitigate many forms of storm flooding that affect coastal highways. Marshes are most effective at reducing wave-induced flooding given their ability to attenuate wave heights. Wave-induced flooding affects coastal highways through wave runup on slopes and embankments, wave overtopping, and through wave setup along the shoreline. Because of their ability to reduce wave heights and wave-induced flooding, coastal marshes can be effective nature-based solutions for improving the resilience of flood protection systems, such as levees. As cited in Saleh and Weinstein (2016), van Heerden (2007) notes the mitigative role that coastal marshes played in protecting levee systems during Hurricane Katrina in 2005.
In addition to reducing wave heights, marshes mitigate storm flooding by slowing the flow of water as it travels over the marsh, as mentioned in the preceding paragraph. While marshes can reduce storm surge depths during fast-moving storms, substantial reductions require large expanses of habitat that often do not exist in urban settings (Saleh and Weinstein 2016). For example, achieving a flood depth reduction of 3 feet may require up to 1 mile of coastal marsh (Paquier et al. 2017). Marshes are less effective at mitigating flooding during astronomical tides or increased high tides from sea level rise until, or unless, the marsh has migrated to a higher elevation. This is because the inundation during high tide progresses too slowly for drag or friction to play a significant role.
Mangroves and mangrove forests provide flood-reduction benefits similar to those of saltwater marshes. Their complex root structure and canopies are known to reduce wave heights, wave runup, storm surge, and tsunami runup (FHWA 2018e; Spalding et al. 2014). The magnitude of wave height attenuation depends on the density and size of the mangrove forest. Wave height reductions ranging from 20 percent to more than 50 percent per 100 meters (~330 feet) of mangrove forest are possible (Hashim and Catherine 2013; Mazda et al. 1997; Zhang et al. 2012). Similar studies show that wave height attenuation through mangroves is 2 to 7.5 times more effective than in cases without mangroves (Hashim and Catherine 2013; Quartel et al. 2007).
Large stands of mangroves reduce storm surge and surge-like features (e.g., tsunami runup). Studies by Krauss et al. (2009) and Zhang et al. (2012) report surge decay of 0.5 to 2.6 feet per mile depending on the density of mangroves. As much as 30 percent of the surge decay occurs quickly over the edge of the mangrove stand (Zhang et al. 2012). Ismail et al. (2012) show that mangroves reduce tsunami runup by 36 percent within 100 meters (~330 feet) of their edge, and up to 50 percent within twice that distance. This protection significantly reduces storm damages (see text box above) (Barbier 2016).
The term maritime forest refers to an upland coastal forest of trees and shrubs. Mei et al. (2014) shows wave height reductions of up to 40 percent when the forest width is at least equal to the wavelength, but no substantial reductions as the size of the forest grows larger. A study by Das et al. (2010) suggests that reductions in storm surge and flow velocity could be as high as 22 percent and 49 percent, respectively, over a 1,000-foot-wide stand of vegetation perpendicular to the coast. Shorelines with established forests can reduce flooded areas by as much as 30 percent when compared to shorelines without forests (Kalakan et al. 2016). The implementation of coastal forests for tsunami runup mitigation also shows positive benefits (Irish et al. 2014), as did their presence during a major tsunami event in Japan (Nateghi et al. 2016).
The annual value of flood risk reduction provided by coral reefs in the United States is more than 18,000 lives and more than $1.8 billion in 2010 U.S. dollars (Storlazzi et al. 2019). Reefs provide positive flood benefits by reducing wave heights, moderating nearshore currents, and subsequently reducing coastal erosion. Reefs attenuate waves through transmission, breaking, and friction (Spalding et al. 2014). Coral reefs reduce wave heights by 70 percent, on average (Narayan et al. 2016). The protective services provided by coral reefs are expected to increase with sea level rise (Beck et al. 2018).
Because of their ability to reduce wave heights, reefs also modify patterns of sediment erosion and deposition. However, unhealthy or damaged reef systems can have the opposite effect. In one case, the deterioration of a coral system resulted in enhanced shoreline erosion and damage to coastal infrastructure (Reguero et al. 2018a).
Reefs may be intertidal (submerged only at high tide) or subtidal (completely submerged at all tide levels). In either case, the wave transmission characteristics of natural reefs are like those of submerged and emergent breakwaters (Allen and Webb 2011; Webb and Allen 2015). There are established methods for estimating the wave attenuating capabilities of such structures through the calculation of their transmission coefficients; examples include d'Angremond et al. (1997) and van der Meer et al. (2005). However, some artificial oyster reef restoration projects rely on the use of habitat structures that do not provide the same wave-attenuating capabilities as natural reefs or breakwaters (Servold et al. 2015; Webb and Allen 2015). The controlling factors are often the structure crest elevation relative to the mean sea level tidal datum, and the size of the structure relative to the incident wavelength.
Reefs do not contribute substantially to reductions in coastal flooding, although they do mitigate some forms of wave-induced flooding, such as wave runup and wave overtopping, by forcing the waves to break on the reef. Prolonged wave breaking increases the time-averaged water level at the shoreline through a process known as wave setup. Shorelines adjacent to natural reef systems respond to wave setup and establish an equilibrium over time.
When used as a form of shoreline stabilization, oyster reef restoration shows some promise in low wave energy environments (Piazza et al. 2005), under environmental conditions that are reflective of their needs (i.e., appropriate levels of salinity and sedimentation). This is likely because oyster reef restoration, to date, has not been performed on a scale large enough to provide major reductions in wave energy. When oyster reef restoration is combined with more traditional forms of coastal engineering protection, such as engineered breakwaters, shoreline stabilization is a realistic goal (Sharma et al. 2016).
The greatest flood protection benefit of a beach is wave attenuation (Spalding et al. 2014). The buffering distance it provides in between the shoreline and built infrastructure serves as an indirect benefit, giving waves more space to dissipate their energy. On their own, beaches are not necessarily a form of erosion control: they erode naturally! Beach nourishment and periodic renourishment are used to mitigate shoreline retreat and the reduction of the protective buffer that it provides. The appropriate use of coastal structures, such as breakwaters, groins, and combinations thereof, can substantially extend the life and performance of beach fill projects (NRC 1995).
The distance from the coast is a significant predictor of infrastructure damage (Hatzikyriakou et al. 2016; Walling et al. 2014, 2015). A study by Dean (2000) demonstrates that widening a beach, through nourishment, yields storm damage reductions comparable to those of moving infrastructure landward by a similar amount. Post-storm assessments following Hurricane Sandy demonstrate this concept: structures behind wider beaches sustained less damage than those behind narrow beaches or beaches with lower berm elevations (Barone et al. 2014; Griffith et al. 2014).
Sand dunes provide protective benefits during storm events by blocking or reducing storm surge flooding and wave action. Dunes function as sacrificial volumes of sand that minimize storm impacts until the dunes are eroded by waves or overtopped by storm surge. Post-Sandy assessments demonstrate that the presence of dunes contributed substantially to reductions in storm damage (Tomiczek et al. 2017) and flooding (Walling et al. 2014). Dunes with sand fencing and vegetation trap and stabilize sand, leading to increases in dune volume and dune height over time. Through physical modeling of vegetated dunes in the laboratory, Bryant et al. (2018) show that the combination of belowground and aboveground vegetation biomass reduced the loss of dune volume by a factor of three when compared to an unvegetated dune during a wave overwashing event. Additional literature regarding the positive impacts of vegetation on dune performance are cited and described in Bryant et al. (2017).
Nature-based solutions possess some inherent capacity to reduce storm hazards through reductions in wave height, flood depth and extent, and erosion. These natural systems are most effective at mitigating hazards of low to moderate intensity. It also is worth considering combinations of nature-based solutions (depending on the regional setting), which recent studies show often yield benefits beyond those achieved by individual nature-based features. For example, a study by Manis et al. (2015) finds that combining a restored oyster reef with marsh vegetation has a greater impact on reducing wave energy than either approach by itself. Similarly, work by Guannel et al. (2016) shows that more protective services are achieved by combining corals, sea grasses, and mangroves than any individual habitat or any combination of two habitats. In addition, combining beach nourishment with dune construction/restoration typically yields a wider range of benefits than beach nourishment alone (Rogers 2000).
It may be prudent to consider hybrid solutions when coastal hazards and wave action are characterized by high intensity, or when coastal infrastructure is critical, sensitive, or lacking redundancy. Hybrid approaches, which combine nature-based approaches with traditional engineered coastal infrastructure, may provide higher levels of protection from coastal hazards while simultaneously enhancing the resilience of both the infrastructure and the ecosystem. In these cases, the structural features may improve the reliability and/or performance of the system while also providing the specific hazard-reduction benefits that a nature-based solution, on its own, may not. Examples of hybrid approaches are listed below. Under each example is a brief description of services provided by the natural element, and services performed by the structural element, in order of significance:
Some examples of beneficial combinations of nature-based solutions and engineering infrastructure are provided below:
In addition to their flood-reduction benefits, nature-based solutions also provide habitat, water quality, and recreational benefits. Nature-based solutions provide habitat for juvenile finfish and shellfish and foraging opportunities for birds and mammals (Sharma et al. 2016). The habitat benefits are often related to an increase in the aquatic edge (i.e., the length of shoreline in contact with the waterbody) or shoreline, the provision of substrate for the settling and growth of shellfish, and the incorporation of structure that offers protection for juvenile species.
Nature-based solutions improve water quality by reducing available nitrogen and phosphorous in coastal waters, by reducing total suspended solids through deposition and trapping of sediments, and through increased light penetration to the seabed (e.g., Forand et al. 2015; Beck et al. 2017; Morris et al. 2018; Onorevole et al. 2018). The water quality benefits, nursery areas, and foraging opportunities offered by nature-based solutions directly enhance habitat for fish (Gittman et al. 2016a). Structural features, by themselves, do not typically provide these benefits (Bilkovic and Mitchell 2013). Sutton-Grier et al. (2018) compare the annual water quality and fish production value of nature-based solutions to that of seawalls and bulkheads, finding that the former is valued at $4,000 to $28,000 per acre per year, while the latter is effectively $0 per acre per year. Barbier et al. (2011) cites specific metrics for the water quality benefits provided by coastal marshes, with an estimated $785 to $15,000 per acre capitalized cost savings over traditional waste treatment systems in the United States (Breaux et al. 1995).
Nature-based solutions also provide positive recreational and aesthetic benefits that traditional infrastructure does not. The habitat and water quality benefits combine to produce beneficial opportunities for recreational fishing, kayaking, paddle boarding, and bird watching. Providing appropriate access to accommodate these activities is often a consideration in the project design phase.
Table 2-2 summarizes the provision of ecosystem services, using relative terminology, to habitat provision, nutrient uptake, food production, biodiversity, recreation, and aesthetic value. Nature-based solutions also can provide other co-benefits that are not listed in Table 2-2, such as improved tourism, education, and research opportunities (Morris et al. 2018). Some nature-based solutions–beaches, dunes, mangroves, marshes, and seagrasses–also sequester carbon (Davis et al. 2015; Morris et al. 2018).
| Ecosystem Services | Structural Features | Nature-Based Solutions | |||||||||
|---|---|---|---|---|---|---|---|---|---|---|---|
| Key Contribution to Ecosystem Services: 3 High 2 Moderate 1 Low – Irrelevant |
Bulkheads and Seawalls | Revetments | Breakwaters and Sills | Beaches | Dunes | Marshes and Mangroves | Seagrasses | Reefs | Beach Nourishment | Marsh / Mangrove Restoration | |
| Habitat | Fish | 1 | 2 | 3 | 1 | 1 | 3 | 3 | 3 | 2 | 3 |
| Mollusks | 2 | 2 | 2 | 3 | 1 | 3 | 3 | – | 2 | 3 | |
| Crustaceans | – | 1 | 1 | 2 | 1 | 3 | 3 | 2 | 1 | 3 | |
| Turtles | – | – | – | 3 | 2 | 1 | 2 | 2 | 2 | 1 | |
| Birds | – | – | – | 2 | 3 | 3 | 1 | – | 2 | 3 | |
| Nutrient Uptake and Cycling | 1 | 1 | 1 | 2 | 1 | 3 | 3 | 1 | 1 | 3 | |
| Food Production | 1 | 1 | 1 | 1 | 1 | 3 | 3 | 2 | 1 | 3 | |
| Biodiversity | 1 | 1 | 1 | 2 | 3 | 3 | 3 | 3 | 1 | 3 | |
| Recreation | 2 | 1 | 2 | 3 | 3 | 3 | 3 | 3 | 3 | 3 | |
| Aesthetic Value | – | – | – | 3 | 3 | 3 | 3 | 1 | 3 | 3 | |
The typical costs of nature-based solutions vary widely in the literature. Some costs include materials only, while others factor in labor and/or possibly other costs. There is, however, a positive correlation between project cost and exposure to wave energy. In other words, as wave exposure increases, so does the project cost. Project costs and benefits also may depend on the amount of risk reduction allocated to the nature-based solution, and how that may change over time with future sea level rise. A study by Reguero et al. (2018b) analyzes some of these issues through an analysis of cost-effectiveness for nature-based and coastal adaptation techniques along the U.S. Gulf Coast. With the exception of local levees and beach nourishment in some parts of Texas, nature-based approaches provided far more cost-effective mitigation than increasing the elevation of infrastructure. Table 2-3 provides one representative example of average low, median, and high erosion control costs as a function of wave energy exposure. This table was adapted from Luscher and Hollingsworth (2007) with modifications. Average low, median, and high costs were found in the published literature. Under the "Condition" heading, depth refers to the water depth adjacent to the shoreline or bank; fetch refers to the distance along the surface of the adjacent water body over which wind can blow to generate waves; and erosion rate refers to the rate of shoreline retreat rather than vertical elevation change.
| Condition | Wave Energy | ||||||||
|---|---|---|---|---|---|---|---|---|---|
| Low | Moderate | High | |||||||
| Shoreline Location | Creek or Cove | Tributary | Estuary, Sound, Bay | ||||||
| Depth (feet) | < 1 | 1–4 | 4–15 | ||||||
| Fetch (miles) | 0.5–1.0 | 1.0–2.0 | > 2.0 | ||||||
| Erosion Rate (feet/year) | < 2 | 2–8 | 8–20 | ||||||
| Erosion Control Treatment | Bank Regrading, Beach Fill, Vegetation, Edging | Vegetation + Structure, Beach Fill + Structure | Beach + Structures, Shoreline Hardening | ||||||
| Average Cost ($/linear foot) | Low | Med | High | Low | Med | High | Low | Med | High |
| 78 | 182 | 286 | 117 | 360 | 603 | 457 | 711 | 966 | |
More than 60 reference documents, reports, and publications reviewed for this study contain some cost information regarding shoreline stabilization structures, natural features, and nature-based solutions. Of those, approximately 39 provide useful data and/or are not duplications of information presented in other documents (see Section 10 for citations of the materials used in this analysis). Table 2-4 summarizes the average low, median, and high cost information extracted from these documents. The documents' publication years range from 2000 to 2018, so the cost information is relatively recent. The cost data are reflective of all major regions of the United States, including the Northeast, Mid-Atlantic, Southeast, Gulf of Mexico, Great Lakes, Pacific West, and Pacific Northwest. These cost data generally include materials and installation.
Table 2-4 does not list costs for every structure or technique found in the literature. Examples of other commonly used features include gabions (low/median/high: $120/$135/$150 per linear foot), and geotubes (low/median/high: $50/$125/$200 per linear foot). The review documents also contained the costs of live stakes, root wads, large woody debris, fascines, and policy measures; however, they are not reported here as the sample numbers were typically less than two.
The true cost of nature-based solutions should consider more than capital costs. NRC (2007) recommends evaluating nature-based solutions using seven different metrics:
A competent professional with expertise in erosion control projects can assess the first five items on this list. Assessing the impact on environmental benefits is often performed by assigning values to specific functions performed by the system. A method for assigning these values is described in NRC (2005), Valuing Ecosystem Services.
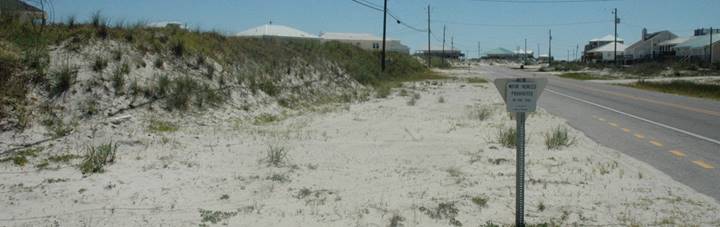
| Costs typically include materials and installation. | Number of Samples (N) | Average Costs ($/linear feet) | ||||
| Low | Median | High | ||||
| RESILIENCE MANAGEMENT STRATEGY | Shoreline Hardening | Bulkheads (unspecified) | 12 | 394 | 872 | 1,349 |
|---|---|---|---|---|---|---|
| Vinyl Bulkheads | 3 | 125 | 163 | 200 | ||
| Vinyl Bulkheads With Toe Protection | 4 | 333 | 361 | 389 | ||
| Timber Bulkheads | 6 | 208 | 237 | 265 | ||
| Timber Bulkheads With Toe Protection | 5 | 305 | 332 | 360 | ||
| Sheet Pile Bulkheads (steel) | 5 | 616 | 766 | 916 | ||
| Seawall (concrete, masonry) | 12 | 1,481 | 1,717 | 1,952 | ||
| Other Walls (e.g., cribs, specialty) | 6 | 398 | 423 | 448 | ||
| Revetments | 28 | 417 | 569 | 721 | ||
| Structures | Breakwaters (stone) | 20 | 279 | 388 | 496 | |
| Groins | 2 | 618 | 1571 | 2,525 | ||
| Sills | 16 | 301 | 320 | 340 | ||
| Proprietary Habitat Units | 19 | 391 | 403 | 415 | ||
| Nature-Based Solutions | Living Shorelines (unspecified) | 10 | 355 | 491 | 627 | |
| Marsh + Sill/Breakwater | 11 | 157 | 246 | 336 | ||
| Beach Nourishment (small to moderate) | 17 | 613 | 802 | 992 | ||
| Bioengineering Activities | 5 | 126 | 187 | 248 | ||
| Oyster Reefs | 6 | 203 | 294 | 386 | ||
| Coir Logs | 5 | 56 | 66 | 76 | ||
| Vegetation Only | 18 | 68 | 90 | 113 | ||
The body of knowledge related to nature-based solutions is less than 40 years. Some of the earliest nature-based solutions were constructed in the early 1980s in the State of Maryland on the Chesapeake Bay and its many tributaries. These "living shorelines" typically consisted of some bank regrading, placement of fill where necessary, the use of appropriate marsh vegetation, and the use of stone sills where appropriate. Initially, estimated project lifespans were equivalent to the 25-year loan terms used to finance and cost-share the living shorelines. In their retrospective of 258 living shoreline projects in Maryland, Subramanian et al. (2006) estimate that these projects have stabilized more than 117,000 feet of intertidal shoreline, prevented nearly 50,000 tons of sediment per year from entering the coastal waters, created more than 2.3 million square feet of tidal wetlands, reduced nitrogen by more than 41,000 pounds per year, and reduced phosphorous by more than 27,000 pounds per year. Many of these early projects are still doing well today, much more than 25 years following their construction.
The long-term performance and success of nature-based solutions is a function of the following, at a minimum:
The practitioner/designer can somewhat control the first four items on this list. To a certain degree, addressing these first four items will minimize the potential negative impacts associated with the last three items. If the project design is sound, and materials do not degrade in the marine environment, the lifespan of a nature-based solution may be indefinite (Faulkner 2010). However, failures in other areas, such as not accounting for the impacts of sea level rise or the lifespan of materials, could significantly shorten this "indefinite" timeframe.
Sea level rise (SLR) will impact the long-term performance of nature-based solutions and the protective benefits they provide. Understanding these impacts is important in both the planning and design phases of project implementation. Sea level position, particularly local rates of relative sea level rise (RSLR), is a controlling factor in many nature-based solutions: It controls shoreline position, as well as the elevation of tidal datums, such as mean low water (MLW), mean sea level (MSL), and mean high water (MHW), that serve as important ecological benchmarks for some species. Practitioners should consider both historical and projected future rates of RSLR in the planning and design of a project.
Historically, global MSL has risen by 7 to 8 inches since 1900, with approximately 3 of those inches occurring since 1993. Future projections of global mean SLR, relative to sea level position in 2000, range from 1.0 to 4.3 feet by 2100. Projections of global mean SLR exceeding 8 feet by 2100 are scientifically plausible, although the probability of such an extreme outcome is currently unknown (USGCRP 2017).
The effects of global mean SLR will be unique along the U.S. coastline because of local and/or regional processes. At any one location, the combination of global mean SLR and other processes is RSLR. In most areas of the United States, rates of RSLR exceed the global average because of land subsidence. The reader is directed to FHWA (2019a) for additional information on selecting and applying future RSLR projections in the planning and design of coastal highways. These same recommendations are useful for the planning and design of nature-based solutions.
Nature-based features possess an inherent ability to adapt to SLR, particularly when they have room to migrate or expand to higher elevations. Mitchell and Bilkovic (2019) refer to a "dynamic design" concept that leads to resilient projects. In their paper, they stress the importance of embracing the dynamic characteristics of these projects in order to allow their adaptive capacity to enhance their resilience. If SLR rates exceed adaptive capacity, inland migration space is not available, and retreat of the infrastructure is not possible, then direct action is necessary. Direct action may come in the form of the following:
The following sections describe the adaptive features and limitations of several nature-based features, as well as actions that can be taken to improve long-term performance.
In tidal marshes, sediment settles out of the water column and onto the surface of the marsh during periods of tidal flooding. Deposition rates are highest in low-elevation marshes that are inundated for long periods of time (Kirwan and Megonigal 2013). The balance of plant root growth and decay directly adds organic matter to the soil profile, raising elevation by sub-surface expansion. Sediment deposition rates, vegetation growth, and organic matter accumulation tend to increase with flooding duration and the rate of SLR (Kirwan et al. 2016).
The rate of SLR that marshes can withstand is highly site-specific and heavily influenced by human impact, ranging from a few millimeters to several centimeters per year (Kirwan and Megonigal 2013). As found in a study of marshes in the Mid-Atlantic region, their survival under higher future rates of SLR depends on optimal hydrology and sediment supply conditions (Reed et al. 2008). Human activities that reduce the ability of marshes to adapt to SLR include activities that restrict sediment supply, such as construction of dams and reservoirs, and activities that contribute to subsidence, such as groundwater withdrawal, artificial drainage of wetlands, and oil and gas extraction. Factors that reduce the likelihood of marshes keeping pace with SLR include smaller tidal ranges and lower sediment supplies. The Gulf of Mexico and the Chesapeake Bay region have lost large areas of wetlands and are characterized by smaller tidal ranges, lower sediment inputs, fast rates of RSLR, and low elevations. The optimal conditions depend on the elevation of the marsh, tidal range, the supply of organic and inorganic sediment to the marsh, and the ability of the marsh to migrate to higher elevations over time (Kirwan and Megonigal 2013; Mitchell et al. 2017). Stevenson et al. (1988) suggest that reduced sediment input is possibly more damaging to marsh health than SLR alone.
Allowing room for marsh migration should be considered during project design. Development behind marshes, including roads, can restrict the ability of marshes to migrate (Titus et al. 2009a, 2009b). Providing a vegetated buffer adjacent to a coastal highway may allow the marsh to migrate landward, and to higher elevations, as it adjusts to changes in local MSL (Kirwan et al. 2016). The use of structural elements in nature-based solutions that would impede the migration of the marsh could interfere with its effectiveness over time. A revetment on an embankment above a marsh would prevent lateral and vertical migration of the marsh over time, causing it to drown in place. Accounting for these types of incompatibilities between nature-based features and engineering infrastructure will ultimately determine the co-benefits produced over time.
Thin layer placement–a method of artificially adding sediment to a marsh to meet target elevations for vegetation–can help marshes adapt to rising levels (Figure 2-2). For example, USACE used dredged material to increase the elevation of marshes in Blackwater Wildlife Refuge by 4 to 6 inches in order allow the marsh to keep pace with SLR (Bridges et al. 2018).
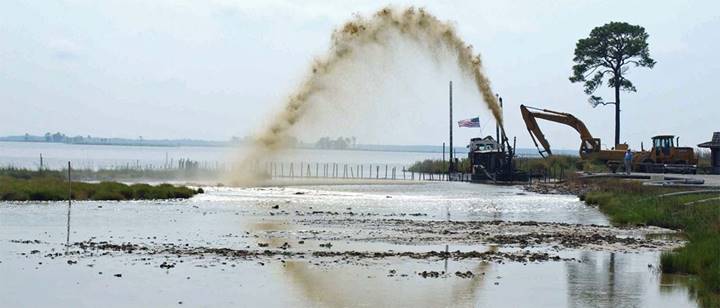
An FHWA-funded pilot study with USACE (FHWA 2018c) analyzed the potential for thin layer placement to restore areas of marsh surrounding Great Bay Boulevard in Tuckerton, NJ, and reduce flooding of the roadway (Figure 2-3).
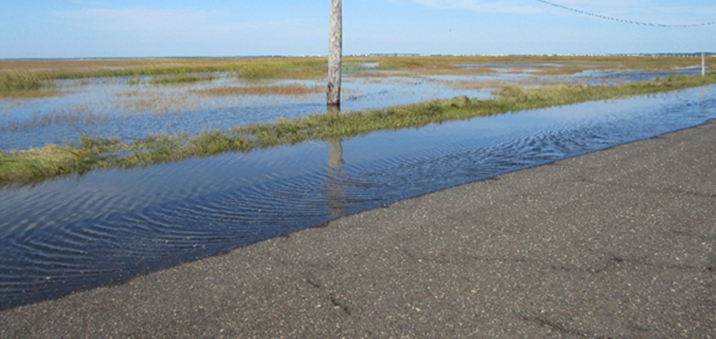
SLR can increase erosion of the marsh edge because increases in water depth reduce the amount of dissipation that occurs as incoming waves move across tidal flats (Kirwan and Megonigal 2013). Adding structures such as marsh sills and breakwaters can be an adaptive measure to attenuate waves, reducing erosion by reducing the wave energy hitting the marsh edge and also allowing more sediment to settle out of the water column. Raising these structures over time is an additional adaptive measure.
Reduction in reef exposure–the amount of time the crest is above MHW–because of SLR may be particularly damaging to some oyster reefs (Ridge et al 2015). However, at least one study suggests that oysters are capable of outpacing SLR (Rodriguez et al. 2014). Providing substrate at higher elevations is one potential strategy for combating the impacts of future SLR on reef restoration. For example, increasing the crest elevation of a reef or reef structure will accommodate future SLR. In that manner, an emergent reef or reef structure will convert to an intertidal reef and then possibly to a subtidal reef over time if reef growth is outpaced by SLR. Yet another alternative is to design a reef or structure with a crest elevation suitable for current sea level conditions, but with a crest width that is large enough to accommodate the addition of material to its crest over time. Doing so allows the practitioner to optimize crest elevations for observed SLR instead of using SLR projections.
Ocean temperatures are known to affect coral reef systems. Rising ocean temperatures and ocean acidification decrease the long-term sustainability of coral reef systems (Hoegh-Guldberg et al. 2007).
Beaches have some natural capacity, depending on the sand supply, to keep pace with historical rates of SLR. Like coastal marshes, the ability of a beach to naturally respond to SLR depends on the availability of sediment and the ability to migrate landward. This is particularly true for barrier islands. Their ability to adapt to long-term SLR is governed by overwash during storms and natural island recovery during calmer periods. Established infrastructure, particularly coastal highways, may impede this process over time.
When retreat is not possible, beach nourishment and renourishment are excellent examples of direct actions that are incorporated in both the planning and design phases of a project to accommodate changes. Beach nourishment is an effective strategy used to combat shoreline retreat and erosion, and to reduce storm damage to upland infrastructure (Houston 2016). The presence of the infrastructure impedes the ability of the beach and dune system to retreat in response to anthropogenic, storm and SLR impacts. At the planning level, a management plan and financial commitment are established to maintain the feature over time. The maintenance frequency (i.e., renourishment interval) is determined during the design phase and adjusted during the life of the project as appropriate.
The required rates of nourishment vary by a factor of three from moderate to high future SLR projections. The costs of nourishment could therefore increase by similar amounts because of the increased volume of sand required to maintain shoreline position over time. Even if the increased project costs are appropriate for the benefits they provide, access to suitable quantities of beach-compatible sand is cited as a potential obstacle to long-term success (Parkinson and Ogurcak 2018). Therefore, the long-term viability of beach nourishment varies on a case-by-case basis, depending on site-specific requirements and reasonable projections of SLR and its impacts.
In contrast to nature-based solutions, traditional protective strategies lack the inherent ability to adapt to SLR over time. Bulkheads, revetments, and seawalls may be designed in such a way as to accommodate future SLR impacts. For example, you can increase the cap elevation of a seawall to accommodate a MSL position that is higher at the end of the expected project design life than at its beginning. One could elect to increase the armor stone used in a rock revetment to accommodate potentially larger wave heights in the future as depths at the structure increase with SLR. While accommodating SLR in infrastructure design is possible, the actual outcomes are uncertain. Furthermore, for much of its design life, that structure may possess more capacity than is required to meet resilience needs. This is one of the defining hallmarks that distinguishes traditional approaches from properly designed nature-based solutions: the latter have the capacity to adapt naturally over time, on their own, through biological, ecological, and geological processes.
Incorporating nature-based solutions into transportation planning has several advantages, three of which are highlighted below:
Nature-based solutions could contribute to meeting transportation planning requirements. As covered in the section below on Federal Requirements and Relevant Policies, transportation agencies are required to consider approaches to increase the resilience of the transportation system.2 Agencies also are required to include a discussion of potential environmental mitigation activities and potential areas in which to carry out these activities in their long-range transportation plans.3 Where nature-based solutions are based on the existing habitat types in the project area, they have the potential to serve as environmental mitigation activities while increasing roadway resilience, which makes them a practical way to partially address these requirements.
Transportation planners can facilitate coordination and collaboration with stakeholders to mobilize larger projects. Conducting planning at the system level allows identification of potential large-scale, nature-based projects that may be implemented in coordination with other agencies, as discussed in Section 3.2, Stakeholder Engagement . For example, the development of a programmatic mitigation plan may allow stakeholders to identify opportunities and pool resources to accomplish a project that serves multiple purposes. Transportation planners also can help facilitate coordination with other coastal plans and studies, such as Hazard Mitigation Plans, State Coastal Management Plans, and USACE flood risk studies.
The planning process allows nature-based solutions to be considered in a systematic manner across a planning area or State. Following the FHWA Eco-Logical approach (see Using an Ecosystem Approach) and developing a Regional Ecosystem Framework allow the pre-identification of locations where nature-based solutions may be appropriate given existing natural resources. This information can be overlaid with transportation planning scenarios to understand opportunities, screen transportation projects, spark discussion with partners, and be provided to engineers for use in project development and design.
There are two Federal requirements that could, in part, be addressed through the consideration and planning of nature-based solutions. There also is the option to create a programmatic mitigation plan, which can incorporate nature-based solutions.
Discuss potential environmental mitigation activities and locations. The 20-year metropolitan transportation plan (MTP) and long-range statewide transportation plan (LRSTP) must include:
"[a] discussion of types of potential environmental mitigation activities and potential areas to carry out these activities, including activities that may have the greatest potential to restore and maintain the environmental functions affected by the [MTP and LRSTP]. The discussion may focus on policies, programs, or strategies, rather than at the project level. The [State and metropolitan planning organization (MPO)] shall develop the discussion in consultation with applicable Federal, State, regional, local and Tribal land management, wildlife, and regulatory agencies."4
As you are considering environmental mitigation activities and locations during transportation planning, consider their resilience functions. Are there natural areas that make sense to restore or protect because they are providing a resilience value to a road in addition to providing critical habitat?
Improve the resiliency of the transportation system to natural hazards. 23 CFR § 450.206 (a) calls for State DOTs and MPOs to "carry out a continuous, cooperative, and comprehensive statewide planning process that provides for consideration and implementation of projects, strategies, and services that will ... improve the resiliency and reliability of the transportation system and reduce or mitigate stormwater impacts of surface transportation." As described in this guide, nature-based solutions can serve as a first line of defense and improve the resilience of roads in the coastal environment. For example, if properly designed, investing in the preservation, enhancement, and/or construction of natural shorelines can enhance the resilience of transportation assets protected by that shoreline.
Consider developing a programmatic mitigation plan. Transportation agencies may choose to develop a programmatic mitigation plan in consultation with partner agencies with jurisdiction and special expertise in the resource areas, as part of the statewide and metropolitan transportation planning process. Programmatic mitigation plans address the potential environmental impacts of future transportation projects on a regional scale.5 These collaborative plans allow transportation and resource agencies to eliminate redundant investments, share data, and identify potential mitigation sites more effectively. The creation of this regional plan should reduce the level of coordination required on individual projects and reduce uncertainty around the level of effort needed to address potential ecological impacts. Another benefit of programmatic mitigation plans is that the plan recommendations will be given substantial weight during the environmental review and permitting process.6 Consider identifying opportunities for nature-based solutions in a programmatic mitigation plan, which could make it easier to apply them to individual projects and reduce the need for offsite mitigation. Section 6 provides more information on mitigation opportunities.
An ecosystem planning approach focuses on sustaining or restoring impaired ecological systems, ecological functions, and their values. Instead of project boundaries, an ecosystem approach is applied within a geographic framework defined mostly by ecological boundaries. In the coastal environment, boundaries may be defined by ecology, geology, or by sediment transport (often called a littoral cell or littoral system).
Planning beyond the project boundaries allows habitat conservation to be considered on a broader, ecosystem scale, and can lead to more cost-effective opportunities to avoid and minimize impacts. This form of ecosystem-based management allows the consideration of a specific project's connection to the broader system, which is key to enhancing the economic, social, and ecological resilience provided by nature-based solutions (Wowk and Yoskowitz 2017).
To integrate ecosystem planning with transportation planning, FHWA, Federal environmental permitting agencies, and four State DOTs7 together developed the Eco-Logical approach, which is a landscape-scale approach to environmental systems planning (FHWA 2019c). The Eco-Logical framework provides an excellent model for the planning and implementation of nature-based solutions. Eco-Logical articulates a vision of how to integrate infrastructure development and ecosystem conservation to harmonize objectives and accelerate project delivery. Figure 3-1 displays a map of locations across the country that have implemented Eco-Logical, See the FHWA Eco-Logical toolkit for more information on the successes of each organization.
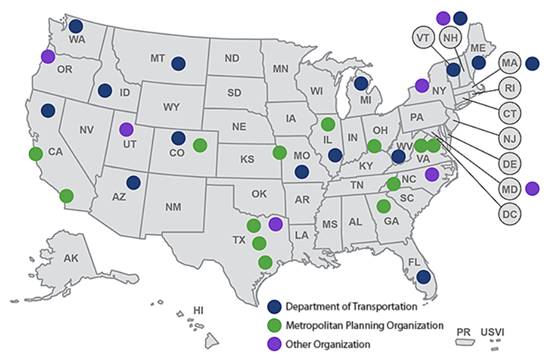
The Eco-Logical framework organizes current methods for addressing natural resource identification, avoidance, minimization, and mitigation into a systematic, step-wise process that starts at the beginning of the transportation planning process and concludes with establishing programmatic approaches to recurring natural resource issues that are implemented at the project level. The nine-step framework is intended to be implemented through collaboration and coordination with other agencies. The framework is shown graphically in Figure 3-2 and the steps are listed below:
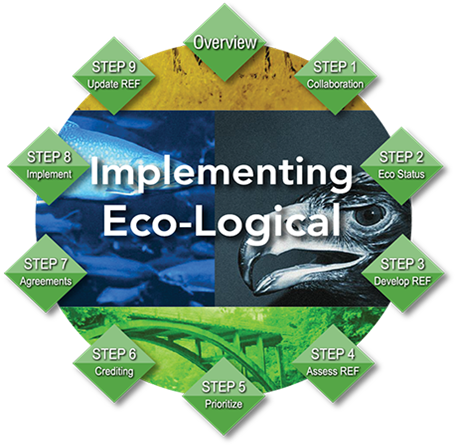
Central to the Eco-Logical framework is Step 3, Develop a Regional Ecosystem Framework (REF). A REF typically consists of geographic information system (GIS) layers identifying existing natural resources, such as wetlands and priority locations for mitigation and conservation. For States that already have a REF, they can easily leverage it for identifying areas for nature-based solutions. For States that have not yet developed a REF, doing so will both help them in environmental compliance and permitting, as well as in identifying opportunities for flood risk mitigation through nature-based features.
Importantly, the REF, or similar GIS-based approaches, will identify existing nature-based features (e.g., marshes, reefs, mangroves, beaches, dunes) that are already providing resilience to coastal highways. If the features are performing well, no direct action is required. Simple, periodic assessment of their condition is advised. If the features show signs of distress, such as considerable marsh or beach erosion, a plan for stabilizing or restoring their function can be developed and implemented. Maintaining existing nature-based features will, in general, be less expensive than complete replacement/restoration. The regulatory effort associated with maintaining existing features is typically not as great either, particularly when there are concerns regarding habitat conversion.
Examples of agencies that are using REFs and GIS-based maps to identify areas for nature-based solutions include the following:
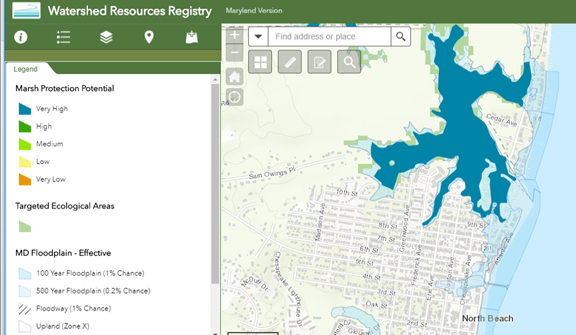
Planners can align the Eco-Logical framework with the transportation planning process to help identify locations for consideration of nature-based solutions. This integration encourages consideration of both large-scale projects, such as those discussed in Section 3.2 Stakeholder Engagement below, and smaller projects that can be used to reduce erosion or increase storm resilience at a particular transportation project site.
Specific approaches for considering nature-based solutions in the transportation planning process are indicated in Figure 3-4. Although integrating nature-based solutions into each step of the transportation planning process is not required, this guide provides options that transportation agencies may consider, if appropriate. More information on each step is provided after the figure.
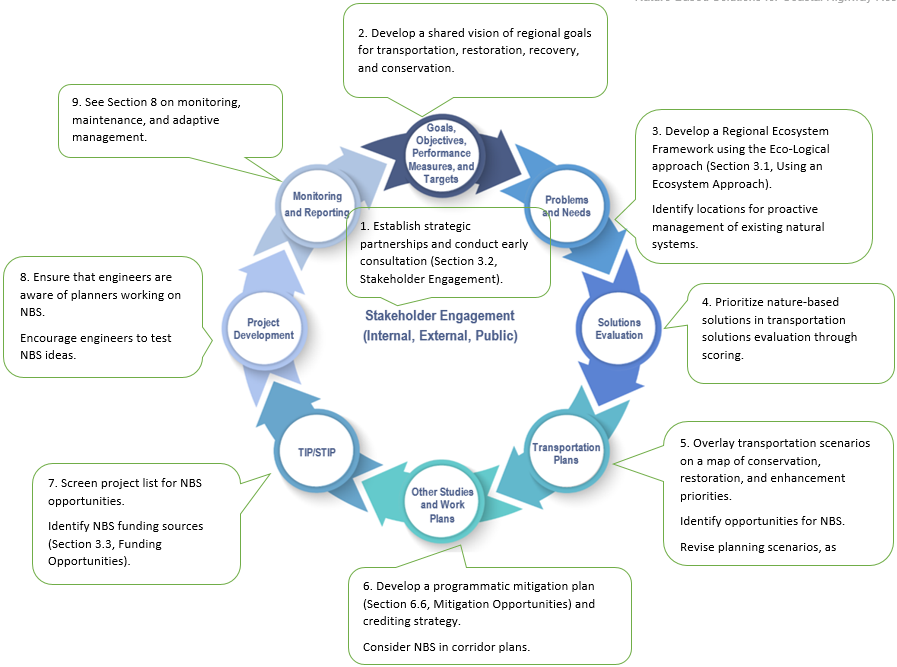
Partnerships enable transportation agencies to tap into larger, landscape-scale projects that utilize land and areas outside of the control of transportation agencies to protect all upland assets. These large-scale projects can protect roads, as well as other upland infrastructure and buildings. Transportation agencies should be involved in the partnerships that develop these types of projects so that they can be part of the planning and funding discussions to ensure that their needs are met when these projects are being designed and implemented. If transportation agencies are the ones spearheading the project, Section 5.1, Assembling the Team, provides more information on recommended team members for the design and implementation of nature-based solutions.
The Eco-Logical framework discussed earlier in this section focuses on building and strengthening collaborative partnerships for landscape-scale projects. The initial steps for building partnerships include the following:
State DOTs looking for potential partners in the implementation of nature-based solutions are encouraged to reach out to their State Coastal Management Program office and their nearest NOAA Sea Grant program office (NOAA 2019). These programs are often the best first contact for understanding potential partnership (and funding) opportunities in a specific State or region. Many coastal States also have National Estuary Programs (NEPs) or National Estuarine Research Reserves (NERRs) that have expertise related to nature-based solutions. Indeed, programs such as NEP and NERR often perform or support this type of work and can be of great help to transportation agencies. While not an exhaustive list, other pertinent Federal, State, and other organizations are listed below:
Early consultation with regulators enables concerns and differences in approaches to be heard and solved early in the process. One way to ensure that this consultation occurs is by establishing an integrated planning approach, as specified in the Eco-Logical framework. This process should result in clear benefits at the project level by ensuring that resource agencies are informed of the projects that are under consideration and development. If the transportation agency is planning a project consistent with the REF, the resource agency response(s) should be predictable.
Engaging stakeholders (e.g., relevant conservation NGOs and/or local groups working in the area) and providing the public (e.g., adjacent landowners, business owners that earn revenue from the estuary, recreational visitors) with information about nature-based solutions is an important part of the planning process. Lack of advocacy and the absence of a broader context for making shoreline management decisions are often barriers to implementation of nature-based solutions (RAE 2015). These barriers can be overcome through education and outreach during a transportation project's public engagement process. For example, public notification meetings provide opportunities to describe potential nature-based solutions, as well as their specific role in the project, and solicit stakeholder feedback. Doing so presents an opportunity for the community to better understand the impacts on the ecosystem and the need for resilient transportation infrastructure. More ways to communicate with the public during and after construction, and set expectations for the project, are provided in Section 7.3, Phases of Construction.
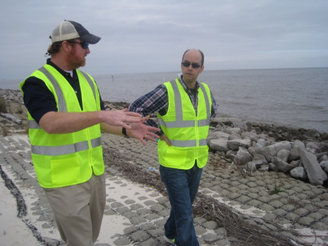
Soliciting stakeholder feedback also can be used to garner public support for a specific project and, in some cases, it can create opportunities for volunteerism. In their report on implementation barriers, the Restore America's Estuaries group specifically recommends the deliberate use of volunteers for project implementation. Doing so provides obvious economic benefits in terms of reduced labor costs and, at the same time, educates the public in a manner that raises awareness and expands the advocacy base (RAE 2015).
In addition, Tribal consultation may be required if cultural resources are present, which is common along the coast. Tribal governments may have significant interest, input, and knowledge of natural habitats that could lend support to successful nature-based solutions.
The multiple benefits of nature-based solutions for highways open up eligibility for funding from at least three sectors: transportation, coastal restoration, and hazard mitigation. Strategies that use multiple funding sources and organizations can accomplish larger efforts than could be accomplished alone. Transportation agencies are encouraged to work closely with their project partners to creatively identify and pursue funding for nature-based solutions. The text box below provides one example of cost-sharing (Tabb 2019).
Activities to plan, design, and construct features to protect highways from current and future hazards, such as flooding, are generally eligible under major FHWA funding programs, which total more than $40 billion per year nationwide (FHWA 2012). That said, there are many competing needs for highway maintenance and construction, and State DOTs and MPOs generally have more project ideas than they are able to fund.
Transportation planning for nature-based solutions is eligible for Metropolitan Planning funds, Statewide Planning and Research funds, and the Surface Transportation Block Grant Program. Consideration of nature-based solutions in the transportation planning phase of a project is not only encouraged, it can be used to address the resilience considerations formalized under the Fixing America's Surface Transportation (FAST) Act.
Current sources of coastal restoration funding include the following:
Finally, to the extent that a nature-based solution can qualify for compensatory mitigation that the DOT would otherwise need to pay for, it essentially provides a direct monetary benefit. For example, on the Northwest Florida Panhandle, mitigation credits for tidal marshes range from $130,000 to $330,000 per acre. If a DOT were able to use a 4-acre nature-based solution as out-of-kind mitigation for affected areas, they could potentially save $520,000 to $1.32 million in mitigation credits. More information on mitigation opportunities is provided in Section 6.6 Mitigation Opportunities.
Selecting an appropriate nature-based solution requires at least two critical steps: (1) site characterization, and (2) resilience characterization. These steps help determine what type of solution will best fit project needs. This section provides an overview of each step and points the reader to additional resources in Appendix A. The reader also will learn about some of the important regional considerations that make the design of nature-based solutions somewhat unique around the United States.
The process of site characterization allows you to identify and better understand the conditions at your site. These conditions ultimately determine the processes that your selected nature-based solution will experience in that setting. Resilience characterization, which often occurs prior to or during the planning phase, identifies your transportation resilience needs (i.e., flood reduction, erosion reduction, shoreline stabilization, wave attenuation) and determines what environmental benefits an appropriate nature-based solution may provide.
Site characterization is the process of developing an understanding of historical and present site conditions, and, in some cases, projecting those conditions into the future. Site characterization allows you to place present site conditions within the context of what has happened over time while identifying the relevant physical, ecological, and geological processes at play. In other words, this process answers the simple question, What does nature support at this location? When thinking about nature-based solutions, it is best to let nature be your guide.
The practitioner typically characterizes site conditions in at least two phases: first, through preliminary or desktop analysis, and, second, through extended analysis and/or site visits. During the desktop analysis phase, you can use available datasets, maps, charts, imagery, and whatever other information you can obtain about your site to develop an initial characterization. While helpful, there are certain characteristics of a site that are not obvious on a photo or a map. Thus, you should use site visits to refine your understanding of site conditions, particularly the conditions of adjacent sites and shorelines that may affect or be affected by your project. A site visit is also an excellent opportunity to collect additional information about the conditions at your location, and possibly even take measurements of some key elements to fill in gaps from the desktop analysis.
It is often necessary to visit a site many times because the time of day, season, and weather play important roles in site characterization. If possible, you should perform site visits at low tide and high tide (see for example Figure 4-1); during calm and breezy days (wave action); on a weekday and on a weekend (boat wakes); and during the summer/fall and again during the winter/spring to capture seasonal changes in light availability, water levels, the presence of ice, and other factors. Substituting some of these site visits with appropriate data and/or measurements taken at or near your site is acceptable.
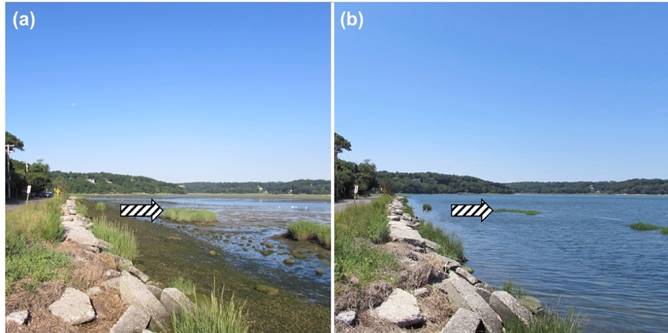
This guide is written for a geographically diverse audience, including transportation professionals across all regions and territories of the United States. As such, presenting specific information for every State, region, island, and territory is unrealistic. The information provided in this section should therefore serve as a framework by which to characterize your site. You may substitute your own information to customize the process, as needed. We will borrow the site characterization framework of Miller et al. (2015) with some minor modifications. The site characterization framework from Hardaway et al. (2017) could also be used for this process.
The site characterization framework of Miller et al. (2015) uses five categories to organize the typical site condition requirements: system parameters, hydrodynamic parameters, terrestrial parameters, ecological parameters, and additional parameters. Table 4-1 lists some of the key site characterization parameters in each of the five categories. Table 4-2 lists typical values for each of these parameters using a simple scale of low/mild, moderate, and high/steep.
| System Parameters | Hydrodynamic Parameters | Terrestrial Parameters | Ecological Parameters | Additional Parameters |
|---|---|---|---|---|
| 1. Shoreline Type 2. Infrastructure 3. Erosion Rate 4. Sea Level Rise 5. Tide Range |
1. Wind Waves 2. Boat Wakes 3. Currents 4. Ice 5. Storm Surge |
1. Upland Slope 2. Shoreline Slope 3. Width 4. Nearshore Slope 5. Water Depth 6. Soil Strength |
1. Water Quality 2. Soil Type 3. Sunlight 4. Salinity |
1. Permits 2. End Effects 3. Constructability 4. Species 5. Debris 6. Monitoring |
| Parameter Name | Evaluation Criterion | |||
|---|---|---|---|---|
| Low (L) | Moderate (M) | High (H) | ||
| System | Shoreline Type | High Bank | Low Bank | Open Coast Shoreline |
| Infrastructure | Minor Road, Drainage | Highway, Causeway | Evac, Bridge, Tunnel | |
| Erosion Rate | < 2 feet/year | 2–4 feet/year | > 4 feet/year | |
| Sea Level Rise | < 0.2 inch/year | 0.2–0.4 inch/year | > 0.4 inch/year | |
| Tide Range | < 1.5 feet | 1.5–4.0 feet | > 4 feet | |
| Hydrodynamic | Wind Waves (Fetch) | < 1 foot / < 1 mile fetch | 1–3 feet / 1–5 miles fetch | > 3 feet / 5–15 miles fetch |
| Boat Wakes | < 1 feet | 1–3 feet | > 3 feet | |
| Currents | < 1.25 knots | 1.25–4.75 knots | > 4.75 knots | |
| Ice | < 2 inches | 2–6 inches | > 6 inches | |
| Storm Surge | < 1 feet | 1–3 feet | > 3 feet | |
| Terrestrial | Upland Slope (V:H) | < 1:30 | 1:30–1:10 | > 1:10 |
| Shoreline Slope | < 1:15 | 1:15–1:5 | > 1:5 | |
| Width | < 30 feet | 30–60 feet | > 60 feet | |
| Nearshore Slope | < 1:30 | 1:30–1:10 | > 1:10 | |
| Water Depth | < 2 feet | 2–5 feet | > 5 feet | |
| Soil Strength | < 500 lbf/ft2 | 500–1,500 lbf/ft2 | > 1,500 lbf/ft2 | |
| Ecological | Water Quality | Poor | Fair | Adequate |
| Soil Type | Fine, organic material | Medium to coarse sand | Coarse sand to cobble | |
| Sunlight Exposure | < 2 hours/day | 2–10 hours/day | > 10 hours/day | |
| Salinity | < 5 ppt | 5–18 ppt | > 18 ppt | |
Key: lbf/ft2 = pounds force per square foot; ppt = parts per thousand
Table 4-3 provides additional context regarding how selected (general) nature-based solutions relate to the values of key site characterization parameters (from Table 4-2). This table aids in the decision-making process in two ways: first, it enables the practitioner to quickly identify nature-based solutions that most closely match the conditions at their project site, and, second, it provides a framework by which to compare and select various alternatives and site locations.
| Parameter Name | Marsh | Marsh and Sill or Reef | Mangrove and Reef | Reef | Beach and Dune | Pocket Beach | Cobble Beach | Maritime Forest | |
|---|---|---|---|---|---|---|---|---|---|
| System | Shoreline Type | L/M | L/M/H | L/M/H | M/H | M/H | L/M | M/H | L/M/H |
| Infrastructure | L | L/M | L/M | L/M | M | L/M | L/M | M/H | |
| Erosion Rate | L | L/M | L/M | L | M | L/M | M/H | L/M | |
| Sea Level Rise | L/M | L/M | L/M | L/M | L/M/H | L/M | L/M | L/M/H | |
| Tide Range | M | L/M | L | L/M | L/M/H | L/M | L/M/H | n/a | |
| Hydrodynamic | Wind Waves (Fetch) | L | L/M | L/M | L/M/H | L/M/H | L/M/H | L/M/H | L/M/H |
| Boat Wakes | L | L/M | L/M | L/M/H | L/M/H | L/M/H | L/M/H | n/a | |
| Currents | L | L/M | L/M | L/M | L/M/H | L/M/H | L/M/H | n/a | |
| Ice1 | L | L | n/a | L | L/M/H | L/M | L/M/H | n/a | |
| Storm Surge | L/M/H | L/M/H | L/M/H | L/M | L/M/H | L/M | L/M | L/M/H | |
| Terrestrial | Upland Slope | L/M | L/M | L | L/M | L/M/H | L/M/H | L/M/H | L/M |
| Shoreline Slope | L/M | L/M | L/M | L/M | L/M | L/M | M/H | L/M/H | |
| Width | H | M/H | M/H | M/H | H | M/H | L/M/H | L/M/H | |
| Nearshore Slope | L/M | L/M | L/M | L/M/H | L/M/H | L/M/H | L/M/H | n/a | |
| Water Depth | L/M | L/M | L/M | L/M | L/M/H | M/H | M/H | n/a | |
| Soil Strength | L | M/H | L | L/M | L/M | M/H | M/H | n/a | |
| Ecological | Water Quality | L/M/H | L/M/H | L/M/H | M/H | L/M/H | L/M/H | L/M/H | n/a |
| Soil Type | L/M | L/M | M | M | M/H | M/H | M/H | M | |
| Sunlight Exposure | M/H | M/H | M/H | M/H | L/M/H | L/M/H | L/M/H | M/H | |
| Salinity2 | L/M/H | L/M/H | M/H | M/H | L/M/H | L/M/H | L/M/H | n/a | |
1 Ice: Mangroves and corals exist in tropical and subtropical settings where ice is not present; oyster reefs can tolerate intermittent ice.
2 Salinity: Select the appropriate plant and/or reef type for the salinity, exposure, and setting.
n/a: Not applicable for the parameter or feature
The following subsections describe the key site characterization parameters outlined in Section 4.1. Table 10-1 in Appendix A provides recommendations to help the reader locate or identify appropriate data or methods for evaluating the key site characterization parameters.
System parameters relate to large-scale or regional conditions generated or influenced by external factors. Some examples include shoreline type, infrastructure, erosion rate, sea level rise, and tide range.
Shoreline Type refers to the characteristics of the existing shoreline and its susceptibility to inundation and erosion. Examples of shoreline type include low banks composed of sand, cobble, or vegetation; high banks of similar composition; coastal bluffs; and open ocean coastline. Susceptibility to erosion is directly correlated with exposure to wave energy. Assessment of shoreline type and condition typically requires a site visit unless recent aerial imagery is available.
Infrastructure refers to the type of coastal highway infrastructure being considered. Examples include less critical drainage infrastructure (e.g., conveyance channels, culverts, hydraulic structures) and minor/local roads; somewhat critical major roads (highways) and causeways; and critical bridges, tunnels, and evacuation routes. Document the full suite of transportation infrastructure and supporting services within the project area to ensure that all components are considered in project design.
Erosion Rate may refer to a vertical change in grade and/or lateral shoreline retreat. For coastal highways, the latter is of greater importance. Erosion rate has dimensions of length per time (e.g., feet per year). Historical shoreline positions, maps, aerial imagery, and topographic survey data, collected at two or more times in the past, provide the information needed to estimate a rate of erosion (or retreat). Use topographic survey data to estimate vertical erosion rates.
Sea Level Rise is the long-term change in the globally averaged mean sea level position. Sea level rise is an important factor when designing nature-based solutions because many components–both natural and constructed–are sensitive to mean sea level. Estimates of sea level rise at a project location must account for vertical land movement (subsidence or uplift) and other regional processes that combine to yield local variations in sea level rise, either larger or smaller rates than global mean sea level rise (GMSLR). Local factors produce RSLR. Local RSLR rates vary considerably throughout the United States. The NOAA/CO-OPS Tides & Currents website (NOAA 2018) provides measurements of historical RSLR trends at long-term tide gauges along the U.S. coastline. However, future projections are for higher rates of RSLR in most regions of the United States. Consider using the USACE Sea-Level Change Curve Calculator (USACE 2019c) and an appropriate scenario-based projection of RSLR, such as Sweet et al. (2017), for your location. This online tool considers the combined effects of GMSLR, as well as local and/or regional contributions that add to or subtract from that rate.
Tide Range is the vertical distance between the average high tide and average low tide at a specific location. Nature-based solutions are sensitive to tide range (Figure 4-2). The tide range often determines where certain natural elements exist on the landscape (e.g., vegetation and reefs). Tide range also is a critical factor in regulating wave energy dissipation by structural features. Tidal data, including tide ranges and tidal datums, are available on the NOAA/CO-OPS Tides & Currents website (NOAA 2018) at hundreds of locations across the United States. Tidal datums refer to the 18.6-year average of tidal positions at a specific location. Examples include mean higher high water (MHHW), mean high water (MHW), mean sea level (MSL), mean low water (MLW), and mean lower low water (MLLW). See FHWA (2008) for more information on tides and tidal datums.
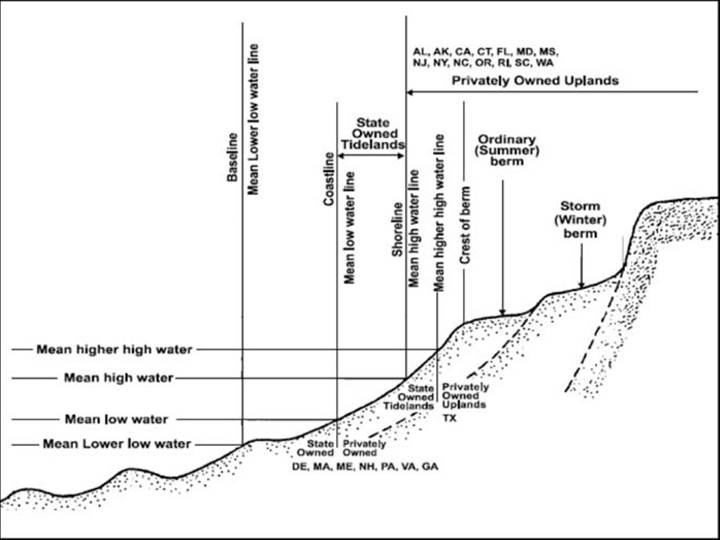
Hydrodynamic parameters represent the local "forces" that influence the type and condition of your shoreline, as well as the local geology and ecology of your site. Hydrodynamic parameters serve as the basis of most engineering and ecological design in nature-based solutions.
Wind Waves are waves that travel across a body of water as the result of local and/or distant meteorological conditions (wind and pressure). These are often the most persistent and largest waves that affect shorelines and infrastructure. Wind wave characteristics, namely wave height and wave period as defined in Figure 4-3, are a function of wind speed, wind duration, water depth, and fetch length. Fetch length refers to the distance that wind blows over the surface of the water to "build" the wave. Fetch is often the limiting factor for wave development. Accordingly, these waves are called "fetch-limited" waves. FHWA (2008, 2014) provide tools for estimating fetch-limited waves. Section 5 contains more information on wave characteristics for the purpose of engineering and ecological design.
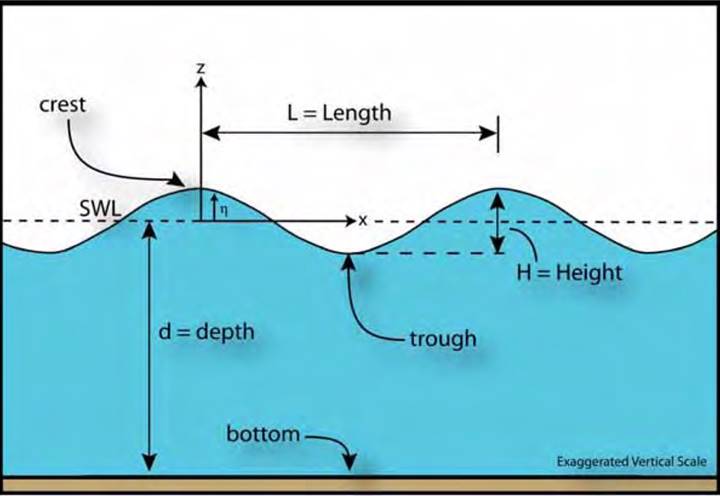
Boat Wakes are ship- or vessel-generated waves. Boat wakes are sometimes the "design waves" along shorelines with small fetches, but near waterways, navigation channels, marinas, harbors, and boat launches. Like wind waves, wave height and period are the descriptive properties of boat wakes. There are fewer tools for estimating boat wake magnitude and frequency at a specific location. Miller, et al. (2015) provides a method for estimating boat wakes, but often a visual survey of boat wake activity is more appropriate.
Currents refer to the movement or flow of water along the shoreline. Currents, like velocities, have dimensions of length per time (e.g., feet per second, meters per second). Currents sometimes affect the design of nature-based solutions, particularly near tidal inlets, along the shorelines of tributaries and tidal creeks, and when the project uses nearshore structures such as breakwaters (see Section 5 for more information). Strong shore-parallel currents uproot vegetation, erode the bank, and transport large floating debris that can damage structures and vegetation, including floating ice blocks in some regions. Current data are unavailable for most project locations. You can supplement the lack of current data with visual observations, simple or sophisticated measurements, and/or hydrodynamic modeling, when necessary.
Ice presents a substantial threat to nature-based solutions. Like floating debris, ice blocks impose large impact forces on structures. Ice accumulation on vegetation and/or structures induces uplift, through ice buoyancy, with the rising tide, and it increases the chances of overturning on a falling tide. Ice accumulation on riprap during high tide results in an overturning moment when the water level falls, and possible movement of the stone; some refer to this as "ice picking" (FHWA 2014).
Storm Surge is the increase in the time-averaged (still) water level position as the result of all meteorological forcing. Storm surge includes the contributions of wind, pressure, waves, currents, and freshwater input to the coast, and exists on top of the astronomical tides at a given location. Their combination is referred to as the storm tide or total water level. Determining the magnitudes of storm surge and the magnitudes of each contributing factor is important for selecting an appropriate nature-based solution and for evaluating its flood-reduction benefits. Regulatory flood maps show extreme event (i.e., 1 percent and 0.2 percent annual chance) still water elevations. The corresponding Flood Insurance Study documents will often contain additional return period water levels. Some NOAA tide stations provide return period water level estimates (most do not contain the effects of waves, which can be significant). The USACE Coastal Hazards System website provides high-resolution stormwater level data in some regions (USACE 2019d).
Terrestrial parameters characterize the condition of the upland, land-water interface (i.e., the shoreline) and the nearshore (i.e., submerged) regions. The combination of terrestrial and hydrodynamic parameters dictates the shoreline type, condition, and resilience. Successful nature-based solutions attempt to mimic, through engineering design and construction, the terrestrial parameters of nearby stable shorelines. Figure 4-4 shows the location of the terrestrial parameters relative to the coastal profile.
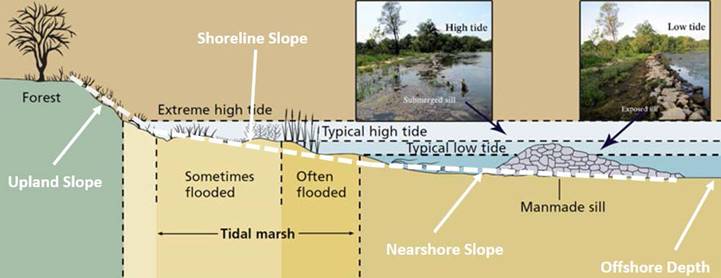
Upland Slope is generally the slope of the land between the MHHW tidal elevation and the point at which the upland attains a mostly constant elevation. Upland slope often determines the vegetative communities and susceptibility to severe erosion, or scarping, during storm events. Milder slopes are more vulnerable to flooding, but less vulnerable to extreme erosion. Stormwater runoff over steep upland slopes contributes to profile erosion and should be mitigated through traditional stormwater management techniques on the upland. Topographic survey data provide upland slope values. You can also use Light Detection and Ranging (LiDAR) measurements, of adequate resolution, to calculate upland slope.
Shoreline Slope is the slope of the intertidal shoreline between the MLLW and MHHW datums. Nature-based solutions, particularly those involving vegetation, are very sensitive to shoreline slope (see Section 5 for more information). LiDAR data are not always useful for calculating shoreline slope. A traditional survey conducted at low tide is the best way to measure shoreline slope.
Nearshore Slope is generally taken as the slope from the MLLW tidal datum to where the adjacent water bottoms attain a relatively constant depth. The nearshore slope affects many of the hydrodynamic site parameters, including the magnitude of storm surge, the balance between wave reflection and energy dissipation, the location of wave breaking, and the size of the active sand transport system (parallel and perpendicular to the shoreline). Steep nearshore slopes are less susceptible to storm surge, reflect more wave energy than they dissipate, and experience wave breaking closer to shore. Steep slopes are more vulnerable to wave runup and wave setup. The use of nearshore structures on steep slopes presents substantial engineering challenges. Milder nearshore slopes experience larger storm surges, dissipate wave energy, and force large waves to break further from the shoreline. The only way to measure the nearshore slope reliably is through traditional survey methods, including wading surveys and vessel surveys.
Width refers to the horizontal distance between the upland or infrastructure and the mean shoreline position. Along sheltered shorelines, minimum beach widths fall in the range of 40 to 60 feet for moderate tide ranges, while marshes may require 40 to 70 feet of width under similar conditions (Hardaway and Byrne 1999). Acceptable project width increases with tide range, wave exposure, and infrastructure sensitivity. Minimum beach widths along ocean shorelines may be 100 feet or more. Generally, infrastructure resilience increases in direct proportion to its distance from the shoreline (as mentioned in Section 2). Obtaining the preferred project width requires moving the upland/infrastructure landward or advancing the shoreline position seaward. Depending on easement and right-of-way ownership, advancing the shoreline seaward may be easier than moving the infrastructure.
Water Depth is the vertical distance from the water level, under normal conditions, to the seabed at or near the base of the nearshore slope. Water depth is reported on nautical charts, provided in many comprehensive digital elevation model datasets, and also easily measured with conventional tools. Shallow offshore water depths provide more natural dissipation of energy as waves approach your site, typically experience slower currents, and are active regions of sediment transport. The deeper the offshore water depth, the larger a wave can be at your project site. This is true of both wind waves and boat wakes, since the deeper water allows boats to travel closer to your project site. Greater water depths typically require more materials (e.g., fill, structural materials), but provide advantages when construction is performed from the water-side (see Section 7 for notes on construction). Shallower depths require less construction material, but water-side construction is more challenging because of the limited draft for barges and vessels. Section 5 identifies additional technical challenges associated with the construction of stone structures in shallow water depths.
Soil Strength refers to the bearing capacity of marine soils, which varies considerably across the United States, and sometimes even across a project site! The bearing capacity is an important factor in the design of structural elements in nature-based solutions. Structures that are placed on, or driven into, the seabed have the potential to settle, rotate, slide, or otherwise "move" when soil conditions are poor. Even moderately sized riprap can easily disappear when placed on poor soil. When gravity structures, such as breakwaters, sills, proprietary habitat units, and reefs, exert a pressure that exceeds a soil's bearing capacity, the structure will settle, and its effectiveness will diminish unless accounted for or mitigated. An example mitigation effort would be using advanced geotextiles, geofabrics, and geogrids laid under the structure, which will distribute the force over a larger area and reduce the pressure on the soil. Soil strength data are typically not accessible in the desktop analysis phase. Instead, one must perform direct measurements in the field (static cone penetrometer) or in the laboratory after gathering a soil sample or core sample.
Ecological parameters reflect the habitat conditions at a site. They often determine the type of biological and ecological communities, or habitats, which nature-based solutions seek to mimic and provide. Nature-based solutions both depend on and are directly influenced by ecological parameters, including water quality, soil type, sunlight exposure, salinity, and habitat.
Water Quality refers to the composition of the water in terms of its constituents, including the presence of nutrients, dissolved materials, and suspended solids. Basic water quality parameters include water temperature, salinity (addressed separately), pH, dissolved oxygen, and turbidity. The value of each parameter will dictate the presence, absence, success, or failure of biological and ecological communities in a nature-based solution. Other relevant water quality parameters include total inorganic nitrogen and total inorganic phosphorous. Some water quality data are found online at NOAA and/or U.S. Geological Survey (USGS) websites, but it is always preferable to obtain measurements from your site during project planning, design, and implementation.
Soil Type refers to the sediment characteristics at your site. Typical characteristics include median diameter, grain size distribution, angularity, carbonate content, and color. Median grain size and the percentage of fines (passing the number 200 sieve) determine project performance, particularly for beach nourishment projects. In such projects, matching the native grain size and keeping the percentage of fines to 1–2 percent or less are critical for project success. Using fill material that is smaller than the native material produces nearshore and shoreline slopes that are too mild. This translates to minor gains in project width. Using fill material that is larger than the native material produces nearshore and shoreline slopes that are too steep. Overly steep slopes result in scarping and poor performance of vegetated (marsh) slopes. Soil type is determined through standard geotechnical testing of "grab" samples taken from your project site.
Sunlight refers to the amount of available sunlight, or sunlight exposure, along the intertidal shoreline and in the water in the case of submerged aquatic vegetation. Large shade trees along the bank can reduce the available sunlight for emergent intertidal vegetation. High values of turbidity prevent or limit light penetration through the water column, limiting the photosynthetic activity of submerged aquatic vegetation.
Salinity refers to the amount of dissolved salt in the water. It is represented in parts per thousand (ppt) or partial salinity units (PSU), both having roughly the same scale where 0 ppt/PSU represents freshwater and 35 ppt/PSU represents oceanic seawater. The salinity at a site determines the types of vegetation (emergent and submerged) present at a location, the fish assemblages, and the presence of mollusks and crustaceans. You should obtain multiple salinity measurements at your site using a handheld water quality probe, and/or perform research regarding the variability of salinity at your project site. Knowing your typical salinity, and salinity range, is an important part of specifying the "natural" features in any nature-based solution.
There are additional considerations during the site characterization and conceptual design phases. These parameters may dictate the type, layout, and dimensions of the most appropriate nature-based solution for your site and need. Some of these considerations include permits, end effects, constructability, species, debris, and monitoring.
Permits are necessary for nature-based solutions. Any work performed seaward of the regulatory tidal datum, which is typically MHW, usually requires a Joint Coastal Permit from the authorized State coastal zone management agency and the district office of USACE, in addition to any appropriate local, municipal, county, or watershed permit or authorization. At a minimum, nature-based solutions will receive three permits upon successful conclusion of the permit review process: a water quality certification permit (from the State), a biological opinion from USACE, and a permit to fill or affect State lands. Section 6 provides more information on permitting. Early engagement of regulatory officials will aid in the selection of appropriate nature-based solutions.
End Effects refer to the interaction between the "ends" of your nature-based solution and the adjoining shorelines. Project planning and design should consider the potential for adjoining undefended shorelines (i.e., natural) to negatively affect your project's performance. You should also consider, and minimize or avoid, all negative impacts of your project on adjoining shorelines. This includes, but is not limited to, the potential for structures to redirect wave energy to adjacent shorelines; inhibit and/or trap the natural movement of sediment, both parallel and perpendicular, to your shoreline; and the potential for your project to exacerbate flooding on adjoining properties.
Constructability refers to the viability of constructing your preferred project. A desirable nature-based solution is one that is technically feasible, reasonable, justifiable, and, most importantly, constructible. If site conditions prohibit construction of the project, then ultimately that project design will not work for that location. Constructability touches on many aspects, including site accessibility (by land or by water), safety, access to qualified contractors, availability of materials, time of year, regulatory restrictions, and potentially other factors. Section 7 provides additional information about construction means and methods.
Species refers to the presence and abundance of native, non-native, and/or invasive species at a project site. We mostly think of upland plants when we use this language, but non-native and invasive aquatic species and vegetation exist and may negatively affect project performance. Plant, wetland, and fisheries ecologists should be involved to characterize the species abundance, richness, and coverage for the project site. Mimicking healthy nearby plant communities is a key to project success. For example, management of invasive species may be a key component of project maintenance (see Section 8 for more information on monitoring and maintenance).
Debris, particularly large floating debris, damages structures and emergent vegetation during storm events. There are no simple preventative controls for limiting debris impacts during storms, but their effects should be considered during project design. When structure crests are left low in elevation, debris may pass over during storm events and ultimately end up damaging the shoreline or vegetation. Removal of large debris from the wrack line following a storm event prevents repetitive damage during future events (see Figure 4-5). When structure crests are kept high relative to stormwater levels, the practitioner should orient the structure in a way that minimizes impact forces as much as practicable.
Monitoring refers to the routine collection of project parameter values and conditional assessments of performance for some time period following construction. Monitoring plans range from very simple to very complex. Monitoring is required under some permit conditions, but, in many cases, is optional. However, even basic, low-level routine monitoring provides critical data for performing preventative maintenance in order to stave off major problems. Section 8 is devoted to a discussion of monitoring, maintenance, and adaptive management.
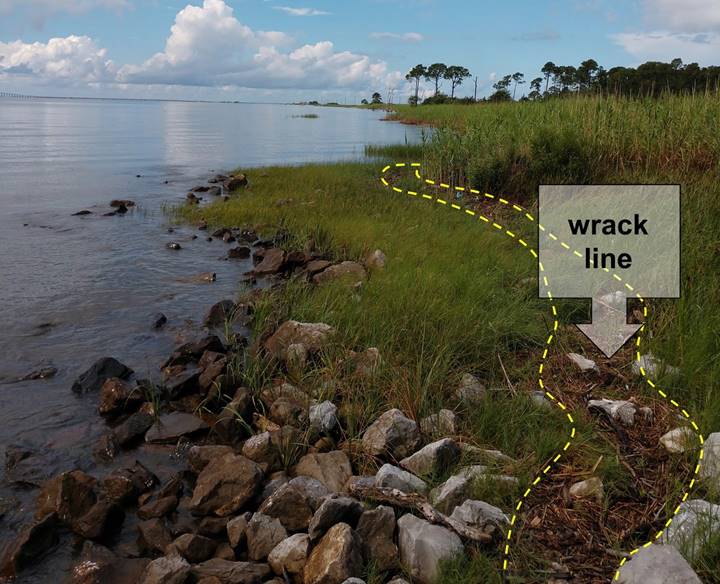
Resilience characterization is simply identifying and/or assessing coastal highway vulnerabilities, and then determining their resilience requirements. Resilience needs may include flood reduction, wave attenuation, erosion reduction, shoreline stabilization, and possibly many others.
Table 4-4 lists some common coastal highway vulnerabilities. More information on identifying and assessing the vulnerability of coastal highways to extreme events and sea level rise can be found in FHWA (2014) and FHWA (2019a).
| Highway Hydraulics | Coastal Roadways | Coastal Bridges | Coastal Tunnels |
|---|---|---|---|
| 1. Sea Level Rise (SLR) 2. Increased Flooding from SLR 3. Storm Surge 4. Sedimentation |
1. Sea Level Rise 2. Increased Flooding from SLR 3. Storm Surge 4. Wave Action 5. Erosion 6. Shoreline Retreat |
1. Sea Level Rise 2. Storm Surge 3. Wave Action 4. Erosion |
1. Sea Level Rise 2. Storm Surge 3. Wave Action |
Under an intermediate to high future sea level rise projection, the U.S. Route 1B causeway in New Castle, NH (Figure 4-6), would be inundated 188 times in 2060 and 338 times in 2065. As documented in FHWA (2018d), New Hampshire DOT studied the flood reduction and ecological benefits of a range of options: (1) no action, (2) enhancing salt marsh habitat in the vicinity, (3) elevating the causeway, (4) elevating the causeway and enhancing surrounding marsh habitat, and (5) constructing a bridge.
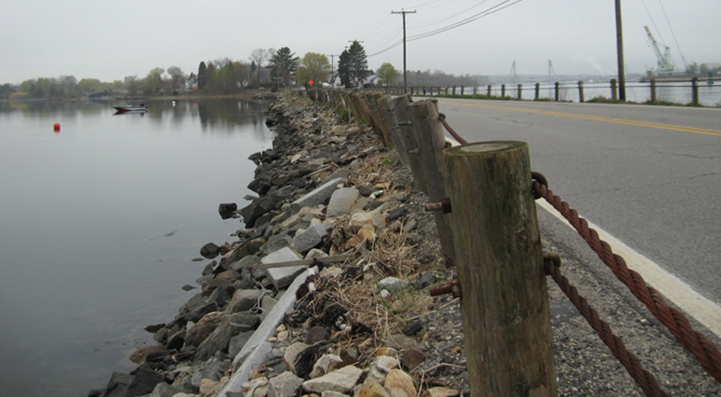
Laguna Shores Road in Corpus Christi, TX, runs parallel to Laguna Madre, a lagoon within the western region of the Gulf of Mexico. Shoreline erosion has undermined the roadway in multiple locations, which has direct negative impacts on project life cycle, maintenance costs, and public safety. These locations are particularly susceptible to the impacts of storm surge and extreme weather events, and this vulnerability will increase in the face of sea level rise. In addition, several locations along Laguna Shores Road are subject to periodic inundation under spring tide and other typical (non-storm) conditions. The City of Corpus Christi is rebuilding three segments of Laguna Shores Road to improve the level of service and reduce susceptibility to erosion and inundation. Reconstruction of the roadway includes increasing the elevation of the roadway surface. A coastal engineer is designing shoreline protection options for the roadway that include natural and engineered materials such as sand fill, marsh plantings, and stone.
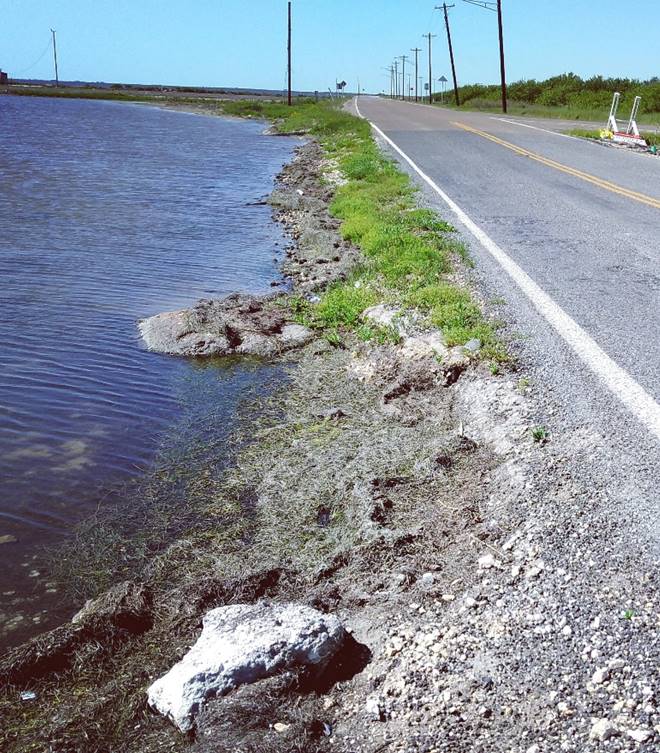
No single nature-based solution addresses all of the vulnerabilities listed in Table 4-4, not independently and certainly not simultaneously. Thus, you should provision resilience accordingly, using the entire suite of management strategies presented in Table 2-1. Policy, structural, and nature-based solutions are appropriate for varying degrees of infrastructure criticality, and for infrastructure sensitivity to flood, wave, or erosion hazards.
Consider the conceptual diagram showing the entire resilience strategy space for coastal highways in Figure 4-8a. This figure shows, schematically, how varying magnitudes of system criticality and system sensitivity combine to suggest an appropriate resilience action or suite of actions. For example, a nature-based solution may be appropriate for a system with moderate sensitivity and moderate criticality; however, if the system is moderately sensitive but highly critical, then an appropriate course of action may involve some combination of nature-based solutions and structural features.
The presence of policy measures at opposite corners of the resilience space is intentional. Systems that are neither critical nor sensitive may not require any direct action for some time. Before action is needed, policy measures could, for example, focus on right-of-way acquisition for future realignment of the roadway. Alternatively, policy measures may be the most pragmatic solution for systems that are both critical and sensitive when other methods do not yield the desired level of resilience. Note that Figure 4-8a is intentionally non-quantitative and overly generalized; it is simply a suggested approach to considering how one balances sensitivity and criticality in the resilience decision-making process.
We can further refine the concept of resilience management strategies by considering the sensitivity of coastal highways to specific hazards: sea level rise, coastal flooding, wave action, and erosion or shoreline retreat (Figure 4-8b–d). Doing so allows us to more objectively define the ranges over which different nature-based solutions are appropriate. In other words, we can better describe the potential distribution of "effectiveness" within the nature-based solution strategy space. Beyond this space, we consider major structural features such as flood barriers, retrofits, or armoring, and/or policy measures such as retreat, abandonment, or advanced flood warnings.
Two reference points are indicated (1 and 2) on each of the hazard figures to serve as descriptive examples for this text. First consider infrastructure sensitivity to flooding in Figure 4-8b. For a project that is not critical but has some moderate sensitivity to flooding (point 1), preservation, conservation, or establishment of a maritime forest may provide appropriate flood-reduction benefits. However, a more critical project with the same sensitivity to flooding may require additional flood protection through establishment of an elevated feature, such as a constructed dune or berm, perhaps in conjunction with a structural feature such as a parapet wall or sheet pile wall. For sensitivity to waves, Figure 4-8c includes two points representing projects with the same level of criticality, but with lower (point 1) and higher (point 2) sensitivities to waves and wave-related damage. While a vegetated feature, such as a coastal marsh may provide the desired level of wave height reduction for the project at point 1, a higher sensitivity to waves may require some form of an offshore reef or breakwater to dissipate additional wave energy for point 2. For sensitivity to erosion or shoreline retreat, Figure 4-8d shows reference points for projects with unique levels of criticality and sensitivity. For low criticality and moderate sensitivity to erosion, a coastal marsh or mangroves may provide the level of stabilization required at point 1. However, increasing both parameters may warrant the establishment or enhancement of a beach and dune system, possibly combined with an appropriate structural element, such as a buried revetment or seawall.
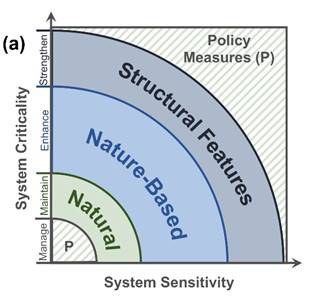
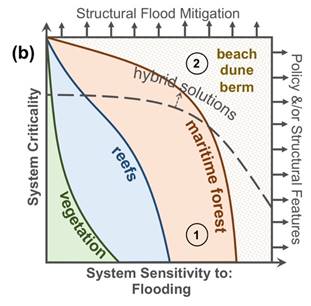
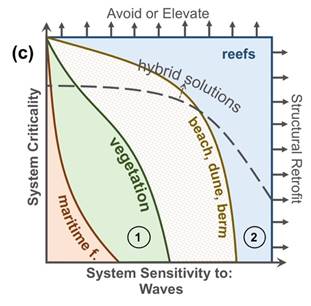
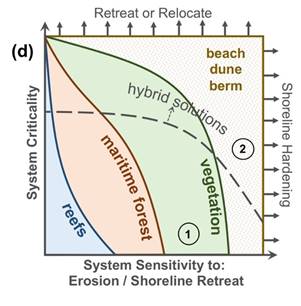
The resilience strategies diagrammed in Figure 4-8b–d are non-quantitative and intentionally stylized. We do not know exactly how the various nature-based features will provision resilience in a way that addresses criticality and sensitivity concerns. However, the information presented in Section 2, and more specifically in Table 2-1, provides reasonable guidance on the performance of various natural and nature-based features at mitigating the vulnerabilities shown in Table 4-4. Each of the schematics shown in Figure 4-8b–d is roughly partitioned by the gray dashed line, above which you should consider hybrid solutions given high system criticality.
The information gathered during site characterization and resilience characterization provide the necessary inputs for identifying potential resilience management strategies. At this point, you should have some conceptual ideas about what strategies are appropriate for your project location and needs. This section builds on that information and generally describes some important concepts for selecting an appropriate nature-based solution. The reader is directed to Appendix B for decision trees that help inform policy, and nature-based/hybrid and/or structural solutions to address flood, wave, and erosion hazards for coastal highways.
The selection process requires an understanding of two major issues: (1) the type of nature-based solution that your site will support (e.g., Is it a beach or a marsh?), and (2) the infrastructure vulnerabilities or risks you seek to mitigate through project implementation. Once you determine the management strategy that best fits your location and needs, consider the various alternatives that maximize benefits, minimize costs, and meet other priorities. Also, be sure to answer these four questions before moving ahead to the full design phase:
Table 4-5 presents coastal hazards (column 1), relevant asset types (column 2), and representative examples of possible management strategies (policy, nature-based, structural, and hybrid) as a function of vulnerability and type of infrastructure (columns 3–6). The vulnerabilities shown in Table 4-5 are slightly refined versions of those shown in Table 4-4. These suggestions are based on what we know about the flood-reduction benefits of nature-based solutions (Section 2), the general types of vulnerabilities listed by infrastructure type in Table 4-4, and the decision-making framework shown in Figure 4-8. Many other options are possible, and those options are unique in almost every region and territory of the United States. We address regional considerations in a subsequent section.
| Issue | Application | Policy | Natural and Nature-Based | Structural | Hybrid (possible examples) |
|---|---|---|---|---|---|
| Increased Flooding because of SLR | Roads Causeways Drainage |
Accommodate Relocate Abandon |
Dunes Berm |
Elevate Bulkhead Seawall Flood Barrier |
Dunes + Bulkhead/Seawall/Barrier Berm + Bulkhead/Seawall/Barrier |
| Storm Flooding | Roads Causeways Bridges Tunnels Drainage |
Accommodate Relocate Abandon |
Beach Dunes Maritime Forest Marsh Mangroves |
Elevate Bulkhead Seawall Flood Barrier |
Beach + Dunes + Seawall/Barrier Marsh/Mangrove + Seawall/Barrier |
| Wave Runup and Overtopping | Roads Causeways Tunnels |
Accommodate Relocate Abandon |
Dunes Marsh Mangroves Reefs |
Elevate Revetment Flood Barrier Breakwaters Sill |
Dunes + Seawall/Barrier Marsh/Mangrove + Revetment Marsh/Mangrove + Sill Marsh/Mangrove + Reef/Breakwater |
| Wave Forces | Bridges Revetments |
Relocate Abandon |
Marsh Mangroves Reefs |
Elevate Breakwaters |
Beach + Dunes + Reef/Breakwater Marsh/Mangrove + Reef/Breakwater |
| Erosion | Roads Causeways Bridges |
Relocate Abandon |
Dunes Marsh Mangroves Reefs |
Revetment Armoring Sill |
Dunes + Vegetation Marsh/Mangrove + Sill Marsh/Mangrove + Revetment |
| Shoreline Retreat | Roads Bridges |
Relocate Abandon |
Beach Marsh Mangroves Reefs |
Bulkhead Seawall Revetment Breakwaters |
Beach + Reef/Breakwater Marsh/Mangrove + Reef/Breakwater Beach + Revetment/Wall Marsh/Mangrove + Revetment/Wall |
There are feasibility considerations and constraints that often need to be addressed and resolved during the planning and design phases. Some of these issues–namely permitting, end effects, and constructability–were identified in Table 4-1 as "Additional Parameters". Additional constraints include easement and right-of-way ownership issues, impacts on submerged lands (permitting issue), habitat tradeoffs, habitat impact offset requirements, liability concerns, and hazards to navigation (when using nearshore or offshore structures). Design professionals can overcome these potential pitfalls, but only when they are considered early in the implementation process.
There are other factors in addition to the site characterization parameters, infrastructure type, and infrastructure resilience needs that affect the selection process. For example, each of the four (or perhaps five) site characterization parameters face unique issues and challenges in various regions and territories of the United States. The variability in project design, project elements, materials, and construction are a function of the regional setting in which they exist, and careful consideration must be given to regional specifics and differences. For example, plant species being considered for restoration purposes may be native to and/or protected in some parts of North America, while being highly invasive species in other States or regions. Table 4-6 describes how States and territories are regionally categorized for this discussion. Some brief comments regarding the viability of nature-based solutions in each region follow Table 4-6.
| Northeast | Mid-Atlantic | Southeast | Great Lakes | Gulf of Mexico | Pacific / Northwest | Pacific / Southwest | Hawaii and Pacific Islands |
|---|---|---|---|---|---|---|---|
| NJ NY CT RI MA NH ME |
VA MD DE |
PR USVI FL Keys FL (East) GA SC NC |
NY PA OH MI MN IN IL WI |
TX LA MS AL FL (West) |
AK WA OR |
CA1 | HI AS FM GU MH MP PW |
1 California is somewhat unique on the Pacific Coast and belongs in its own category, as described below.
The Northeast region has a comparatively short history of using nature-based solutions for coastal resilience (except for beach nourishment). Tideland ownership and policies in some States have historically inhibited encroaching on State-owned water bottoms, making many nature-based solutions difficult to implement. With some exceptions, the wave energies in this region vary from moderate to high because of the long, open ocean coastline and larger sounds and estuaries with considerably long fetches. The tide range varies considerably across the region, as do the shoreline types: ranging from low bank, sandy shorelines to coastal bluffs and rocky cliffs. There is a growing network of design professionals and practitioners in this region, and access to materials and qualified contractors is good. Major vulnerabilities in this region include sea level rise, storm surge, extra-tropical storms (nor'easters), wave action, bluff erosion, ice impacts (frequent), and invasive species. Habitat types include marshes, oyster reefs, maritime forests, beaches, and dunes. More specific information about the use of nature-based solutions in this region is found in Miller et al. (2015), NYSDEC (2017), and Woods Hole Group (2017).
The Mid-Atlantic region has the longest track record when it comes to nature-based solutions. Unlike other regions, this region has more estuarine and sheltered shoreline (i.e., the Chesapeake and Delaware Bays) than it does open coast, high wave energy shoreline (Atlantic Coast). Wave energy exposures for most of the region vary from low to moderate. The tide range is moderate and does not change substantially within the region, and there are comparatively fewer habitat types. Tideland ownership and policies vary considerably between States. Maryland owns land below the MHW tidal datum, including tidal wetlands. Virginia owns land below the MLW datum and tidal wetlands are privately owned. Maryland and Virginia have specific legislative policies that facilitate the use of living shorelines over shoreline armoring (see Section 6 for more information). There is an established network of design professionals and practitioners in this region, and access to materials and qualified contractors is good to excellent. Major vulnerabilities in this region include sea level rise, storm surge, bluff erosion, boat wakes, ice impacts (infrequent), and invasive species. For example, Vitex rotundifolia (beach vitex) is native to Hawaii, but non-native and invasive in Mid-Atlantic States, where it smothers native plants on the coastlines of States, including Virginia. Habitat types include marshes, oyster reefs, maritime forests, beaches, and dunes. More specific information about the use of nature-based solutions in this region is found in PDE (2013), Hardaway et al. (2017), and Schrass and Mehta (2017).
The Southeast region, excluding North Carolina, has a shorter history regarding the formal design and construction of nature-based solutions. Shoreline hardening along the east coast of Florida is very common, except for the open ocean coast. However, North Carolina has a relatively long record of building marshes and low timber sills along estuarine and sheltered shorelines. This region has a very large range of wave energy exposures, a wide distribution of tidal ranges, and multiple habitat types. Tideland ownership and policies vary somewhat from State to State. There is a growing network of design professionals and practitioners in this region, particularly in Florida and North and South Carolina. Major vulnerabilities in this region include sea level rise, storm surge, boat wakes, dense coastal development, and invasive species. Ice negatively impacts the performance of marsh sills and structures in North Carolina but does so infrequently. Habitat types include marshes, mangroves, reefs (oyster and coral), beaches, and dunes. More specific information about the use of nature-based solutions in this region is found in GDNR (2013) and Schiavinato and Kalo (2014).
The Great Lakes region has a shorter track record with formal implementation of nature-based solutions, although shoreline and marsh restoration projects do exist. The wave energies in this region can be extremely high along the primary lake shorelines because of the large fetches. While the lakes do not necessarily experience storm surge, they do experience surge-like events in the form of meteotsunamis and squall line surge events. Shoreline types vary considerably throughout these lakes, including low sandy banks, high coastal bluffs, and freshwater emergent marshes. There is no substantial astronomical tide in the Great Lakes and sea level change does not apply. However, the Great Lakes do experience considerable fluctuations in water levels associated with redistributions of water within the broader hydrologic cycle. Major vulnerabilities in this region include major lake-level fluctuations, extra-tropical storms, wave action, bluff erosion, ice impacts (frequent), and invasive species. For example, many wetlands of the Great Lakes region are experiencing problems with the cattail Typha glauca, which is a hybrid of the native cattail Typha latifolia (native to much of North America), and the introduced cattail Typha angustifolia. Habitat types include freshwater marshes, maritime forests, beaches, and dunes. More specific information about the use of nature-based solutions in this region is found in Lulloff and Keillor (2016) and USACE (2017).
The Gulf of Mexico region has a relatively long record (~20 years) of nature-based solutions built across a wide range of wave energy exposures, habitat types, and permitting options. Tideland ownership and policies vary somewhat from State to State. There is a healthy network of design professionals and practitioners in this region, adequate access to materials and contractors, and a growing body of knowledge to assist in project implementation. Major vulnerabilities in this region include sea level rise, storm surge, dense coastal development, and invasive species. Habitat types include marshes, mangroves (non-native in specific areas of some States), maritime forests, reefs (oyster and coral), beaches, and dunes. More specific information about the use of nature-based solutions in this region is found in GBF (2011), MBNEP (2014), and Bryars (2016).
The Pacific Northwest region has a relatively short track record with formal implementation of nature-based solutions, although some examples exist. The wave energies in this region are extremely high along the open ocean shorelines, and more moderate along the estuarine shorelines of Puget Sound (but by no means mild). Tide ranges are typically large in this region. Tideland ownership and policies vary from State to State. There are fewer coastal design professionals and practitioners in this region. Major vulnerabilities in this region include sea level rise, flooding during "king tide" events, wave runup and overtopping, tsunamis, ice impacts, and invasive species. For example, smooth cordgrass (Spartina alterniflora) is invasive on Pacific Coast mudflats and waterways, while being an important native component of Gulf of Mexico and Atlantic Coast coastal ecology. Habitat types include marshes, beaches (sandy and cobble/shingle), berms, dunes, bluffs, and rocky coasts. More specific information about the use of some nature-based solutions in this region is found in Allan et al. (2005a, 2005b) and Johannessen et al. (2014).
California has a moderate history of formal implementation of nature-based solutions, particularly along sheltered shorelines. The wave energies in this region are extremely high along the open ocean shorelines, and moderate along the estuarine shorelines of San Francisco Bay. Tide ranges are large in this region. There is a large group of coastal design professionals and practitioners in this region. Major vulnerabilities in this region include sea level rise, flooding during "king tide" events, wave runup and overtopping, tsunamis, ice impacts (less frequent), and invasive species. Habitat types include marshes, beaches (mostly sandy), dunes, bluffs, and rocky coasts. More specific information about the use of nature-based solutions in California is found in Newkirk et al. (2018).
The Hawaiian and Pacific Islands region has perhaps one of the most interesting histories with respect to nature-based solutions. Native Hawaiians have historically managed their shorelines and coastal regions using a comprehensive, systems-type approach. Locally, the strategy is known as "ridge to reef" management. This approach is equivalent to watershed management. An example of an old, Hawaiian nature-based solution is the fish pond (Figure 4-9). Fish ponds, some of which are more than 800 years old, are strategies that comprehensively manage fisheries, watershed contributions to the coast, storm surge impacts (relatively minor), and wave-induced shoreline erosion (significant). The porous lava rock used to build the pond wall allows exchange of seawater and freshwater, serves as a sort of broad crested weir during rainfall runoff events, and as a reef and/or breakwater during elevated ocean water level and large wave events. Hawaii and other Pacific Island territories experience relatively minor tide ranges, but all are subject to extreme winter swell wave energy and wave runup along the coast. Storm surge is typically smaller in this region because of the steep nearshore slopes. Wave breaking over reefs contribute to setup along the coast that significantly exceeds that of storm surge. Some islands in this region are more vulnerable to sea level rise than others. Major vulnerabilities in this region include wave runup and overtopping, tsunamis, and invasive species. For example, the mangrove (Rhizophora mangle) is highly invasive in Hawaii and other Pacific Islands (as well as specific areas of some Gulf Coast States) but is native to North America; it is protected in Florida and vital for that State's coastal stability and ecosystem integrity. Habitat types include non-native mangrove forests, extensive coral reef systems, beaches (mostly sandy), dunes, and some rocky/volcanic coasts. More specific information about the use of nature-based solutions in this region is found in DLNR (2013) and USACE (2018).
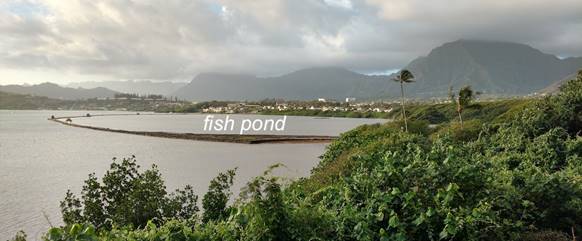
With the site and resilience characterization steps now complete and having selected one or more potential nature-based solutions for evaluation, it is time to design the engineering and ecological elements of your project. After reading this section, you will better understand the design considerations, tools, methods, and strategies for addressing the engineering and ecological needs of your nature-based solution. Design examples of existing and proposed nature-based solutions appear at the end of this section.
There is no "one size fits all" and no two sites are ever the same. Therefore, it is imperative that you rely on the appropriate professional expertise and experience when it comes to project design. To that end, the assembled team of professionals must have someone who is knowledgeable about planning, designing, and implementing nature-based solutions. Successful nature-based solutions also benefit from a wide variety of technical expertise throughout implementation, including, at a minimum, transportation professionals, coastal engineers, and coastal scientists. Figure 5-1 briefly describes the elements of a successful nature-based solution and, ideally, how the different professionals should interact: at the intersection of all three circles!
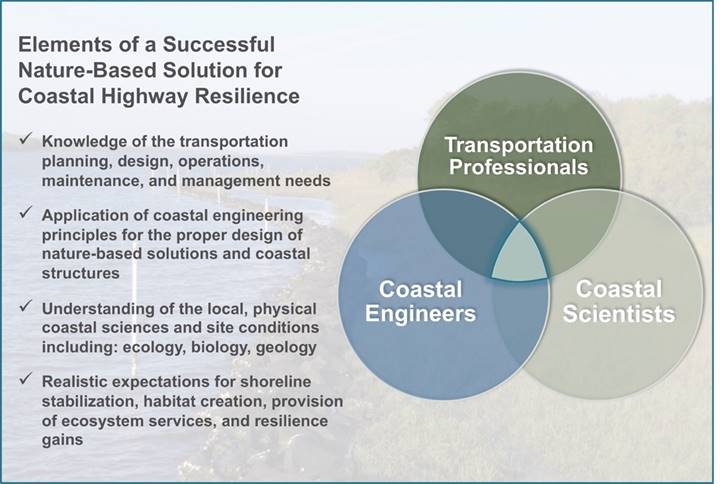
Implementing nature-based solutions for coastal highway resilience requires active participation and involvement from the spectrum of transportation professionals: planners, ecologists, environmental scientists, pre-construction engineers, design engineers, maintenance engineers, financial experts, and regulatory compliance staff. This is likely the broadest set of expertise required among the three groups and for good reason. Transportation projects are complex and an appropriate assessment of the project life cycle and how nature-based solutions will address broader transportation system needs is critical to success. In short, transportation professionals identify system needs, preferences, and project constraints. They convey that information to the nature-based solution design team, which consists of practitioners of coastal engineering and coastal sciences, including ecology, biology, geology, and perhaps oceanography. The coastal team then develops a nature-based solution, or a suite of alternatives, that meet the transportation requirements and are technically feasible, reasonable, justifiable, permittable, and constructible.
Before designing your nature-based solution, consider addressing issues and/or making improvements to the upland and/or surrounding areas. In some cases, erosion issues are resolved by (1) implementing appropriate stormwater best management practices on the upland, (2) managing the coastal or riparian buffer, and (3) regrading overly steep banks. Addressing these three issues also plays an important role in the function and performance of your nature-based solution.
Basic stormwater management best management practices (BMPs) play an important role in the success and performance of nature-based solutions. Unmanaged stormwater runoff will erode the upland and intertidal slopes and possibly uproot emergent vegetation as runoff flows to the shoreline. In addition to the volume and rate of overland flow, stormwater runoff contains nitrogen and phosphorous, as well as heavy metals, chemicals, and bacteria that attach to sediment particles as they are transported to the coastal environment. Application of traditional stormwater BMPs on the upland and/or transportation infrastructure will reduce or eliminate many of these issues (USEPA 2015a). Transportation agencies should consider whether their own stormwater BMPs accommodate nature-based solutions and, if not, modify them appropriately as part of the construction process.
Management of the coastal (riparian) buffer refers to maintaining, enhancing, or restoring the coverage, density, and composition of vegetation (e.g., ground cover, shrubs, understory, trees) found on the face of the bank and near the top of the bank or bluff. Like smaller versions of maritime forests, the coastal buffer reduces coastal flooding and wave action, stabilizes banks and slopes, and reduces the rate of stormwater runoff. Effective buffers extend approximately 100 feet landward from the top of the bank. This target width of 100 feet is not always practical for some transportation settings with narrow easements. However, conservation and maintenance of existing coastal buffers benefit transportation resilience and improve the performance of nature-based solutions along the shoreline. Effective buffer management requires a plan and dedicated funding to perform routine maintenance, particularly when large trees shade the shoreline and limit sunlight exposure to emergent intertidal marsh or beach plants.
Bank grading is used to stabilize steep or eroding upland slopes. Grading the bank reduces erosion from upland stormwater runoff and promotes wave runup on the slope as opposed to undercutting at the toe of the bank or bluff. Bank grading also provides space for the shoreline to migrate in response to sea level rise. Limit bank grading only to areas experiencing erosion, making sure not to disturb stable soil and vegetation, or create a hazard for adjacent properties. Bank grading should attain a slope of 3:1 (H:V) or flatter. Constraints on bank grading include feasibility, space, and accessibility to the bank and shoreline. In some cases, good material excavated from the bank can be used to increase planform elevation and/or width to create or enhance the natural feature. It is more common to dispose of that material on the upland or in some other location, but remember that the eroding bank or bluff is most often the primary source of material for the shoreline at its base. Continually removing that material from the bank effectively cuts off the shoreline from at least one of its long-term sediment supplies. A more effective strategy for managing that excavated material is to place it directly on the shoreline below (if the sediment is compatible and appropriate permits are obtained).
After completing the site characterization (Sections 4.1 and 4.2) and determining the primary materials and techniques you will use based on that characterization (Section 4.3), the next stage is to advance your conceptual design to a draft design. While transportation agencies will likely hire a coastal engineer for this step, it is still important for the transportation practitioner to understand the steps and considerations in order to properly oversee the work.
The design team must determine the placement, size, and combinations of materials based on desired risk reduction and ecological performance. Below we describe some design considerations for these particular materials and techniques:
Marsh sills are relatively small structures, often trapezoidal in cross-section, placed seaward (channelward) of a shoreline for the purposes of stabilizing newly placed fill and attenuating wave energy (Figure 5-2). Materials used in the construction of marsh sills range from stone (riprap) to bagged oyster shells and manufactured (concrete or other structural material) habitat devices. Fill is added landward of the marsh sill to establish appropriate nearshore and shoreline slopes. For intertidal marsh habitat, an appropriate target design slope from the sill to the upland is 10:1 (H:V), although steeper slopes may be adequate in some cases. If that value does not seem to be correct for your region, perform an elevation survey of a nearby, healthy intertidal marsh and mimic that value in your project.
The design of the structure depends on wave energy exposure. If you are constructing a marsh where fetch is less than 1 mile, a sill will be sufficient. However, if fetch is less than about 15 miles, nearshore segmented breakwaters would be more appropriate. If the fetch is significantly larger than 15 miles, the size and cost of the necessary structure may become undesirable (this is not uniformly true and must be evaluated on a case-by-case basis).

The marsh sill design requires determination of an appropriate stone weight, crest elevation and width, side slopes, structure length, the size of gaps (if used), and the appropriate geotextile or filter fabric on which to build the structure. You can use Hudson's equation, described in FHWA (2008), to size armor stone for marsh sills. A simple approximation of Hudson's equation for quarried granite stone (specific weight = 165 lbf/ ft3) is:
W50 = (16.7 x H3) / cot (θ), (Eq. 1)
where H is the design wave height, and cot (θ) is the side slope of your structure such that a side slope (H:V) of 2:1 is equal to cot (θ) = 2.0.
Side slopes of 1.5:1 have been used at sites with very low fetches and/or on the landward-facing slopes, where appropriate. Unless the marsh sill is located adjacent to deep water (unlikely), the design wave height will likely be a depth-limited wave height equivalent to 80 percent of the design water depth condition. An example appears in the text box below.
In addition, a marsh toe revetment can be used to protect an eroding marsh shoreline (i.e., when the addition of fill is not necessary to establish a new marsh). The marsh toe revetment should be placed slightly seaward (channelward) of the MLW tidal datum, and no stone should be placed directly on the marsh edge or marsh surface. The crest elevation of a marsh toe revetment is typically at the MHW tidal datum for low wave energy settings (fetch < 1 mile), and about 1 foot above MHW for moderate wave energy settings (1 mile < fetch < 5 miles). These are simply suggestions and the appropriate toe and crest elevations for a marsh toe revetment may vary on a case-by-case basis.
A vertical sill, made of timber or sheet pile, is designed to stabilize sediments and attenuate wave energy (Figure 5-3). Vertical sills are often deployed within 10 to 30 feet of the marsh edge and/or in relatively shallow water depths (~3 to 4 feet or less). North Carolina frequently uses vertical sills for marsh shoreline stabilization. Unlike marsh sills and marsh toe revetments that affect a substantial portion of the benthic habitat, vertical sills have much smaller footprints on the seabed and, therefore, fewer (but measurable) benthic impacts.
Design considerations for vertical sills include wave loads, soil-bearing capacity, wave transmission past the structure, ice uplift, and constructability. As flat-faced, rigid structures, vertical sills are vulnerable to wave loads that lead to overturning in poor soil conditions. The Coastal Engineering Manual provides many formulas for estimating wave loads on vertical walls (USACE 2002). Ice formation on timber is known to cause uplift forces on vertical sills as the tide rises.
Wave transmission past a vertical sill is a function of structure porosity. For timber structures, porosity is related to the size of and spacing between vertical boards. The equation for porosity is the gap distance divided by the center-to-center timber spacing. For example, a sill using 2 inch by 6 inch vertical boards and 1-inch gaps has a porosity of 14 percent (e.g., 1 inch / [3 inches + 1 inch + 3 inches] = 1 / 7). Gaps smaller than 1-inch fill with marine growth over time. Timber sills with porosities of less than 15 percent reduce wave height by more than 50 percent. A porosity of 20 percent will only reduce wave heights by 20 percent to 30 percent. Smith and Kriebel (2004) provide additional guidance on porosity calculations and designs. Figure 5-4 shows a typical timber sill design. Some vertical sills use vinyl sheet pile, which has zero porosity, but may still allow wave transmission via wave overtopping during high tide.
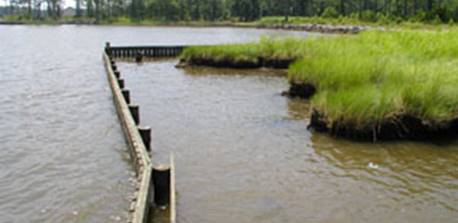
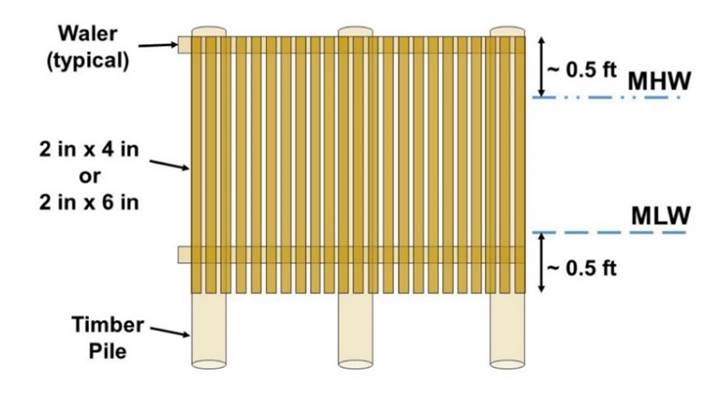
Breakwaters are used to "break" or reduce wave heights through multiple wave transformation processes: reflection, dissipation, and diffraction. Breakwaters reduce wave heights and redirect waves, thus modifying the position and shape of nearby shorelines.
Breakwaters are used in many different settings and are deployed in many different configurations. There are floating breakwaters, timber breakwaters, stone breakwaters, concrete breakwaters, and many other types. Some are placed some distance offshore, and typically parallel to it, segmented with gaps to facilitate water circulation, habitat ingress/egress, recreation, and other hydrodynamic processes. Others are placed directly on the shore, or very close to it, to establish permanent connectivity between the shore and the structure. The literature refers to these types of breakwaters as headlands, headland structures, and headland breakwaters (Figure 5-5).
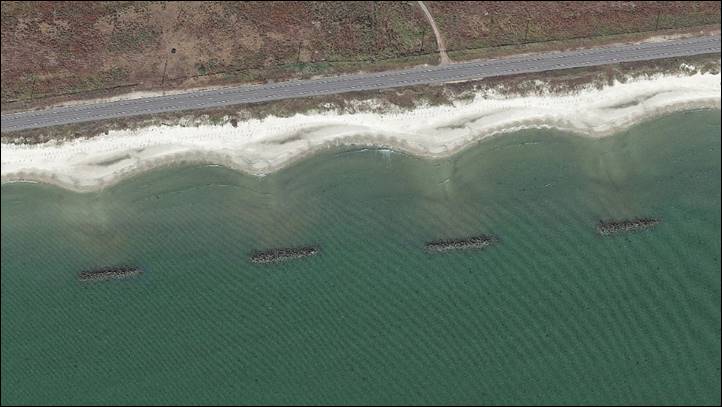
For the purposes of this guide, we limit the discussion of breakwaters to relatively small breakwaters constructed from stone–so-called rubble mound structures. Hudson's equation, discussed in an earlier textbox, provides reasonable estimates of median armor stone weight for small to moderately sized breakwaters. In nature-based solutions, breakwaters are often combined with constructed marshes or sandy shorelines to create an irregular, but stable, shoreline position. The bending, or diffraction, of waves around the ends of breakwaters and through breakwater gaps leads to the formation of stable, crenulate-shaped pockets (Hardaway and Gunn 2002). The geometry of these pockets, or "pocket beaches," is somewhat predictable in the case of sandy shorelines. The formation of pocket beaches mimics the naturally occurring beaches that form in between rocky headlands or outcrops in the Northeast and Pacific Northwest.
In the literature, there are numerous empirical methods for estimating the pocket geometry based on the gap width between breakwaters, the dominant wave direction(s), the tide range, and the expected storm tide. For example, Hardaway and Gunn (2011) summarize some of the most commonly used methods; Bodge (2003) presents a comprehensive multi-step process for designing pocket beaches; and Rosati (1990) gives a comprehensive overview of functional shoreline structure design. As shown in Figure 5-6, the relationship that most determines the geometry of the pocket is the gap width between adjacent breakwaters. The relationship between the gap width and pocket indentation varies based on the wave energy exposure and coastal setting. Hardaway et al. (2017) report an average value for Chesapeake Bay as Mb:Gb = 1:1.65. On some coasts, this ratio can increase to Mb:Gb = 1:3 (Hardaway and Gunn 2011). The pocket shape establishes its equilibrium position as a function of both the average annual and storm wave conditions, as described schematically in Figure 5-7.
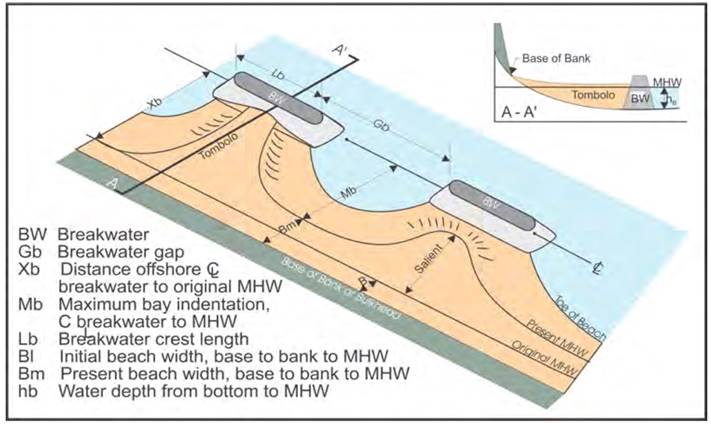
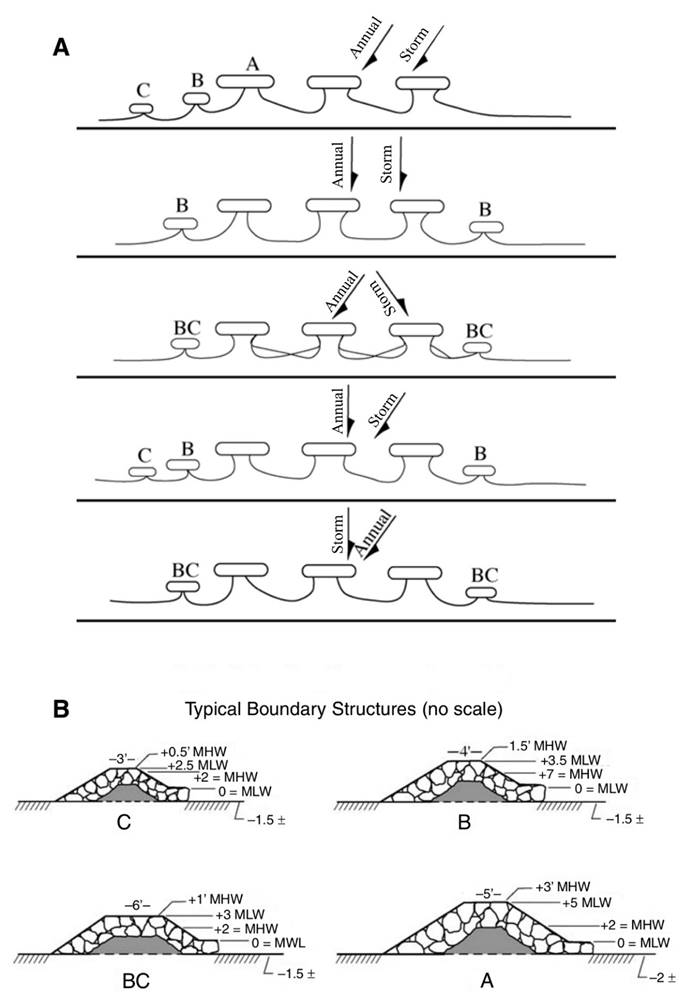
The appropriate use of vegetation in a nature-based solution depends on specific site factors, including the following:
The species of vegetation will vary by region of the United States and are targeted for a given level of inundation, salt-tolerance, and desired vegetation community/habitat type, including submerged aquatic vegetation (SAV), emergent vegetation (e.g., marshes), riparian, and upland terrestrial species. Figure 5-8 is one such example for vegetation in Gulf Coast marshes.
In addition to establishing appropriate elevations and required levels of wave attenuation, there are other considerations to address in the project design. Some of these considerations include establishing the appropriate slope, planting density, availability and use of donor plants, and protection from foraging. Intertidal marsh vegetation often prefers mild slopes of 10:1 (H:V). The track record of marshes planted on substantially milder or steeper slopes is poor. Furthermore, many practitioners recommend waiting at least 1 to 3 weeks to plant following the placement of fill. The newly placed fill will equilibrate to the site-specific hydrodynamic conditions during that waiting period.
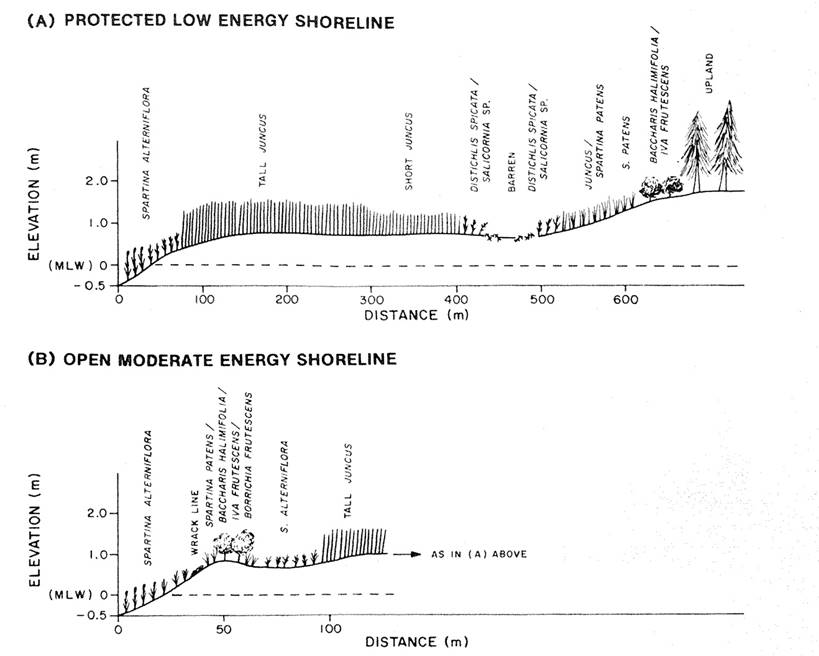
Planting strategies are often designed to achieve a certain initial coverage. For example, plants are often installed with 1-foot, 1.5-foot, or 2-foot center spacing (plant-to-plant). Some anecdotal evidence suggests that plant clustering yields more desirable benefits than plant spacing (FHWA 2018b). Similarly, mixing plants excavated from a donor marsh near the project site with nursery plants is known to contribute to success (Sharma et al. 2016). The use of a donor marsh, however, requires approval from State and Federal regulatory agencies and cannot always be guaranteed. Often overlooked in nature-based design, newly planted vegetation is a desirable food source for birds and marine mammals. Some project designs incorporate nets, cages, or fencing that attempt to prevent or limit foraging early in the plant's development. Maintenance of vegetation is critical for the success of nature-based solutions and may include invasive/exotic plant and animal species removal, replanting of vegetation when needed, trimming of vegetation, and removing debris.
The existence and health of emergent saltwater marshes is regulated by a variety of factors, including sediment type and supply, elevation, nutrient levels, and wave conditions. A study by Roland and Douglass (2005) quantifies the wave tolerance of Spartina alterniflora in southern Alabama, and that guidance has been used in the design of several successful marsh creation projects. The presence of marsh vegetation is shown as a function of both significant wave height and frequency of occurrence in Figure 5-9. Roland and Douglass (2005) determined that the upper limit for non-eroding salt marsh is a median significant wave height of 0.1 meter (0.33 foot) and a corresponding 80th percentile significant wave height of 0.2 meter (0.66 foot). In other words, marsh vegetation is stable when significant wave heights are less than 0.2 meter (0.66 foot) 80 percent of the time and less than 0.3 meter (1 foot) 95 percent of the time.
The Roland and Douglass (2005) findings are generally consistent with a "rule of thumb" that marsh grasses exist where maximum storm wave heights are less than 1 foot. These values serve as practical engineering guidance on the wave tolerance of typical marsh vegetation to incident waves. Sills or breakwaters provide the necessary attenuation of wave energy when incident wave heights are greater than these limits. The hatched area between the two regions in Figure 5-9 reflects locations with eroding and marginal marsh vegetation.
The use of geotextile fabrics or geotextile grids is common in the design of nature-based solutions. Figure 5-10 shows contractors stretching, aligning, and placing geotextile fabric to serve as the base for construction of an offshore rock breakwater. Geotextile materials are most often used to prevent or reduce the loss of sediments behind or under a structure, provide additional bearing capacity in poor soil conditions, or serve as a sand-retaining structure (e.g., geotube). The use of hybrid geotextiles that better accommodate vegetation is becoming more commonplace.
The selection of an appropriate geotextile material depends on sediment size and gradation, existing and required soil-bearing capacities, and exposure to sunlight. Many geotextile materials are vulnerable to ultraviolet (UV) degradation and must remain buried to avoid direct sunlight exposure. Material manufacturers are developing new products that are less sensitive to UV degradation and the appropriate geotextile should be selected for a given application.
In some settings, placement of a suitable geotextile fabric is impractical or even impossible (e.g., an area with strong currents). Substituting the geotextile fabric for a suitable underlayer that provides the necessary foundation strength and filtering requirements is allowable. In fact, it is not uncommon for contractors to use a layer of bedding stone to hold the geotextile in place.
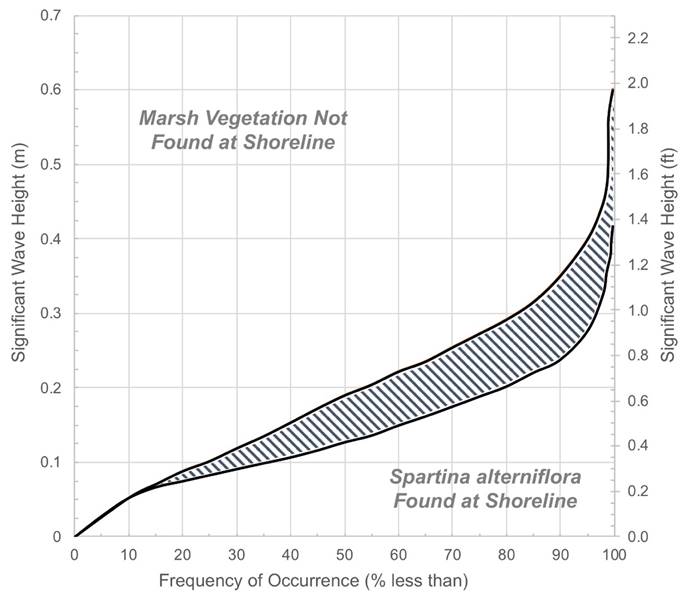
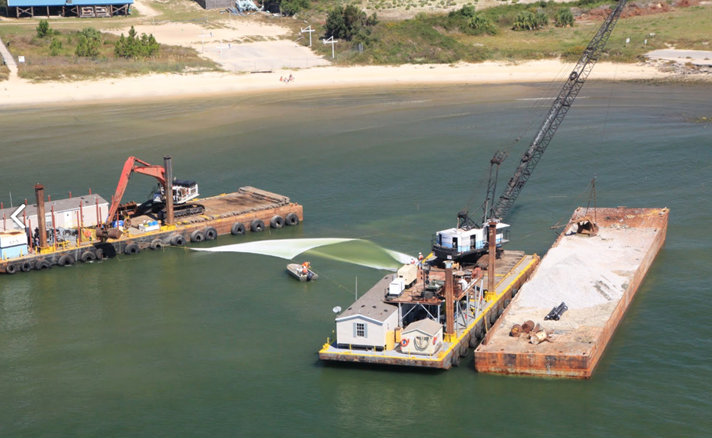
Alternatives to traditional breakwater materials and traditional coastal structures are growing in practice. These materials are presented as alternatives that provide performance, habitat value, or an ecosystem service that is (or claims to be) superior to traditional materials and structures. For example, the use of artificial reef units as "living breakwaters" is becoming more common (Allen and Webb 2011; Webb and Allen 2015), even in lieu of accepted performance criteria and design standards. In some cases, Federal agencies, such as USACE, are facilitating the consideration of non-rock alternatives through performance-based design criteria that address, among other things, stability under wave attack, wave attenuation, constructability, durability, and cost.
Dunes serve two critical functions during storm events: (1) they delay and reduce coastal flooding, and (2) minimize the duration and intensity of wave action and wave-induced flooding. Figure 5-11 shows an artificial sand dune constructed seaward of a coast-parallel highway to protect the road from flooding and damage. Dune erosion during a major storm removes all wave protection afforded by a small dune. Two important characteristics of dunes are their volume above stormwater levels and the elevation of their crest. Hallermeier and Rhodes (1989) provide an equation relating dune erosion to storm return period for specifying minimum dune volume densities. This equation generally describes the dune volume required to protect against a storm having a T-year return period:
V = 86.1T 0.4, (Eq. 2)
where V is dune volume above the still water level in cubic feet per foot of shoreline, and T is the storm return period in years. The equation continues to be used despite considerable uncertainty in the formula.
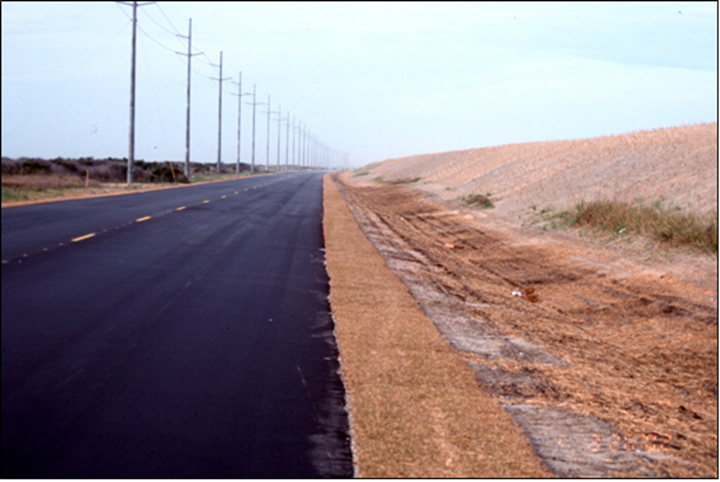
No engineering tools specifically account for the positive effects of vegetation on dune performance. However, in most published studies, dune vegetation substantially decreases dune erosion and retreat rates (Figlus et al. 2014), and is effective at reducing wave runup, overtopping, and overwashing (Gralher et al. 2012; Kim et al. 2016; Kobayashi et al. 2013; Silva et al. 2016). USACE is supporting enhanced research in this area to better understand and quantify the role of vegetation in dune resilience (Bryant et al. 2018).
Beach nourishment is protecting many coastal highways in the United States. Beach nourishment is the direct placement of clean, compatible sand on the beach to widen the beach and advance the shoreline seaward (Dean 2003). Beach-quality sand fill is used for (re)establishing the preferred shoreline and/or upland slope and required grade elevation. For example, a constructed intertidal marsh will often require the use of sand fill to establish appropriate slopes and elevations for the marsh vegetation. On sandy shorelines of considerable width, sand fill is added to create or restore dune features or amend the shoreline berm elevation and location.
Beach nourishment (with or without dunes) is an appropriate shoreline management strategy along gently sloping sandy shorelines and in areas where the hydrodynamic parameters, including nearshore sediment transport, support a sandy beach (Figure 5-12). Beach nourishment is typically a preferred management strategy for facilitating shoreline recreation, and it is an effective strategy for mitigating risks to coastal highways vulnerable to shoreline retreat.
The performance of beach nourishment projects depends on the background erosion rate, storm frequency and intensity, characteristics of the fill or nourishment material, project design, and the use of coastal structures. See Dean (2003) for a comprehensive guide to the theory and practice of beach nourishment.
The background erosion rate and storm-induced beach erosion factor into the design beach width and design beach volume in order to meet performance requirements. Beach nourishment projects consider two volumes of fill: the design beach volume and the advance mitigation volume. The design beach volume and width are the desired, minimum targets for maintaining a healthy beach system. The advance mitigation volume is provided to allow initial beach profile equilibration, accounting for expected storm impacts and factoring in the background erosion rate. These factors are considered over a specified period in order to determine the beach renourishment interval required to maintain the design beach width. A very simple example of the calculation for a beach nourishment project without structures is given in a text box on the following page.
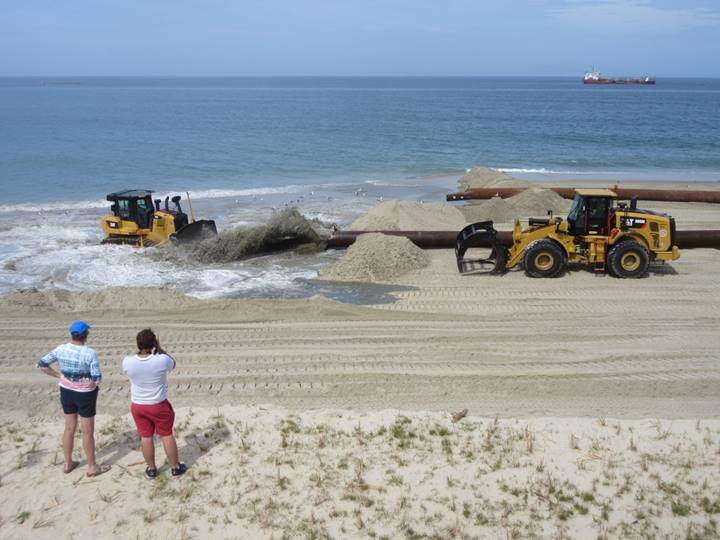
The half-life of a beach nourishment project–the time at which 50 percent of the beach nourishment volume remains–is directly proportional to the length of the project squared. In other words, a 2,000-foot-long project has a half-life that is four times longer than a 1,000-foot-long project. The use of coastal structures such as breakwaters and groins considerably extends the life of small beach nourishment projects (NRC 1995). Theoretically, these projects have an indefinite half-life since very little of the material ever leaves the project site.
The performance of beaches and dunes is very sensitive to sediment characteristics. Sediment from borrow sources must match the native sediment characteristics as closely as possible. The three characteristics that drive physical performance include median sediment diameter (d50), sediment gradation, and percentage of fines. Using sediment that is smaller than the native material will lead to less emergent dry beach or require larger volumes of sediment to meet the design requirements. Using material that is slightly larger than the native grain size is often preferred over a smaller grain size; however, material that is too large will produce a beach slope that is out of equilibrium with the wave conditions. In terms of gradation, a suitable borrow source consists of well-sorted (poorly graded) material with a very low percentage of fines (e.g., < 1 or 2 percent). Sediment texture, as well as its mineral content, also is important, but it is less of a performance concern. Sediment color can be an important factor for aesthetic reasons; it is standardized based on the Munsell color system.
Finding suitable sediments that are compatible with the project beach, in large enough volumes for your project needs, may be challenging. The most suitable material is found near the project site, often in the offshore areas. However, nearshore dredging of seabed sediments for beach nourishment is often prohibited. Viable sediment sources include upland quarries, bank or bluff materials, beneficial use of dredge material, and dredging offshore borrow areas. The design engineer must consider the total cost of finding suitable sand, evaluate its characteristics, assess the feasibility of transporting it to your site, and plan for future renourishment events prior to selecting the material source. For example, offshore borrow areas may contain relatively inexpensive sand (e.g., $8/cubic yard) compared to upland quarries (e.g., $12/cubic yard); however, mobilizing a hydraulic dredge may cost $1 million or more. In this example, you would break even at 250,000 cubic yards of sand.
For some nature-based designs, the sizing and estimates for the level of protection can be made based on the formulas and techniques described in Section 5.3. This is the case for marsh sills and toe revetments, breakwaters, dunes, and beach nourishment.
For other designs, especially those incorporating larger landscape features, there may be value in hydrodynamic modeling or other analyses to estimate the level of protection, or equivalent risk reduction, offered by the nature-based solution(s).
While hydrodynamic modeling can incorporate larger landscape features well, such as barrier islands, large expanses of wetlands, and larger topographic features, more specialized hydrodynamic modeling is needed to resolve smaller features, such as a narrow band of constructed marsh or a breakwater. Such an example is provided in Hayward et al. (2018), who used a combination of three sophisticated hydrodynamic models to evaluate the erosion-reduction benefits of nature-based solutions along the coast of Rhode Island.
This leaves us with the category of features for which we do not have detailed engineering guidance and which are too small to be modeled well without highly specialized tools. The main nature-based features falling in this category are those relying heavily on vegetation, such as constructed marshes, mangroves, and reefs. For these features, we have general estimates from the research literature on wave, erosion, and flood attenuation. Under these circumstances, we use empirical methods that are available in the literature to develop estimates for the risk mitigation potential of our design, while exercising caution not to overpromise given the greater uncertainties.
The FHWA document, A Primer on Modeling in the Coastal Environment, introduces transportation engineering professionals to coastal hydrodynamic modeling and can serve as a useful reference (FHWA 2017).
A vulnerability assessment for a coastal bridge in Mississippi provides an example of how hydrodynamic modeling may be useful in identifying appropriate nature-based solutions. As part of an FHWA pilot, analysts used a suite of three hydrodynamic models (ADCIRC, SWAN, and XBeach) to simulate the water levels, velocities, and waves during Hurricane Katrina. The model grids are shown in Figure 5-13. In FHWA (2018a), the results of this modeling exercise showed that a bridge abutment and low-elevation approach spans were vulnerable to damage from strong flows during extreme events. Those results led the research team to develop conceptual designs for vegetated berms running parallel to the lowest bridge spans. The purpose of the berms was to displace, or shift, the strong currents to higher elevation portions of the bridge alignment. The research team also used these modeling results to determine that this displacement of flows would not lead to damage elsewhere.
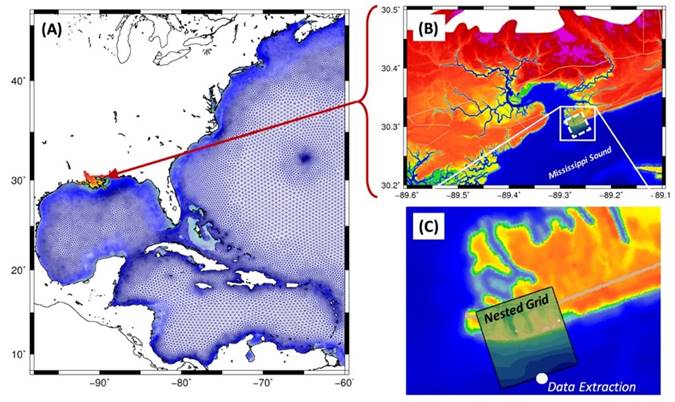
As another example, after developing conceptual designs for nature-based solutions to protect segments of U.S. 101, Oregon DOT partnered with another State agency, the Oregon Department of Geology and Mineral Industries, to perform wave runup analysis for each of their three project sites to gauge the effectiveness of the designs. The analyst extracted data for the 10-, 25-, 50-, and 100-year extreme total water levels (combined wave runup and tides) using the methodology found in the Coastal Flood Hazard Study for Lincoln County, OR (Allan et al. 2015). The analysis incorporated a projected sea level rise of 19 inches for the 2050 high range scenario. The analysis showed that for one of the three sites, Ona Beach, the nature-based design provided the desired level of protection. For another site, Beverly Beach, the hydrodynamic analysis showed that the design provided insufficient protection and that substantially larger amounts of materials and space would be needed. For the third site, Lost Beach, the analysis showed that the design did not provide the desired level of protection; however, only a slight increase in elevation of the cobble beach and artificial dune would be needed to meet the desired level (ODOT 2017). This project is highlighted as a design example in Section 5.7.
Section 2 described the benefits of nature-based solutions and what they can provide in the way of flood, wave, and erosion mitigation. Most of the methods used to describe those benefits are based on empirical measurements and observations from the field and/or laboratory. They can be used, with or without hydrodynamic modeling, to estimate the risk reduction they provide. If we understand the magnitude of a hazard value generated by a specific storm event (e.g., a 10-year return period storm water level or wave height), then we can reasonably predict how much the nature-based solution will reduce it using the empirical methods. Comparing the reduced value to the hazard magnitude associated with storms of lower (or higher) return periods allows us to evaluate the level of protection the solutions offer. This assumes that the nature-based solution is resilient to the storm event and survives. As such, we should analyze the literature and use practical experience to determine what type of events the vegetation is capable of surviving. For instance, marsh vegetation is more likely to survive during events where storm surge has submerged the marsh and wave forces are not affecting the vegetation than when wave forces are affecting the vegetation directly.
The potential for nature-based solutions to reduce an event return period is illustrated in Figure 5-14. In this example, we show a series of return period wave heights for a specific location ("Without NBS" curve). Assuming that we want to know the level of protection and risk reduction provided by a coastal marsh, we use Anderson et al. (2013) to find that the constructed marsh will reduce wave heights by 30 percent ("With NBS" curve). In this case, the marsh (Arrow A) reduces the 5-year return period wave height to that of a (Arrow B) 2-year return period wave height for the design. In other words, the marsh reduces the design wave height. In terms of risk reduction, what is currently a 5-year return period wave height without the marsh shifts to (Arrow C) a 60-year return period event value with the marsh. Assuming a 30-year expected life of the marsh, implementation of the marsh reduces your risk of experiencing the "Without NBS" wave height from 79 percent to 39 percent.
The procedure used to develop Figure 5-14 is completely transferable to other nature-based solutions and other hazard types. You need two pieces of information to complete this type of assessment. First, you need to know the design hazard value without the nature-based solution. This is likely the hazard value under existing site conditions. You do not necessarily need to know how the hazard value changes with the return period. Second, you need a tool, method, or equation that describes how the selected nature-based solution will modify the hazard magnitude. This might be a reduction in flood depth, a decrease in wave height, or a decrease in the rate of shoreline erosion. Use the characteristics of your project (e.g., width, length, height, type), along with the appropriate tool, method, or equation, in order to determine its impact on the selected hazard. Compare your "without NBS" and "with NBS" hazard values to determine the additional resilience provided by your nature-based solution. Consider whether that change might allow you to modify or improve some other portion of your project design, such as reducing the size of riprap in a revetment.
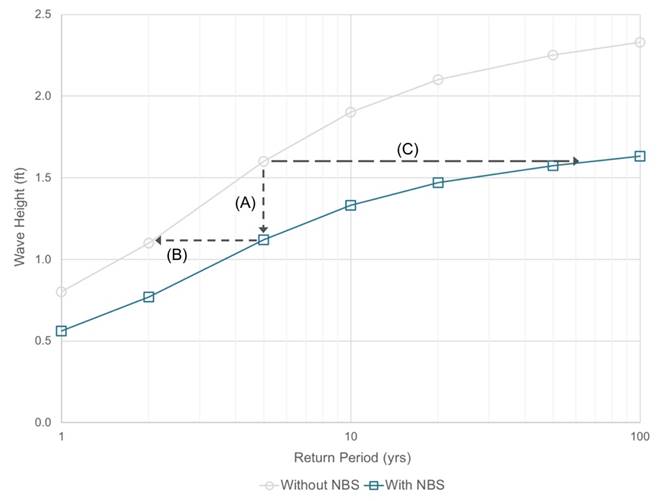
This section discusses some considerations regarding the ecological design of nature-based solutions as it is important to understand how the design components being considered will affect the local ecosystem and to understand what ecosystem services the design features may provide. The text relies heavily on several published guidance documents on living shorelines. Nature-based solutions may provide important habitat for economically and ecologically important species, including fish, shellfish, marine plants, invertebrates, reptiles, amphibians, and birds. They also may improve or restore the vegetative diversity of local habitats, may reduce surface water runoff or erosion problems to the benefit of humans and habitats, and may improve water quality through groundwater filtration.
General categories of areas to consider ecologically during project design include the following:
An assessment of the vegetation communities and habitats present onsite and that are appropriate for preservation, enhancement, or installation is important for project design. In some cases, certain habitat elements may need to be removed or reduced; for example, excessive large woody vegetation can shade out vulnerable marsh vegetation, and may need to be trimmed or removed in order to allow successful growth of the desired habitat type and the achievement of project implementation goals. Various shoreline and upland habitats provide a variety of ecosystem services, including nesting, spawning, nursery, foraging, and shelter habitat for a wide range of plants and animals in addition to providing the means for the shoreline to absorb wave energy and reduce coastal flooding.
The intertidal marsh zone provides various ecosystem services benefits and supports ecologically, recreationally, and commercially important invertebrate, shellfish, and finfish fisheries, such as white and brown shrimp, crabs, oysters, red drum, and spotted sea trout. Some habitats may be considered to be sensitive by regulatory entities. Therefore, measures for avoiding or minimizing impacts may be required in certain areas in order to protect ecologically valuable aquatic habitat, including, for example, submerged aquatic vegetation beds; coral reefs, shellfish beds, and oyster reefs; tidal wetlands dominated by native species; or habitat used by federally threatened or endangered species.
In addition to establishing native vegetation communities and establishing native living structures, including corals and oyster reefs, ecological design considerations should also consider the need for integrating hard structure features such as functional wildlife and fish habitat. Examples include adding fish habitat enhancement structures to bulkheads, incorporating openings in hard structural components (excluding bulkheads and seawalls) to allow aquatic organisms access to nearshore and shoreline habitat (e.g., fish and turtles for upland nesting), and incorporating oyster or clam shell bags or marine-safe concrete that encourages shellfish attachment.
The condition of existing habitats within a project area can provide information regarding the potential success of a nature-based approach; for example, the presence of a healthy marsh habitat with dense vegetation may be a suitable site for a desired management approach, whereas a less dense marsh or hardscape-converted habitat near a healthy marsh may be enhanced with removal of hardscape, and with vegetation installation, trimming, and removal of debris and non-native invasive species. Soil assessments are important also, as some soils, for example, are not appropriate for particular vegetation communities or may not be able to support the weight of structural components, such as marsh sills, and the settling of the soils beneath the structures sometimes destroy structures or reduce their effectiveness.
A nature-based project can have positive and negative effects on nearby habitats and species, both during construction activities and following project completion, and the condition and components of adjacent properties may, in turn, affect the suitability of living shoreline approaches. Careful consideration of the adjacent properties and how they will interact with the project components is critical for project success. For example, the presence of a nearby healthy marsh may indicate that the project site has suitability for marsh creation or restoration, and the installation of marsh within the project would increase the extent of the overall marsh acreage and therefore the extent of coastal protection, and increase habitat and potentially improve habitat connectivity to nearby habitats; whereas the presence of nearby human-made coastal stabilization structures may limit the effectiveness of a nature-based project or necessitate engineering that incorporates those nearby structures appropriately into the design. It is important to maintain connectivity between habitats for species to successfully complete their life cycles and to maintain population levels, and this includes maintaining links between aquatic and upland habitats; maintaining connectivity, in some cases, may involve culverts or overpasses to ensure adequate and safe movement of species between fragmented habitat patches or bodies of water.
Nature-based designs should consider multiple vegetation community types and multiple habitat elements to maximize plant and animal species diversity and to maximize the functional value of the components. Watersheds naturally transition from freshwater to saltwater environments, and support a variety of wetland ecosystems, including scrub-shrub wetlands, forested wetlands, fresh wetlands, swamps, marshes, and non-fresh or saltwater emergent wetlands, as they transition to uplands; each of these communities supports unique and overlapping species that depend on their resources for their livelihoods. A multitude of invertebrates, reptiles and amphibians, finfish and shellfish, turtles and tortoises, birds, and mammals utilize one or more of these habitats permanently or seasonally, or during migration. In many cases, the health of a vegetation community can be at least partially assessed by surveying the wildlife species that are present within the habitat. As discussed in earlier sections, the ability of native plant species to become established or to persist depends on multiple factors. Marsh plant species, for example, are highly dependent on salinity, which results in distinct zones of plant species based on elevation and the resultant flooding of saltwater. Oysters are a species often used in nature-based designs because oyster reefs can provide the same erosion control as rock sills; however, they offer the additional ecosystem benefits of building reef structures that provide protection naturally over time, in addition to improving water quality by removing sediment and algae, and offering refuge for fish, shrimp, molting blue crabs, and other species.
The presence of invasive species within the project area and on adjacent and upstream properties should be documented, and the invasive species should be removed and replaced with native vegetation. Employing a combination of prevention and control measures is important for the management of invasive species, and weedy or invasive species often need to be controlled before and after installation of native plant material. Control methods may include manual, mechanical, chemical, biological, and cultural components. Thorough site evaluation is important to determine the life-cycle characteristics of the invasive species and the effects of control methods on native plant and animal species and on water resources. When limited resources, species-specific challenges, or the degree of infestation make eradication unattainable, a more realistic management goal may be to control the invasive species by reducing the density and abundance to levels that allow native species to eventually dominate to a degree that provides for a healthy ecosystem. Many State agencies maintain lists of invasive plant species.
The overall project design should include design elements that will be needed to facilitate monitoring and maintenance. Examples include implementation of temporary pathways or boardwalks through the habitat during the maintenance and monitoring period to avoid trampling; delineation of temporary staging areas for equipment and vehicles; specifying ingress/egress areas; specifying the timing of maintenance and monitoring events to avoid disturbance during sensitive breeding, nursery, and nesting times; and restrictions on noise, smoking, and animals.
Public use of natural areas may include activities such as general day use, picnicking, birdwatching, fishing, hiking, biking, and boating. Public use of natural areas often results in degradation of the natural habitat because of a variety of factors, including trampling of vegetation and disturbance of wildlife, introduction of trash, and contamination of water and soils by humans and pets–all of which can result in erosion and project failure. Use of boats in some areas may introduce wakes that are larger than waves caused by wind. The expected use and frequency of public recreation; the expected size, use, and frequency of vessels in the area; and the proximity of the site to a boat launch, a marina, or navigational channel are important design considerations for nature-based solutions.
Nature-based solutions come in many different configurations. The design elements depend on the system components, hydrodynamic conditions, terrestrial setting, and ecological needs–the key parameters from Section 2 . This section shows some design examples and cross-sections of nature-based solutions. Their purpose in this document is to convey, graphically, their scale and composition. These selected examples are not an exhaustive list of nature-based solutions, and some of them are conceptual and have not yet been implemented. However, these design examples illustrate the diversity of nature-based solutions and their application to coastal highway resilience.
Region: Mid-Atlantic
Coastal Risks Addressed: Waves, erosion, flooding
Along Water Street in Yorktown, VA (37.2370oN 76.5068oW), York County led a shoreline protection project that placed clean sand fill and rock breakwaters to form a series of pocket beaches–beaches stabilized by artificial or natural headlands (see location overview on Figure 5-15). The project provides protection to approximately 1,600 feet of Route 1020 (Water Street) along the York River and serves as a recreational amenity for the Yorktown waterfront. This shoreline experiences an average fetch of 10 miles across the mouth of the York River and wave energy from across Chesapeake Bay, with a maximum fetch totaling 30 miles. Figure 5-16 shows positions of the shoreline before and many years after construction.
The County of York was the primary sponsor of this project, which was completed as part of a historic waterfront revitalization in conjunction with the Virginia Board on Conservation of Public Beaches. Virginia DOT participated in the project formulation and provided funding proportional to the extent of the State-maintained highway mileage that was previously exposed at the east end of the project.
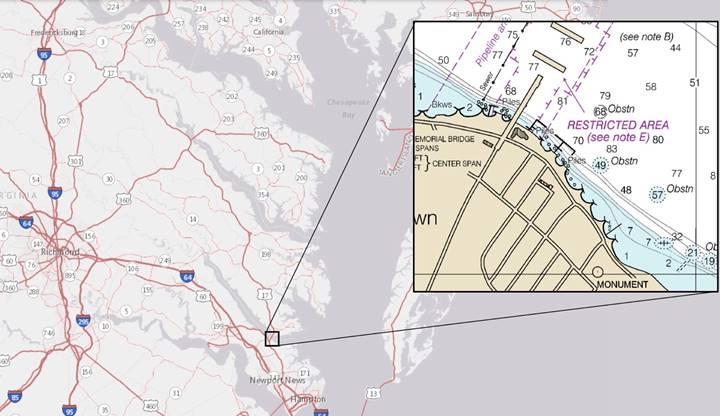
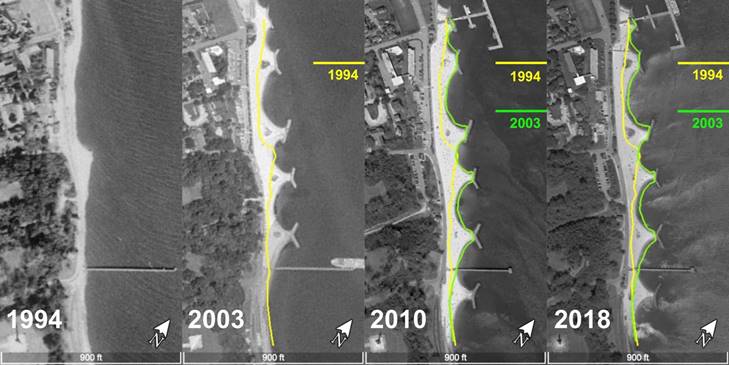
Figure 5-17 shows a general cross-section schematic of the pocket beach. The first three breakwaters and sand beach fill were constructed in September 1994, and the rest were added over the next 10 years as the success of the initial project became clear. The original breakwaters, 7,500 cubic yards of beach fill, and planted Spartina alterniflora and Spartina patens cost $260,000 for protection of 1,350 feet of shoreline for an average cost of $193 per linear foot (Milligan 1996). The project was designed for a 50-year return period storm. Hurricane Isabel (2003), an approximately 100-year return period storm event for this area, resulted in sand losses and local scour, but without significantly affecting project performance. The beach required an additional 3,500 cubic yards of sand to re-establish its pre-storm condition (Milligan et al. 2005). During Hurricane Isabel, the project successfully decreased wave energy that would have otherwise damaged upland commercial infrastructure.
The project has performed well by providing protection to the road and the infrastructure behind the road, while also providing a sandy beach for tourists and locals for more than two decades. The beach and vegetation provide intertidal habitat and shore bird habitat. The addition of a raised stone wall running parallel to the sidewalk mitigates flooding of Water Street during storms. Storms have not damaged the sidewalks and roads since construction of the original pocket beach project (Milligan 1996).
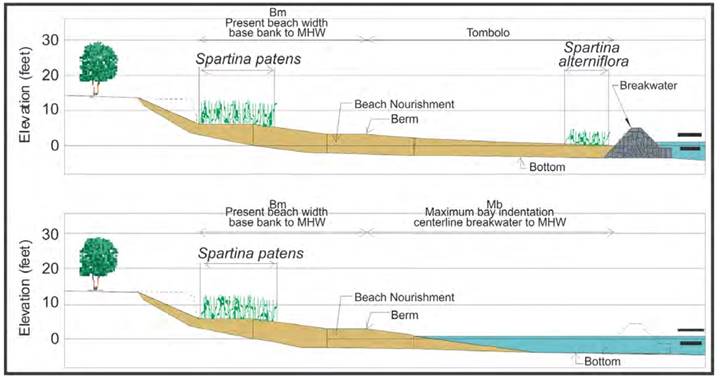
Region: Gulf Coast
Coastal Risks Addressed: Erosion, waves
Alabama DOT considered a nature-based solution as part of a bridge replacement and highway realignment project across Mobile Bay, AL (see location on Figure 5-18). The replacement of an existing bridge necessitates a new eastbound alignment and bridge to carry U.S. 98 across the confluence of the Tensaw River with the Mobile Bay estuary. The proposed realignment will alter approximately 2,200 feet of bay shoreline within the project footprint. Establishment of the new alignment will result in the loss of benthic habitat, aquatic resources, and SAVs (~1 acre). Alabama DOT considered the use of a nature-based solution in order to enhance the resilience of U.S. 98 and to potentially offset unavoidable impacts on aquatic resources. The existing shoreline is hardened with a vertical concrete seawall.
Shorelines within the study area are subject to a small tide range (~1.5 feet), considerable water level fluctuations as a result of storms, and considerable exposure to wave energy. The wave energy exposure is high because of the 30+-mile-long fetches that stretch to the south. Large shoals are directly offshore from the study area and water depths beyond are typically shallow (< 9 feet). The intertidal and nearshore slopes here are both low. This part of the estuary exhibits low salinity levels and nearby shorelines are a combination of sand and intertidal marsh vegetation. Submerged vegetation exists in shallow water depths adjacent to the site.
The resilience requirements for this highway included shoreline and embankment stabilization during minor to extreme events. Alabama DOT considered using a continuous rock revetment from the edge of the pavement down to the existing bay bottom on a slope of 3:1 (H:V).
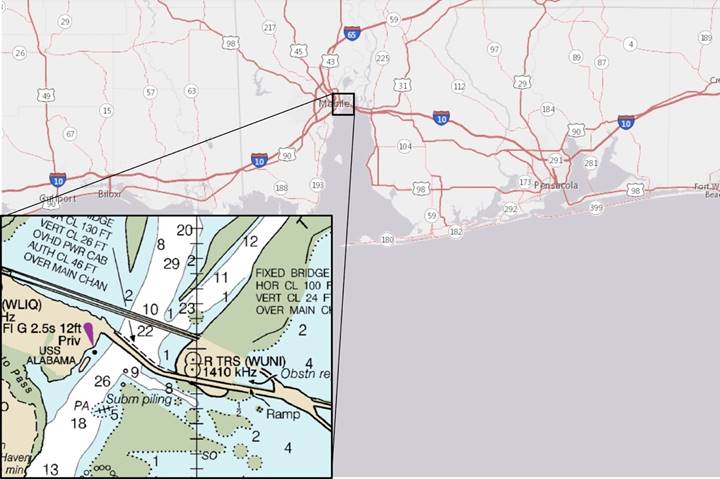
Further analysis revealed that placing a nature-based solution consisting of stone breakwaters and planted marsh in front of the planned revetment (Figure 5-19) would provide multiple benefits. These benefits include:
The material cost of the nature-based solution is approximately $1.2 million. Since it would reduce the cost of the revetment by $1.2 million, it is essentially cost neutral, although it would require additional maintenance and monitoring.
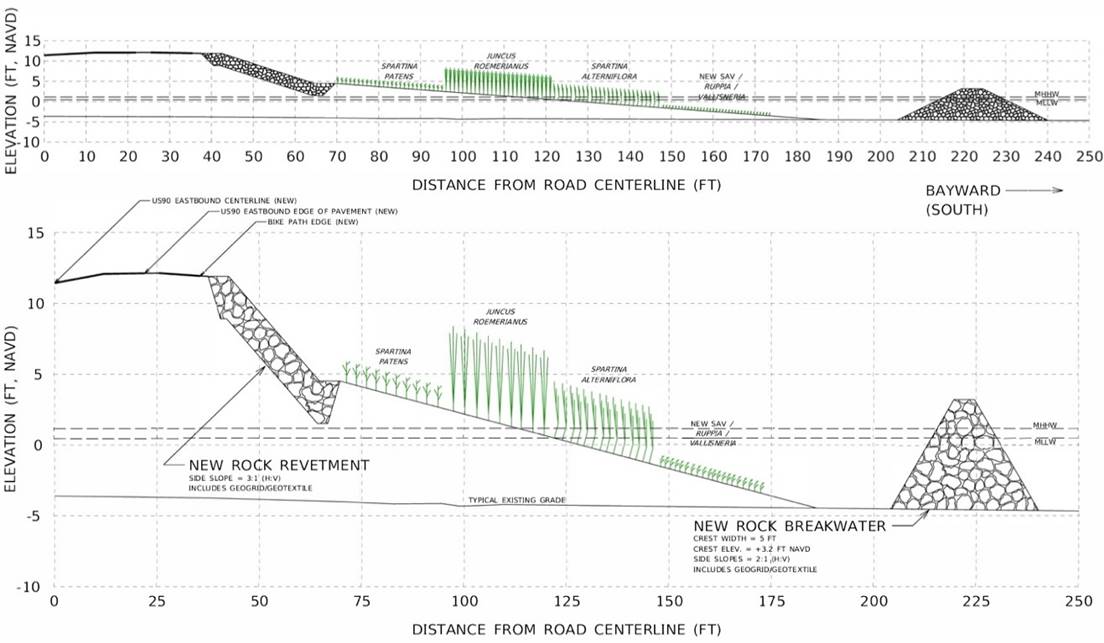
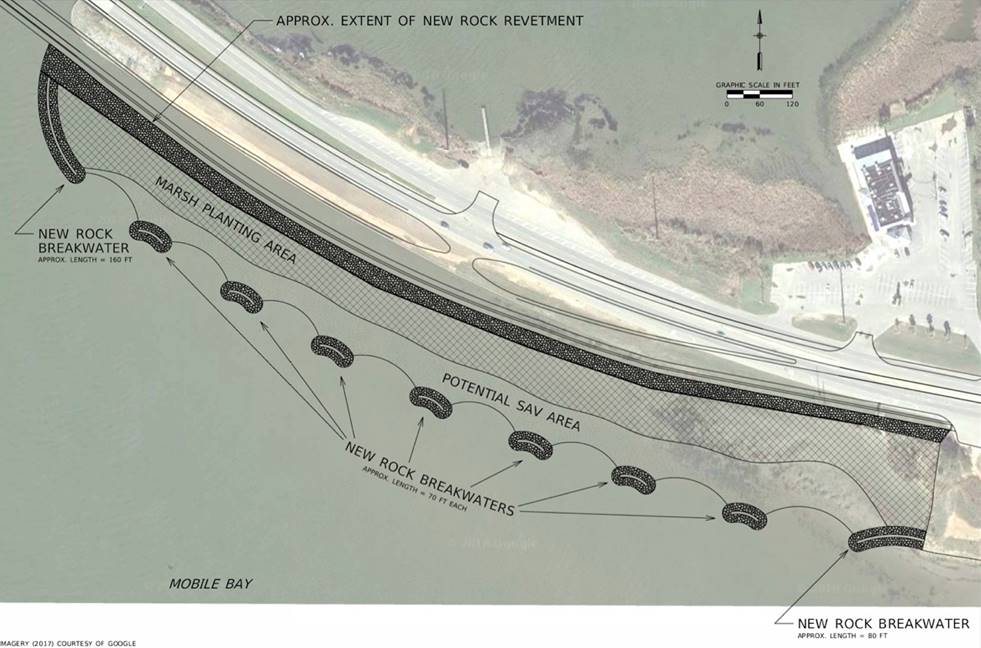
Region: Northeast
Coastal Risks Addressed: Erosion, waves
New Jersey DOT stabilized approximately 1 mile of bay island shorelines as part of a transportation project near Ocean City, NJ (see location overview on Figure 5-21 ). Replacement of the Route 52 causeway across Great Egg Harbor Bay required realignment of two existing navigation channels, exposing quickly eroding marsh shorelines to additional boat wakes (Traylor 2017). New Jersey DOT implemented nature-based solutions to stabilize the eroding marsh banks to address these boat wake concerns raised by the New Jersey Department of Environmental Protection and USACE.
The marsh shorelines are subjected to boat wakes and wind waves of moderate height, resulting from fetch lengths of approximately 3 miles or less. The estuarine conditions, experiencing a moderate tide range of less than 4 feet, support recreationally and commercially important fisheries, shellfish resources, and wildlife. Prior to project implementation, eroding marsh shorelines were severely scarped.
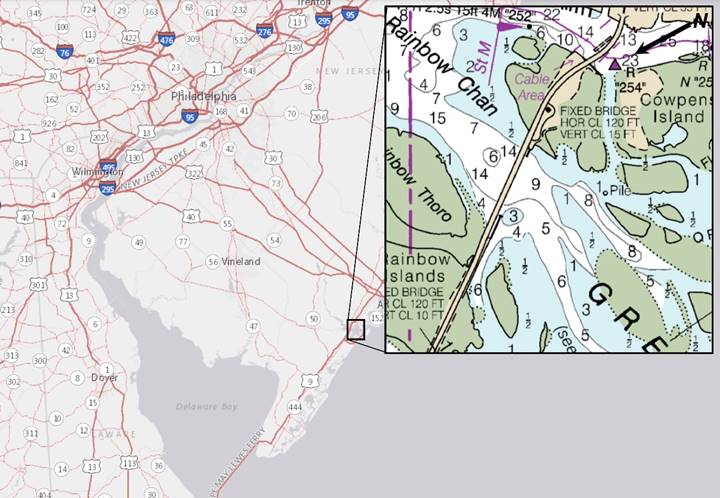
New Jersey DOT developed four unique nature-based solution designs to mitigate the marsh shoreline erosion and to correct the over-steepened intertidal shoreline (see Figure 5-22 and Figure 5-23). Each design accommodated a different level of wave energy exposure, with high energy sites incorporating structural features to further stabilize the restored marsh edge. The designs generally consisted of shoreline regrading using available onsite material, coir fascine edging to stabilize the marsh toe, and planting of Spartina alterniflora landward of the coir fascine. A stone marsh toe revetment and a sheet pile wall were incorporated into the design details for shorelines experiencing higher wave energies.
The first installations occurred in summer 2010, but experienced mixed results because of implementation issues, environmental conditions, and material performance. Projects exposed to lower wave energies and/or in sandy substrate generally performed better than those subject to higher wave energies and/or overlying silty substrate. Adaptive management techniques were used to address shortcomings and improve project performance. The coir fascines were re-installed at higher elevations, pre-vegetated coir mattresses were substituted for marsh plugs, riprap sizes were increased, and the contractor was given more flexibility. Routine monitoring was performed for 5 years. After the first 3 years of monitoring, all sites experienced increases in marsh coverage, average stem height, and average plant density. The sites were undamaged by Hurricane Sandy (2012), which affected the area only a few months following implementation of the adaptive management techniques (Traylor 2017).
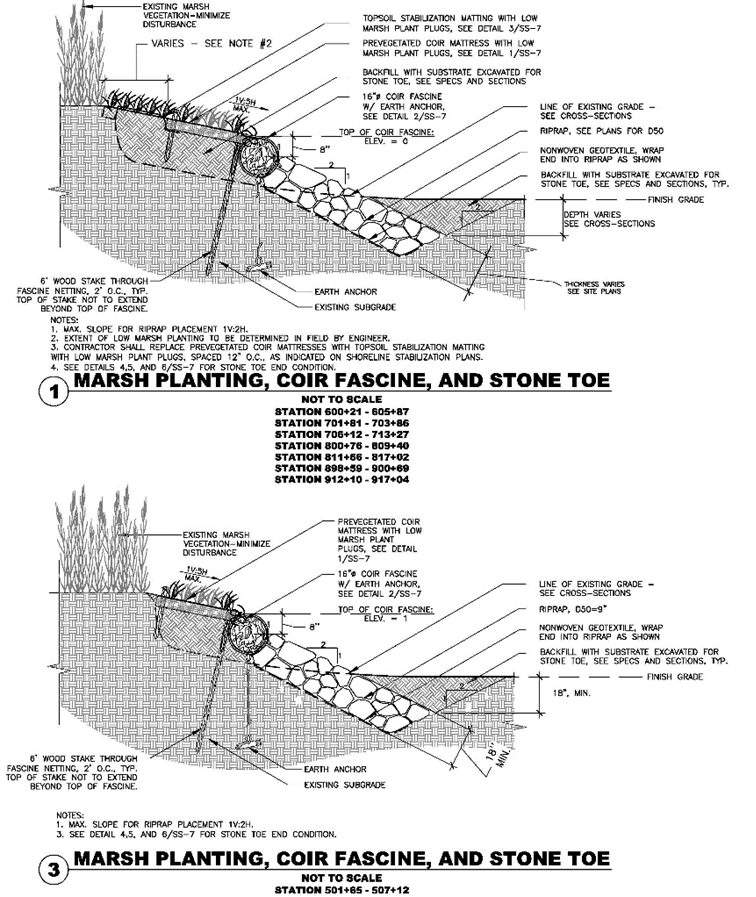
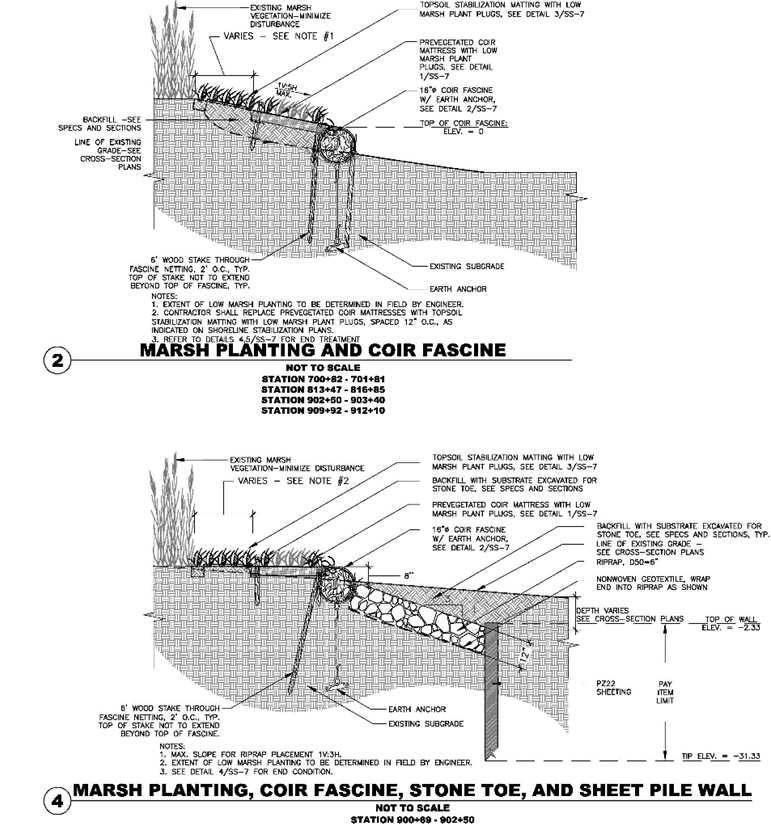
Region: West Coast
Coastal Risks Addressed: Erosion, wave runup, flooding
Oregon DOT designed several nature-based solutions for the purpose of protecting the Oregon Coast Highway (U.S. 101) from the impacts of extreme events and coastal bluff erosion (ODOT 2017). The Oregon Coast Highway is an important 363-mile-long coastal transportation corridor connecting the States of California and Washington. The highway, in many places, runs along high cliffs and beaches, and through State Park lands. In many places, there is limited space between the shoreline and roadway, making many forms of roadway management and maintenance more difficult. The limited space and easement constraints favor a protection strategy; however, Oregon's coastal and land-use policies require completion of a complicated regulatory exceptions process when coastal armoring is necessary. Oregon DOT worked collaboratively with regulatory and resource agencies, as part of this process, to develop a suite of nature-based solutions that existing rules and regulations would allow.
Oregon DOT focused on three sites vulnerable to erosion, surge, and wave runup in Lincoln County (see location overview on Figure 5-24). These sites represent a small fraction of the more than 20 miles of coastal highway that Oregon DOT identified as highly vulnerable to coastal bluff erosion and wave attack. The conditions at the three subject sites are, however, representative of the many constraints and vulnerabilities found at other locations along U.S. 101. The three sites chosen for this study were Beverly Beach to the north of Newport, and Lost Creek and Ona Beach to the south of Newport. The diversity of sites allowed Oregon DOT to address unique constraints, as well as the timeliness of resilience enhancements. The Beverly Beach site required more immediate intervention, while the Lost Creek and Ona Beach sites were of concern over a longer timeframe.
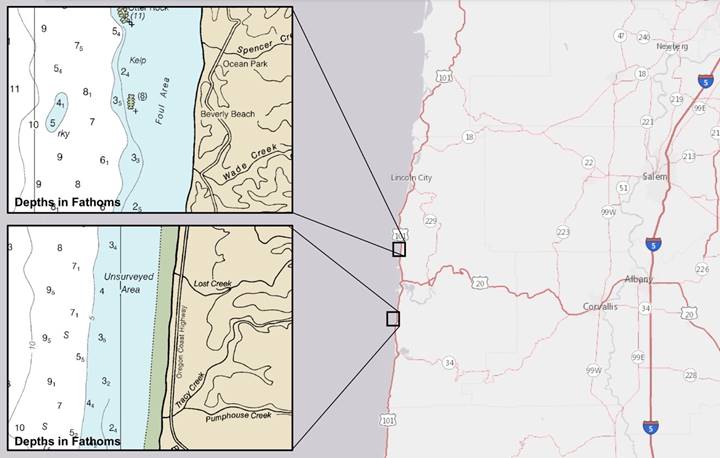
Oregon DOT capitalized on their previous research on dynamic revetments to inform many of the nature-based designs for their study. The Oregon coast consists of natural cobble beaches in many locations. These cobble beaches provide a natural form of wave protection along the backshore and respond to extreme events in a dynamic manner that makes them resilient to ocean forcing. Given its exposure to Pacific Ocean swell and storm waves, and deep offshore depths, nature-based solutions along the Oregon coast are more constrained than they are along sheltered shorelines. Oregon DOT selected a high-range sea level rise scenario to 2050 along with a 100-year return period storm event as the basis for their design–an extreme set of requirements for nature-based solutions.
Oregon DOT designs focused on replicating the naturally occurring beach materials and morphologic features, while incorporating structural features to enhance the resilience of the natural system and their transportation infrastructure. Each design incorporates a restored cobble beach with some other protective or stabilizing feature to address the vulnerabilities and hazards unique to a specific site:
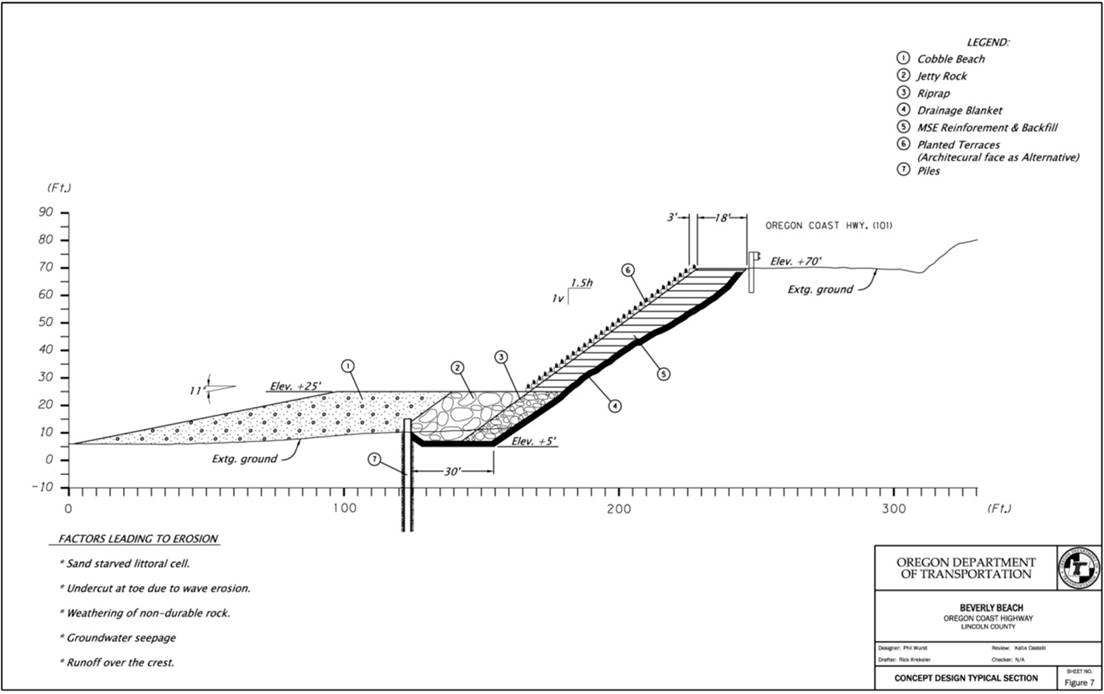
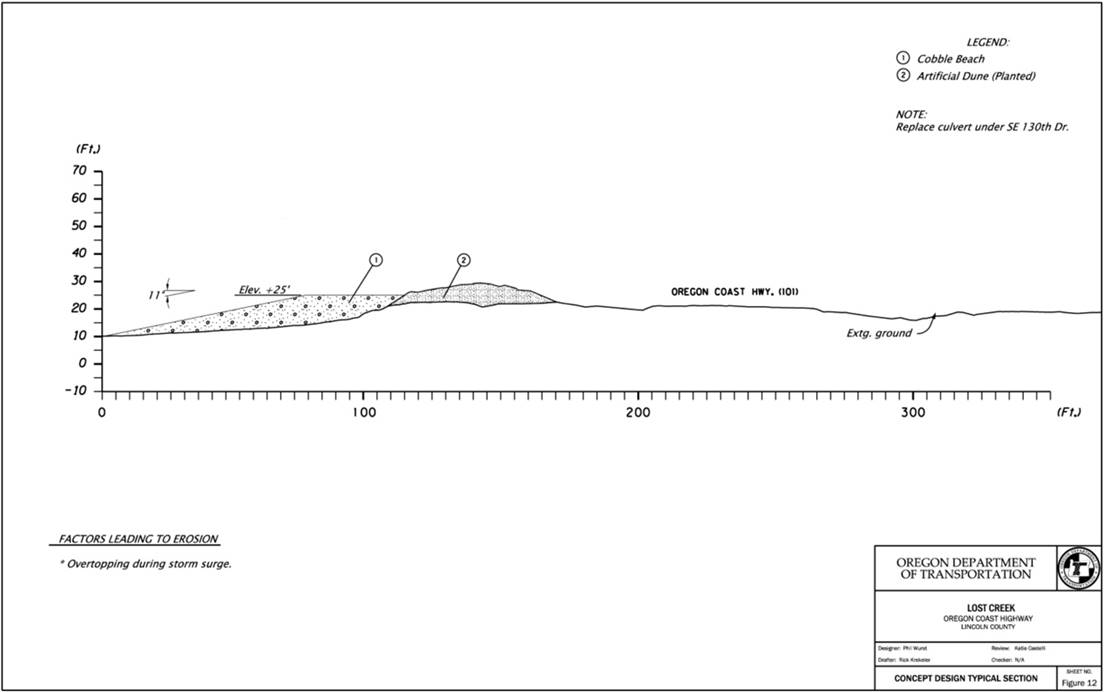
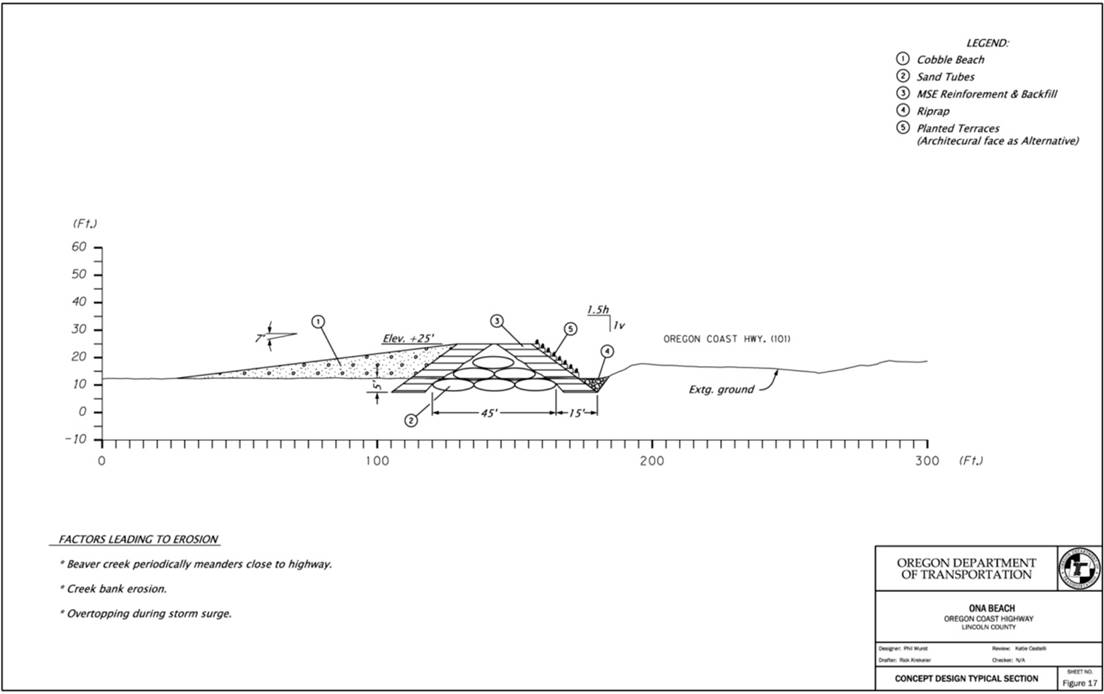
Region: Hawaii and Pacific Islands
Coastal Risks Addressed: Erosion, wave runup, flooding
The Wailuku-Kahului Wastewater Reclamation Facility on the island of Maui is critical infrastructure for the local public. Certain parts of the facility were in danger of failing or being seriously compromised within a 1- to 10-year timeframe because of chronic shoreline erosion. Failure of the injection wells and a chlorine tank would have resulted in a substantial environmental disaster for the County of Maui and a major impact on their wastewater services.
The county opted for a nature-based solution to provide risk-reduction benefits for the facility (Boudreau et al. 2018). The preferred design at this site included a buried revetment, some beach nourishment, dune restoration, and vegetative plantings. The revetment will protect the reclamation facilities against shoreline retreat. Simultaneously, the dune and vegetation reduce the frequency and magnitude of wave-induced flooding (from wave runup) while also providing sandy beach habitat. This nature-based solution provides shoreline protection for critical public infrastructure and incorporates multiple adaptation strategies to provide resilience from future sea level rise. For example, the county opted to give up land by placing the buried revetment well landward, thereby increasing the amount of time until future shoreline retreat would intercept the protective feature. In addition, the beach nourishment project advanced the shoreline seaward, further increasing its resilience to erosion, flooding from wave runup, and sea level rise impacts.
Three years of monitoring data illustrate that the nature-based solution performed well and accomplished its goals of stabilizing the shoreline position. Seasonal shoreline fluctuations remained stable and were consistent with pre-project values. The shoreline position has advanced seaward in portions of the project area with accretion occurring over some of the beach nourishment profiles. This accretion has led to a temporary reduction in the annual erosion rate.
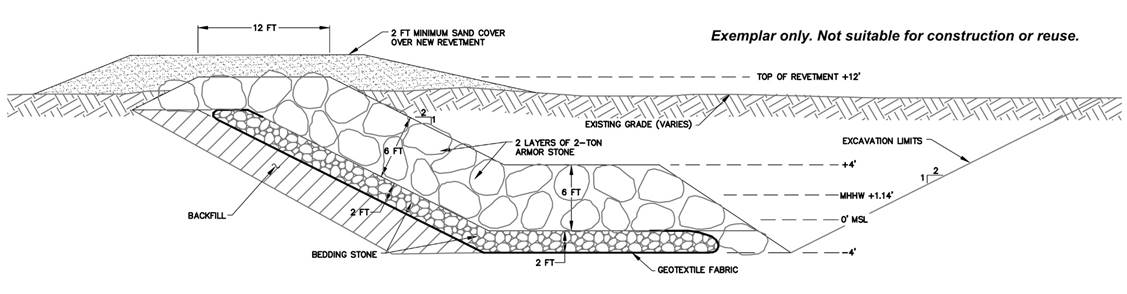
Region: Great Lakes
Coastal Risks Addressed: Erosion, waves
Figure 5-29 shows yet another nature-based solution with a transportation application, but this time in the Great Lakes. This project was implemented along the St. Clair River in Marysville, MI, a tributary to Lake Huron, and replaced 1,900 feet of failing steel seawall, which is visible in Figure 5-29b taken prior to implementation. The roadway visible at the top left of that figure is Interstate 94. This shoreline is a major feature of the City of Marysville and it is used for both passive and active recreation. A heavily used walking path along the shoreline was relocated as part of this project.
This nature-based design, used to stabilize the roadway embankment and reduce erosion from wave action, includes a large stone toe, emergent wetland shelf/bench with more than 10,000 native plants, embankment revetment with toe protection, and vegetation near the edge of pavement. This site is subject to large fluctuations in lake level, with low and high water conditions visible in Figure 5-29c and Figure 5-29d, respectively. The large water level fluctuations necessitated a substantial toe channelward of the wetland shelf.
This nature-based solution provides multiple benefits. Removal of the seawall allows connectivity between the upland and the waterway. As lake levels rise, the land-water interface extends over the wetland bench and stone toe, which provide wave attenuation. The presence of the wetland plants also improves water quality associated with stormwater runoff from the roadway. The improved land-water connectivity also provides enhanced recreational opportunities along the riverfront.
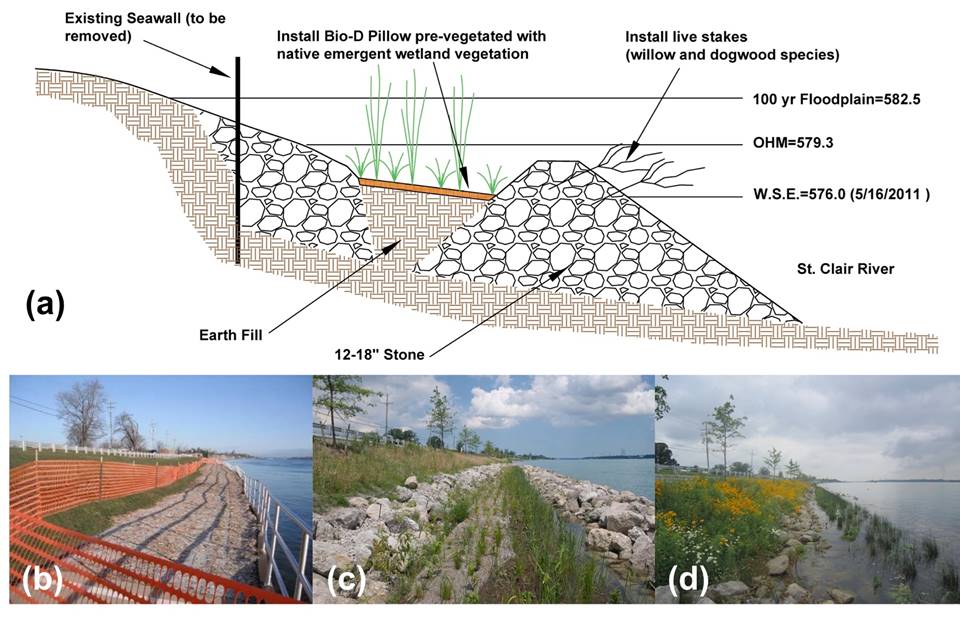
This section focuses on the permitting process for nature-based solutions. This, however, should not be the first time during the design phase when you establish contact with the pertinent regulatory agencies. That initial contact should have occurred during the planning and/or conceptual design phases of your work. Meeting with regulatory agencies early in the process can minimize the amount of time spent revising and refining the design of your nature-based solution. After reading this section you will better understand some of the Federal and State regulations that apply to nature-based solutions, the types of permits commonly used, the general workflow associated with submitting and obtaining permits, NEPA compliance issues, and opportunities for meeting compensatory mitigation requirements.
Civil works projects in the coastal environment, including nature-based solutions, are subject to several Federal laws, policies, and regulations. This section describes some of the most common Federal regulations that govern the permitting of nature-based solutions. Where appropriate, the text also names the Federal agencies that administer or assist with administration of those regulations. Figure 6-1 summarizes the relevant Federal regulations described in this section.
Almost every project involving work and/or activities in coastal areas is subject to the Clean Water Act (CWA) of 1972, which is administered by the U.S. Environmental Protection Agency (USEPA). The CWA is the primary Federal statute governing protection of the Nation's waters. Nature-based solutions are often subject to section 404 of the CWA, which regulates the discharge of dredged or fill material in waters of the United States, including wetlands. This includes the use of dredged or fill material for development, water resource projects, infrastructure development (e.g., roads, bridges), and for the construction of nature-based solutions. USACE handles the day-to-day permitting and enforcement of the section 404 program. Under circumstances where section 404 is required, permit applicants must also obtain a section 401 certification from the State in which the discharge of dredged or fill material originates. The section 401 certification ensures that materials discharged to waters of the United States will comply with relevant provisions of the CWA, including water quality standards.
Transportation infrastructure projects and nature-based solutions are also subject to section 9 and section 10 of the Rivers and Harbors Act of 1899. Section 9 of this act restricts the construction of any bridge, dam, dike, or causeway over or in navigable waterways of the United States. Section 10 of this act restricts the building of any wharf, pier, jetty, breakwater, bulkhead, or other structure, as well as excavation and/or fill within navigable waterways. Potential discharges associated with activities restricted by section 9 and section 10 of this act are also subject to the CWA.
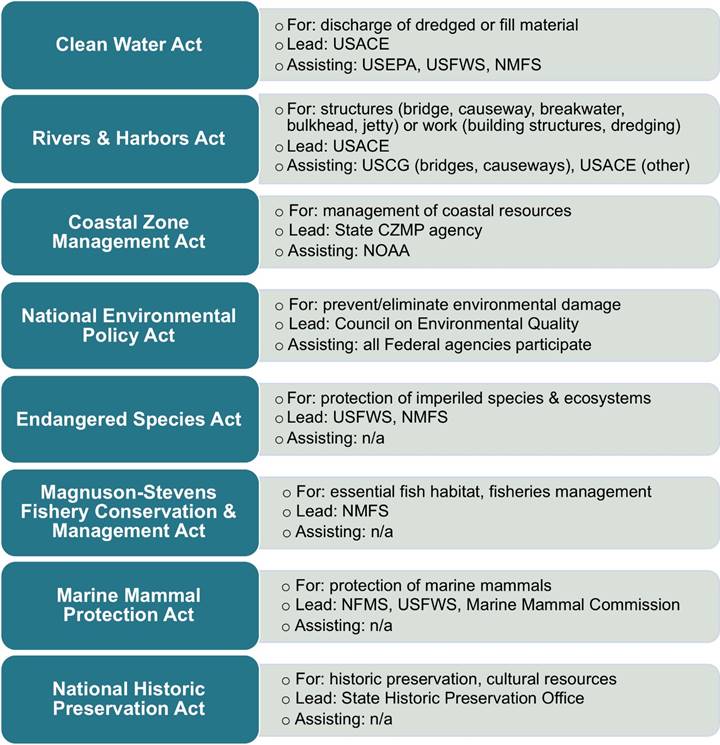
With the exception of bridges and causeways, USACE is responsible for maintaining the standards set by the Rivers and Harbors Act, and for issuing permits. The U.S. Coast Guard (USCG) is responsible for issuing the permits needed to build bridges and causeways in navigable waters. Relevant Federal laws related to bridge permits include section 9 of the Rivers and Harbors Act, as well as the General Bridge Act of 1946. Additional considerations with respect to bridges and bridge permits are described in 23 CFR § 650 Subpart H (§ 650.801–§ 650.809), where FHWA is granted specific exemptions for permits when certain conditions are met.
Transportation and nature-based projects are also subject to the FHWA floodplain regulations described in 23 CFR § 650 Subpart A. These regulations capture the NEPA-aligned requirements and FHWA design standards (§ 650.115/650.117) regarding the location and hydraulic design of encroachments on floodplains.
Nature-based solutions have the potential to affect fish, wildlife, and/or marine mammals. The Endangered Species Act (ESA) protects and recovers imperiled species and the ecosystems on which they depend. The ESA is administered and enforced by the U.S. Fish and Wildlife Service (USFWS) and the NOAA National Marine Fisheries Service (NMFS) (Services). The USFWS and NMFS review public notices and environmental documents (e.g., environmental assessments, environmental impact statements) released by the lead Federal agency for compliance with the ESA, and they also conduct consultations with the lead Federal agency when a proposed project may affect federally endangered or threatened species. The level of USFWS or NMFS involvement in a project depends on the affected species and the nature and extent of anticipated impacts (direct and indirect) on that species and its designated critical habitat. If "take"8 of a federally listed species is anticipated, USFWS or NMFS will issue a biological opinion, the terms and conditions of which are generally binding on the lead Federal agency. The duration of consultations with USFWS and NMFS varies, but under circumstances where take is anticipated, the statutory timeline allows for up to 135 days from initiation of consultation to issuance of the biological opinion. The Services have substantial discretion in determining whether a consultation request is considered incomplete (e.g., because of insufficient survey data or impact analysis), which may result in additional delays. Accordingly, as described below, early coordination is highly recommended to identify listed species and their designated critical habitats (https://ecos.fws.gov/ipac/) that may be affected by a proposed project, the need for additional surveys, appropriate survey windows, and avoidance and minimization measures that could be integrated into the project early in the planning and design stages.
The Magnuson-Stevens Fishery Conservation and Management Act, or more simply the Magnuson-Stevens Act (MSA), governs commercial and recreational fisheries in U.S. Federal waters. The MSA may apply to nature-based solutions because they have the potential to negatively affect Essential Fish Habitat (EFH).9 Similar to administration of the ESA, NMFS reviews public notices and environmental documents for compliance with the MSA, and also conducts consultations with the lead Federal agency when a proposed project may adversely affect EFH. There is no statutory timeline for EFH compliance; however, in general, consultations can be completed within 2 to 3 months. Similar to ESA compliance, early coordination is highly recommended. In order to receive substantive feedback from NMFS, literature searches should be conducted prior to coordination.
While less common, the Marine Mammal Protection Act (MMPA) may apply to nature-based solutions that have the potential to harm or impair marine mammal species. Implementation of the MMPA is jointly shared by NMFS, USFWS, and the Marine Mammal Commission, which provides independent oversight of Federal agencies.
Federal permit actions for nature-based solutions can be subject to the Coastal Zone Management Act (CZMA) and the National Historic Preservation Act (NHPA). As with the ESA and MSA, it is the responsibility of the lead agency to demonstrate compliance with these statutes, while the administration and enforcement of CZMA and NHPA lies with other Federal authorities. NOAA is responsible for programmatic administration of the CZMA at the national level, but relies on its 34 Coastal Zone Management Programs (CZMPs) for ensuring project compliance for CZMA consistency at the State level (see next section) and for issuance of project approvals. Similarly, the NHPA is handled at the State level. State Historic Preservation Offices (SHPOs) or Officers ensure that permitted projects do not adversely affect historic buildings, sites, structures, or cultural resources. For example, replacement of a historic bridge or causeway may constitute an adverse effect, therefore the lead agency may be required to consult directly with the SHPO. Similarly, dredging projects may pose a risk to cultural resources, and thus may also require agency-to-agency consultation, as well as notification to federally recognized tribes. With respect to timelines, the CZMA allows the State coastal zone management agency up to 6 months for review and approval of a consistency determination provided by either the applicant or the lead Federal agency. There is no statutory timeline for NHPA compliance, although the SHPO may have established protocols with the Federal lead (e.g., USACE, FHWA) to help guide the review and approval processes. In general, consultations can be completed within 3 to 4 months. Similar to ESA and MSA compliance, early coordination is highly recommended. In order to receive substantive feedback from the SHPO, literature searches (e.g., survey records from regional Information Centers) should be conducted prior to coordination.
The number and types of regulations applicable to coastal projects, including nature-based solutions, varies from State to State. A description of the applicable State regulations for the 35 coastal States and territories is beyond the scope of this guide. Instead, this section of the guide generally describes the two primary issues that often apply to coastal projects in coastal States or territories: coastal zone management and impacts on State-owned lands. The text also provides a brief overview of unique State policies that encourage or support nature-based solutions.
All work performed in the "coastal zone" is subject to specific rules and regulations of that State's or territory's coastal zone management program, as authorized by the CZMA. As defined in the CZMA, the coastal zone includes coastal waters extending to the outer limit of State submerged land title and ownership, adjacent shorelines, and land extending inward to the extent necessary to control shorelines. The coastal zone boundary is defined differently across States and territories, but generally extends from on-shore (inland) areas to near-shore (marine) waters. The goal of coastal zone management is to balance environmental protection and coastal development. As these issues are often unique from State to State, each State or territory develops its own coastal zone management regulations.
Coastal infrastructure projects, including nature-based solutions, are subject to coastal zone management regulations. Applicable portions of the regulations apply to dredging and filling, the use and construction of structures, shoreline stabilization, and other activities that may result in direct or indirect impacts on tidal and non-tidal aquatic resources located within a designated coastal zone boundary. As described in Section 6.3, the State coastal zone management agency is involved in the review of environmental compliance documentation (e.g., environmental impact reports, environmental impact statements) and permit applications for proposed activities in the coastal zone. In this role, the State agency is charged with ensuring that a project meets coastal zone consistency requirements and, if so, issues the appropriate approval. Table 10-11 in Appendix D provides a list of State agencies charged with administration of the CZMA and links to their websites.
Nature-based solutions are subject to regulations that limit or manage impacts on State-owned lands. These regulations can severely limit the type, size, and characteristics of a nature-based solution. For example, dredging, filling, and the construction of bridge or revetment structures may directly or indirectly impact the submerged or subaqueous lands of a State or territory, or the public's use of such lands. A prescribed tidal datum often serves as the delineation between private and State-owned land. A tidal datum represents the 18.6-year average (i.e., tidal epoch) of a specific stage, or elevation, of the tide. The Mean High Tide Line or Mean Higher High Water are commonly referenced in State regulations as the delineation between private and public lands. The State agency charged with managing State-owned lands must approve any work performed, or impacts on, submerged lands seaward of their regulatory boundary. The ability to perform work seaward of the regulatory boundary varies from State to State, as do the limitations on impacts, the potential fees associated with those impacts, and mitigation requirements to offset impacts. In some States, property owners are required to sign a legal affidavit waiving their right to ownership for all new lands created either as part of the project (i.e., initial creation of new land) or as a result of the project (i.e., long-term accretion). While owners maintain their riparian rights to the new land, it is not recorded as part of their legal property description and they do not have the right to erect permanent structures on it.
Currently, some States have specific laws, regulations, and/or policies that require or encourage the use of nature-based solutions, such as living shorelines, over traditional shoreline stabilization practices for the purpose of erosion control. Examples include policies in Maryland, North Carolina, and Virginia, which are briefly summarized below. Other States are currently developing similar policies or provide specific exemptions that encourage the use of nature-based approaches for shoreline management (e.g., Florida).
As described above, most nature-based solutions are subject to regulatory review by Federal and State agencies for compliance with CWA section 404, CWA section 401, ESA, NHPA, and CZMA. USACE generally acts as the Federal clearinghouse for infrastructure projects occurring predominantly within aquatic (tidal and non-tidal) areas, coordinating with each of the agencies to demonstrate compliance with these statutes prior to issuing a permit. When USACE is not the lead Federal agency (e.g., for long, linear projects with substantial upland components), the responsibility for compliance with these statutes lies with the lead Federal agency. Under these circumstances, USACE limits its review and permit authority to project work occurring within and adjacent to aquatic (jurisdictional) areas. Given the importance of USACE's role, this guidance document highlights the USACE permitting process below for (in order of increasing complexity) nationwide permits, regional or programmatic general permits, and individual permits.
As shown in Figure 6-2, there are three types of permits: nationwide general, regional/programmatic general, and individual. These permits have different requirements and you should determine, in consultation with your permit coordinator(s), which one is most appropriate for your project. More details about each permit type and their requirements are outlined below.
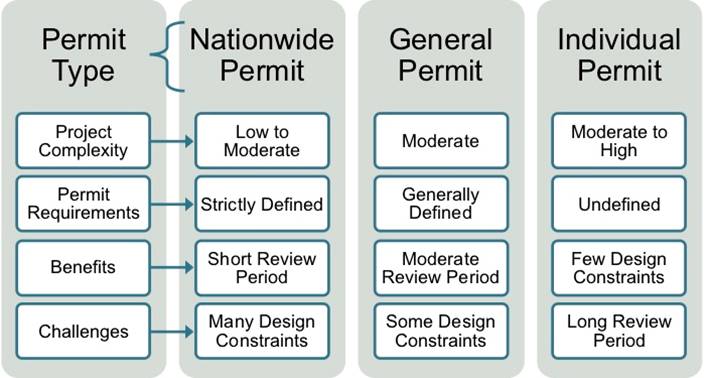
Individual permits are evaluated on a case-by-case basis, take longer to process (i.e., 4 to 12 months), and are subject to a 30-day public comment period. Individual permits are typically used for larger, more complex nature-based projects that do not qualify for a general permit. Until recently, individual permits were the only available option for permitting nature-based solutions. Approval timelines depend largely on the level of coordination required to demonstrate compliance with other relevant Federal statutes (e.g., ESA, MSA, NHPA), thus emphasizing the importance of early coordination with the lead Federal agency.
General permits provide a more streamlined permitting process for projects that are similar in nature, and are expected to result in minimal individual and cumulative impacts on the aquatic environment (40 CFR § 230.7(a)). In order to ensure minimal individual and cumulative impacts, work eligible for a particular general permit needs to adhere to multiple general conditions. Individual authorizations under a general permit typically have shorter review periods (< 2 months if mitigation and other Federal agency coordination is minimal) and are not subject to a public review period. However, all such authorizations may still be subject to interagency consultation if there are issues related to ESA, EFH, or NHPA.
There are two broad categories of general permits. Regional or programmatic general permits are issued by the District Engineer of the local USACE district on a regional or State basis. A USACE district may issue a regional or programmatic general permit to address activities not covered by a nationwide general permit (see below). Some States have general permits that set forth specific guidance and requirements for nature-based approaches to shoreline management. These requirements may limit the size, location, and materials used in the nature-based solution.
Nationwide permits are issued to the public at large for common categories of project activities (e.g., linear transportation projects, minor discharges) that fall under certain impact thresholds (e.g., 0.5-acre permanent impacts on the waters of the United States). There are four nationwide permits that are relevant to the implementation of nature-based solutions:
Nationwide permits have been regionally conditioned or revoked in some USACE districts. Specific regional conditions may require additional agency coordination and unique design considerations. For instance, there is significant regional variation in implementation of Nationwide Permit 54. Alabama and Maryland use state-specific general permits that were developed prior to Nationwide Permit 54. Washington, Ohio, Louisiana, and Texas have regional conditions on Nationwide Permit 54. (Boyd et. al. 2017) Before pursuing a nationwide permit for nature-based solutions, check with your USACE district office and State environmental agencies to determine which, if any, are available in your State.
Nature-based projects often follow unique permitting timelines, but many follow a similar workflow from beginning to end. Figure 6-3 provides an example of a permitting workflow for a typical nature-based solution. This workflow consists of three distinct phases: plan preparation, finalizing the plan, and agency review.
During plan preparation, the permittee develops (at a minimum) a conceptual design or plan for the nature-based solution and conducts a pre-application meeting with Federal and State regulatory agencies to discuss the project location, design, and potential environmental constraints. The permittee may need to revise the conceptual design or plan based on the results of the pre-application meeting. If the changes to the plan are substantial, a second pre-application meeting may be warranted.
Once there is agreement on the general characteristics of the nature-based solution and having determined the permits and other approvals required for the work, the permittee finalizes their design or plan. At a minimum, the permit application will include the design or plan (e.g., dimensions, areas, amount of fill used, profile and planform drawings), a written project description, the purpose and need for the project, a jurisdictional delineation, proposed impacts on the waters of the United States, and possibly additional technical studies documenting existing environmental conditions (i.e., biological, historic, and cultural resources). It is recommended that a mitigation proposal and plan are prepared prior to finalizing the design plan and submitting the permit application, with input from the USACE district mitigation lead.
The permittee submits their application to the appropriate Federal and State agencies in the final phase of the workflow. The agencies review and provide feedback and/or a permit decision during this final phase. In the case of an individual permit, the applicant will likely respond to comments submitted by the public and consulting Federal agencies. Successful resolution of these comments may require more investigation, justification of the project purpose and need, or modification of the project design or mitigation plan. No public comments are submitted in the case of general permits and nationwide permits. However, USACE and relevant State agencies may ask the applicant for more information about, or clarification of, a specific issue.
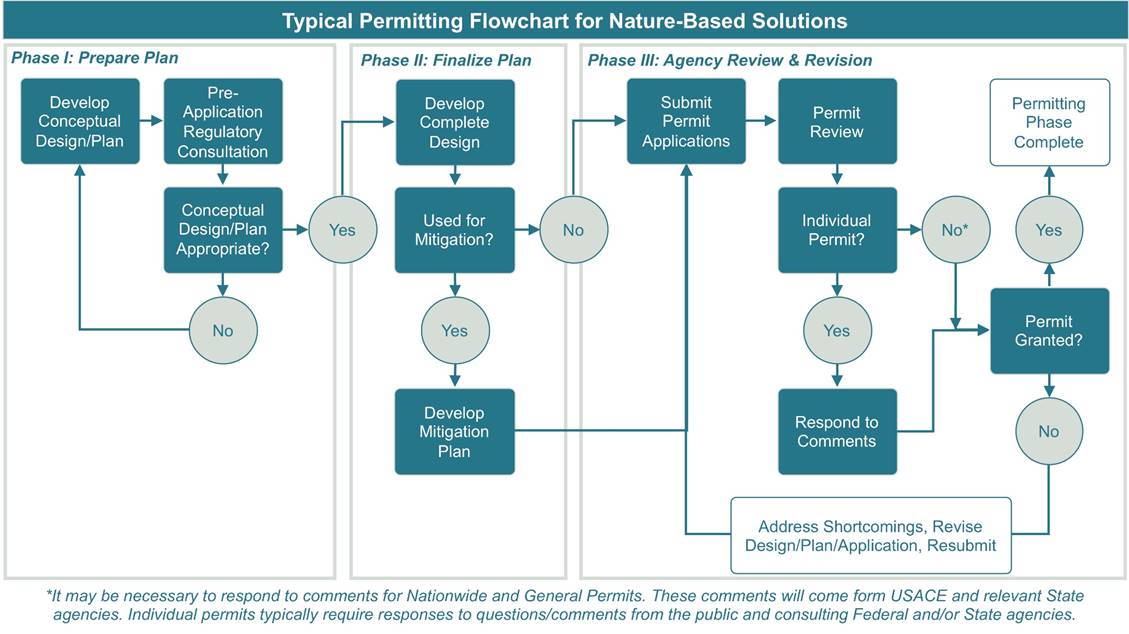
Projects or policy changes involving Federal actions, including Federal assistance, leases or easements, and permitting, are required to demonstrate compliance with the National Environmental Policy Act (NEPA). NEPA is administered by the Council on Environmental Quality (CEQ), a Federal office tasked with oversight and development of policies and guidance tools regarding NEPA implementation and compliance. CEQ is also responsible for resolving disputes between lead or cooperating Federal agencies.
NEPA provides Federal agencies with a framework for the evaluation of environmental impacts, alternatives, mitigation measures, and comments from agencies and the general public. During the NEPA process, the lead Federal agency concurrently demonstrate compliance with other Federal laws, regulations, and orders, including the Endangered Species Act and the National Historic Preservation Act. In terms of project timeline, preparation of the NEPA compliance documentation is either conducted in advance of, or concurrent with, permitting, depending on the lead Federal agency, the category of permit, and the need for interagency consultations.
Common categories of NEPA compliance documentation include, in descending order of complexity:
Under circumstances where USACE is the lead Federal agency, the timing of NEPA compliance depends largely on the category of permit being sought. For nationwide permits and other general permits (e.g., regional general permits) issued for categories of activities, NEPA is satisfied programmatically on a national or regional scale, respectively, prior to application submission. USACE prepares an EA at the time of the establishment of the general permit. During the 5-year authorization period, individual activities that are eligible for the general permit do not need to undertake a separate NEPA review. However, the applicant still needs to demonstrate compliance with the terms and conditions of the permit, as well as compliance with other relevant Federal statutes (e.g., EFH, ESA, NHPA, CZMA) in order to receive a section 404, section 9, or section 10 permit. For individual permits, USACE conducts project-specific NEPA compliance documentation concurrent with permit processing (i.e., after an application is submitted). Depending on the size and complexity of a project, as well as the anticipated impacts, USACE may elect to prepare either an EA (~99.7 percent of the time) or an EIS (if the impacts are significant). Under circumstances where another Federal agency is the lead (e.g., FHWA), compliance with NEPA is often conducted prior to submission of permit applications.
Material requirements for EISs and EAs include the following: a detailed project description, purpose, and need; alternatives analysis, plans, and specifications (level of detail varies); impact evaluation for relevant environmental and social factors; solicitation of public comments; identification of mitigation measures; and demonstration of compliance with other Federal laws, regulations, and orders.
For major infrastructure projects (i.e., those that may require an EIS), Executive Order (EO) 13807 requires Federal agencies with purview over a given project to conduct environmental reviews and authorization processes in a coordinated, consistent, predictable, and timely manner, culminating in One Federal Decision. The EO directs Federal agencies to develop a single EIS and Record of Decision (ROD), and issue all necessary authorizations within 90 days of completion of the ROD. An overarching goal of EO 13807 is to complete all reviews and authorization decisions for major infrastructure projects within a 2-year timeframe. For additional information, see the following:
For nature-based solutions, relevant portions of EO 11988 (floodplain management) and EO 11990 (protection of wetlands) also apply.
In the context of nature-based solutions, early identification of opportunities to integrate habitat restoration, creation, and enhancement within a project design is critical. In addition, as discussed in Section 5.1, Assembling the Team, early coordination with State and Federal resource and regulatory agencies (e.g., USFWS, NMFS, USACE) provides insight and expertise on special-status species, habitat requirements, and regional priorities, and also has the potential to streamline agency review of infrastructure projects during both the planning and permitting stages. For example, a project may qualify for streamlined permitting with USACE if it meets the terms and conditions of a nationwide permit or regional general permit. Efficiencies are often gained through the early identification of project objectives and data needs that serve to satisfy the statutory requirements of the agencies with purview over the project. Additional opportunities to avoid or minimize adverse effects to sensitive resources, as well as sources of funding or technical assistance, may also be identified through such advance planning strategies.
The construction of new transportation infrastructure projects, or modifications to existing infrastructure, may require compensatory mitigation. As defined by USEPA (2015b), compensatory mitigation "... refers to the restoration, establishment, enhancement, or in certain circumstances preservation of wetlands, streams or other aquatic resources for the purpose of offsetting unavoidable adverse impacts." Transportation agencies may elect to create, adopt, or integrate programmatic mitigation plans as part of statewide transportation planning in order to address potential impacts of future projects.10
Transportation professionals can incorporate nature-based solutions to meet mitigation requirements, gain mitigation credits, offset environmental impacts, or meet permit requirements (e.g., section 404, Endangered Species Act, Total Maximum Daily Load, National Pollutant Discharge Elimination System). Pursuing compensatory opportunities for nature-based solutions can provide an additional incentive for implementation. The eligibility of a specific project, however, is determined on a case-by-case basis. Early engagement between the transportation agency and its USACE district mitigation lead is important. The following subsections describe how nature-based solutions can be used to meet environmental regulatory requirements. A summary of mitigation opportunities and challenges is presented in Table 6-1.
Many nature-based solutions provide measurable water quality improvements. For example:
| Mitigation Option | Opportunity | Challenge |
|---|---|---|
| Permittee Responsible Mitigation |
|
|
| In-Lieu Fee (ILF) Mitigation |
|
|
| Mitigation Banking | Same as ILF plus ...
|
Same as ILF plus ...
|
The benefits provided by nature-based solutions may assist in meeting Total Maximum Daily Load (TMDL) requirements for impaired bodies of water under 303(d) of the Clean Water Act. A TMDL is calculated as the maximum amount of a pollutant allowed to enter a waterway while maintaining water quality standards in a receiving body of water. If the current pollutant loading rates exceed the maximum allowable value, then the TMDL is used to determine a pollutant reduction target and load reductions are subsequently allocated to sources.
Some States now permit the use of qualifying shoreline management practices to meet sediment and nutrient load reduction targets as part of a TMDL program. For example, Maryland and Virginia have established guidance for determining sediment and nutrient load reduction targets for existing urban development under the Chesapeake Bay TMDL program (Forand et al. 2015; Harmon 2018). Load reduction values are determined using simple, conditional equations that are functions of the length of shoreline stabilized and/or acres of tidal marsh created.
Many State DOTs have direct experience using Permittee Responsible Mitigation (PRM) to meet compensatory mitigation requirements. Under PRM, a State DOT has direct control of, and ongoing responsibility for, the mitigation action or project. A transportation agency may implement a nature-based solution under PRM in such a way as to simultaneously meet mitigation requirements and enhance the resilience of their transportation infrastructure.
The ability of a nature-based solution to meet compensatory mitigation requirements is determined through consultation between the permittee (e.g., DOT, MPO, municipality) and the regulatory agencies. Initial consultation with the regulatory agencies will often inform the activities described in a mitigation proposal. In the proposal, a permittee may elect to perform in-kind or out-of-kind mitigation. In-kind mitigation activities are those in which adverse impacts on a specific habitat type are mitigated through the establishment, restoration, or enhancement of that same habitat type. Out-of-kind mitigation projects address adverse impacts on one habitat type (e.g., submerged aquatic vegetation) through the establishment, restoration, or enhancement of another habitat type (e.g., tidal marsh).
A permittee must be able to provide continued management of their mitigation project as part of the PRM process. Providing continued management requires both the ability to access the project for the purpose of performing monitoring and maintenance, and the dedicated financing to do so. PRM often requires specific monitoring and maintenance requirements that seek to ensure long-term project success. See Section 8 for more information on monitoring requirements.
In-Lieu Fee (ILF) mitigation is another type of mitigation that compensates for impacts on certain habitat types. Under ILF mitigation, the permittee provides funding to an ILF sponsor. The sponsor, which is often a public agency or nonprofit organization, collects the fees from multiple permittees to build and/or maintain mitigation sites. This type of mitigation is often "offsite," meaning that it does not occur at or near the actual impacts. The mitigation frequently occurs after the permitted activity is complete.
Mitigation banking is another form of compensatory mitigation that addresses unavoidable impacts on natural resources and the environment. Under this form of mitigation, a permittee purchases credits from an established "mitigation bank," which is the preservation, enhancement, restoration, or establishment of a wetland, stream, or habitat conservation area that compensates for adverse impacts on nearby ecosystems. Compared with freshwater streams and wetlands, opportunities for coastal mitigation bank credits are fewer in number and the cost of credits is often greater. USACE maintains an online geodatabase called the Regulatory In-Lieu Fee and Banking Information Tracking System, or RIBITS (USACE 2019a). The RIBITS database contains information on mitigation and conservation banking and ILF programs nationally.
Now that you have your permits in hand, it is time to build your project! Before you can build the project, however, you must first select a contracting method and then identify potential contractors. This section addresses these issues and also provides a description of the phases of construction and some special considerations for constructing nature-based solutions.
Before initiating contact with a marine contractor, reach out to your coastal resource agency or local/regional groups that are knowledgeable regarding nature-based solutions. They will often provide excellent recommendations, or at least a list of marine contractors with experience constructing nature-based solutions. The percentage of marine contractors with nature-based experience is relatively small (but growing).
The construction team should include appropriate engineering and ecological expertise to resolve construction issues as they arise. Site conditions change often, and onsite modifications are often made quickly to prevent work stoppage. You may wish to hire a construction manager and other appropriate experts for very complex projects (Duhring 2016).
Narrow down your list of potential contractors and invite them to your site. While there, review the design plan, evaluate construction access and staging areas, assess site conditions, convey your expectations, and inquire about their availability. Once you have contacted your preferred contractor, determine the project schedule, availability of materials, probable costs, and other appropriate issues prior to entering into a binding contract for services.
Procurement for construction of nature-based solutions will generally follow established transportation agency procurement methods, though there are some considerations specific to nature-based solutions that warrant discussion. One of these considerations is whether to choose a performance-based contract or a more traditional, method-based contract. Method-based contracts describe how to do the work, what materials to use, the treatments to apply, specific activities, and potentially other issues. Performance-based procurement methods focus on what the project must achieve, rather than how the contractor will achieve it.
Performance-based contracts can promote innovation in construction techniques, which is often helpful when constructing nature-based solutions. Performance-based contracts can also be helpful in developing contracts that not only include initial construction, but also maintenance. AASHTO's "Guidelines for Vegetation Management" contains procurement advice that is relevant to nature-based solutions, including information on selecting performance measures for performance-based contracts. Table 7-1 is a very brief example of what performance measures may look like for nature-based solutions.
| Activity1 | Condition Indicator | Performance Measure | Threshold2 | Acceptable3 Threshold | ||||
|---|---|---|---|---|---|---|---|---|
| A | B | C | D | E | ||||
| Vegetation Stem Density | Mean stem density for Spartina alterniflora | stems per m2 | 90 | 80 | 70 | 60 | 50 | C |
| Vegetation Stem Height | Mean stem height for Spartina alterniflora | cm | 110 | 100 | 90 | 80 | 70 | C |
| Sediment Elevation | Deviation of sediment elevation from plan (for vegetation planting) | % | ±0 | ±2 | ±4 | ±5 | ±6 | C |
| Structure Elevation | Deviation of structure elevation from plan | % | 0 | -2 | -5 | -7 | -10 | C |
1 These activity categories are provided as examples only. This is not a complete list, and some of these may not be applicable for a given project. See Section 8 for more information.
2 These threshold values are fictitious and provided as examples only. See Section 8 for more information.
3 These acceptable threshold values are assumptions and placeholders only. See Section 8 for more information. One potential complication with a performance-based contract is the amount of time that must elapse before, or in between, performance assessments. For example, if a performance standard is written for a healthy, mature marsh (to continue the example from above), then the contractor may not meet those targets for as many as 3 years following planting. In that case, a performance payment may be held back for a period that aligns with monitoring and performance assessment windows. In other words, construction contracting for nature-based solutions may require two contracts: one that pays for labor and materials, and another that pays for performance (the contractor's "fee" estimate for the work).
Full performance-based contracts can be difficult to administer because of the amount of experience required for selecting performance criteria, the availability of qualified inspectors, and an understanding that the biological and ecological elements of a nature-based solution do not always behave as expected. Alternatively, some States use selected performance measures in their methods-based contracts to reduce complexity.
Leung et al. (2018) provides a comprehensive procurement guide to nature-based solutions that transportation professionals may find helpful. Their guide outlines format and content for request for proposals (RFPs), provides sample language on nature-based solutions, and gives helpful information regarding selection criteria and the evaluation process.
This section organizes expectations into three phases of construction: the pre-construction phase, the construction phase, and the post-construction phase. Discussion of the construction phase also includes an overview of a typical construction sequence.
Pre-construction refers to the period prior to starting construction. The pre-construction phase includes the preceding project steps, such as project design and permitting. This is an excellent time to address construction-related items as well. The pre-construction phase is an opportune time to develop the monitoring and maintenance plan, prepare the site, resolve construction access issues, and develop an agreement for restoring the site to a suitable condition (Duhring 2016).
Aside from performing the construction, frequent communication between parties is a significant part of the construction phase. It is important to maintain collaboration among the contractor, design engineer/practitioner, biologists, ecologists, and other scientists (as appropriate) throughout the construction phase (O'Donnell et al. 2018).
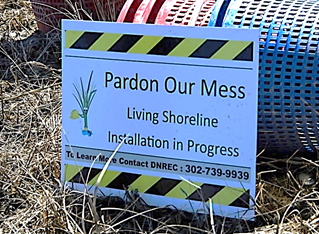
For projects in highly visible areas, communication with the public is equally important. Poor public perception or a misunderstanding of the project and the construction process can endanger project success and opportunities for future projects. The construction phase is not necessarily pleasant: It is noisy, it is disruptive, and it is dirty. Installing temporary signage during the construction process is a productive public engagement tool. For example, the Delaware Department of Natural Resources and Environmental Control (DNREC) installed the low-cost sign shown in Figure 7-1 at their project sites during the construction phase. DNREC staff believe that these signs are effective tools for public engagement and communication. The signage also provides a contact number for DNREC that the public can call for more information.
There is no uniform sequence or schedule for performing construction. However, construction projects do follow a somewhat logical progression of tasks and there are some requirements that go along with those tasks. For the purposes of this guide, we are breaking down the construction sequence into four distinct actions: plan, prepare, build, and leave. Figure 7-2 shows this sequence graphically and provides related comments for each action.
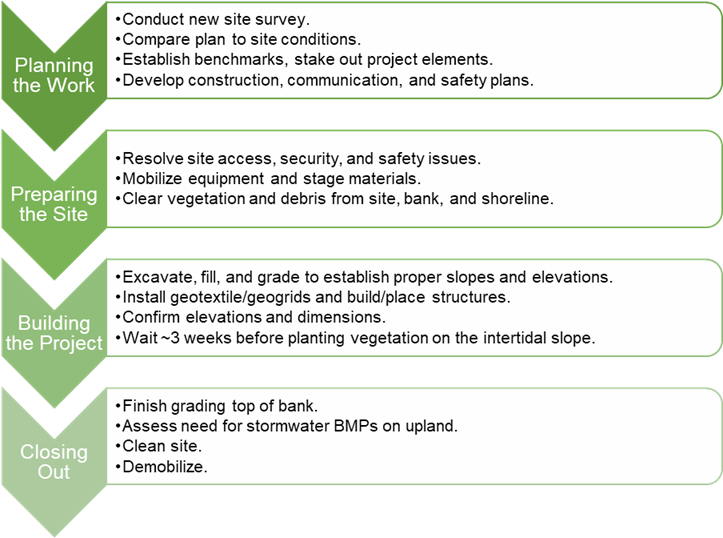
It is possible to further subdivide the third action–building the project–into distinct steps for nature-based construction. These four sequential steps convey the order in which elements of the project are constructed. Figure 7-3 shows this general four-step sequence for construction of a tidal marsh and stone sill using land-based construction methods. In this case, the contractor used some of the marsh fill to establish a bench along the shoreline from which the track-mounted excavator could reach the material pile (of riprap) and the structure site (in the water). When working from the water, construction of the sill may have been performed earlier in the project sequence, depending on the staging of materials, water depths, barge draft, or other factors.
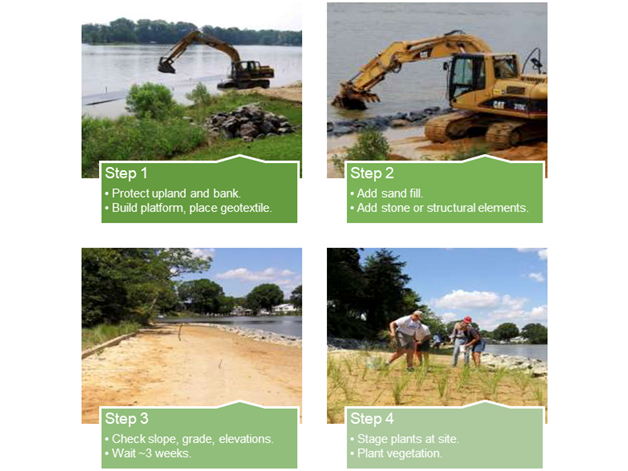
Post-construction does not mean project completion. A project is not complete until the entire scope of work is complete, and all contractual obligations are fulfilled. There are several issues to address following construction, and they are handled in the post-construction phase. The first step is to obtain an as-built, post-construction survey of your project (including biological/ecological surveys) immediately after all elements are installed. This will serve as your performance baseline for project monitoring. The contractor will sometimes request or perform an intermediate survey following the completion of structures, and/or the placement of fill material. These are often "pay quantities" in contracts; the contractor will want to ensure that they are paid for what was placed in the project area, not what was remaining after 4 weeks. This is particularly true for sand fill projects since some percentage of sand will leave the project almost immediately. Once all tasks are complete, use the as-built survey to confirm design specifications and compliance with the permitted activities (Duhring 2016).
For high-visibility projects, consider installing permanent informational and educational signage at your project site. Figure 7-4 shows an example of a large informational sign installed at a living shoreline demonstration project at Bayfront Park in Sarasota, FL. The sign introduces the living shoreline concept, its various elements, and what they provide and accomplish. The sign also has a Quick Response code that directs people to the Sarasota Bay Estuary Program website to further educate the public about living shoreline benefits.
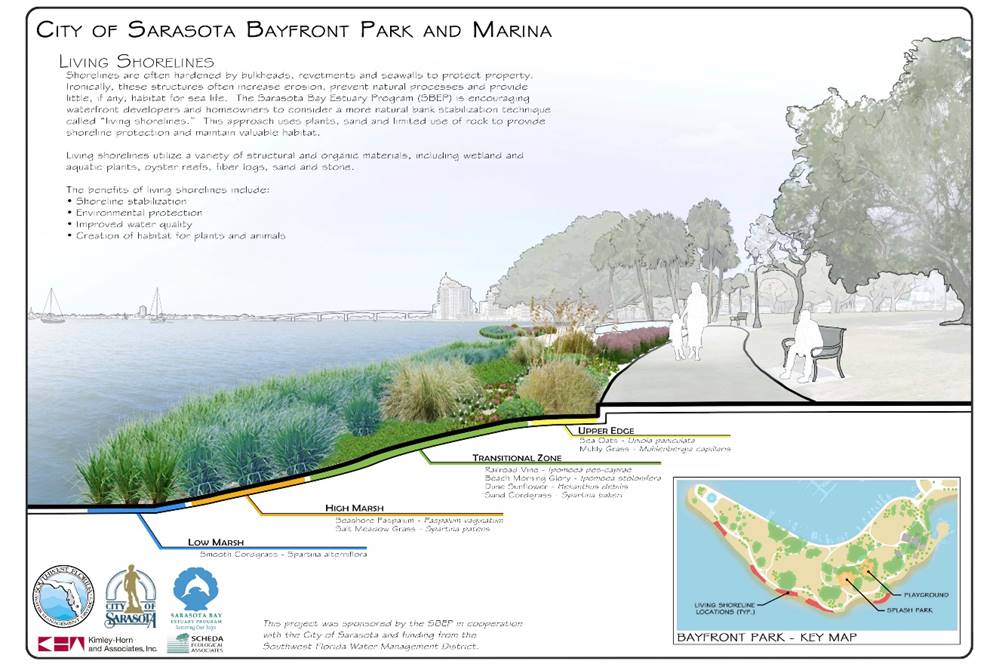
Confirm construction and site access with the contractor prior to starting work. Site access, adequate staging area, and security can delay the start of the project. Site accessibility depends on how easy and/or safe it is for the contractor to mobilize his or her equipment, crew, and materials to the project site by land or by sea. In cases where site access is particularly limited, you may have to modify your design plan based on equipment accessibility (Duhring 2016).
Construction accessibility ranges from easy to difficult to impossible (Priest 2006). Easy access means that the contractor will not need to do much, if any, clearing, grading, or grubbing to reach the site by land. By sea, easy access refers to the availability of water depths that accommodate the draft of work boats, equipment barges, and material scows. Difficult land and water access situations refer to generally difficult or adverse conditions, such as considerable site work on land and shallow drafts at sea. Impossible means that access is just that–not possible to reach (Priest 2006).
Assuming that access issues are non-existent or possible to overcome, the contractor must exercise caution using heavy machinery on the site and near the project area. It is not uncommon for heavy equipment such as excavators to sink in soft subsurface soils (Miller et al. 2015). Based on the nature of the work, heavy equipment will have to function in and around marshes; on unstable shoreline banks; on newly placed, unconsolidated materials; and/or directly in the water. The contractor must exercise caution to ensure the safety of his or her crew and equipment. The use of large timber construction mats is common on these types of construction projects and they should be used in coastal buffers and marshes (Priest 2006; Duhring 2016).
Additional considerations for long-term access should also be part of the overall project design. Most projects will require long-term access for the purpose of monitoring and maintenance (see Section 8 for more information).
There are two general construction methods for nature-based solutions: land-based construction and water-based construction. Similar types of heavy equipment are used with both methods, namely track-mounted dozers (land), long-reach excavators (land and water), and dump trucks (land). Staging of materials for land-based construction is done on the upland, whereas materials are stored on scows and moored offshore of the site for water-based work. For land-based work, the access roads and upland property must be adequate to support the weight of the equipment and materials. On the water, the depth over the full tidal cycle must accommodate the loaded draft of the equipment barge and material scows. The draft of most barges is approximately 4 feet (Miller et al. 2015). Mooring of these barges often requires coordination with USCG and your State Marine Police division.
Land-based construction of most nature-based elements is possible since the features are relatively close to the existing shoreline. There are some exceptions, however. First, if materials are transported to the site by water, then the contractor will either work from the water or spend additional time moving materials from the barges to the upland. Second, for offshore structures such as breakwaters, their distance from the shoreline is generally too great to overcome with a long-reach excavator and the work is performed on water-based platforms. Third, the contractor may elect to erect a temporary structure for the purpose of accessing offshore locations using traditional land-based methods. If large, use of the temporary structures may be prohibited by the regulatory agencies.
Construction of nature-based solutions presents interesting logistical challenges that are sometimes very difficult to overcome. There are very real physical barriers that limit your ability to do some work: the tides! Most contractors will try to perform their work during low tide if performing land-based construction. However, low tide only occurs for a few hours out of each day. In locations with very large tide ranges (e.g., Georgia, Northeast, Alaska, and others), the tide also moves swiftly and creates hazardous conditions for equipment and workers when in or near the water.
In order to maximize the availability of low-water conditions (for land-based work), marine contractors often like to begin construction during the winter months. This greatly depends on your region of the country. In the Gulf of Mexico, construction often begins between November and January, and marsh plants are installed February through May. This allows the plants to experience a few months of in-place growth prior to their first winter and prior to the most active part of the tropical cyclone season (GBF 2011). In comparison, the recommended months for planting in the Northeast are slightly later than those of the Gulf of Mexico. For projects focused on natural recruitment of oyster spat or other bivalves on reef substrate, the timing must account for the spawning cycles of target species (Miller et al. 2015).
The installation of a nature-based project could positively and negatively affect onsite and nearby habitats and species during construction activities and following project completion. Construction activities can disrupt, fragment, or destroy habitat, and noise, trampling, and the presence of humans and equipment can cause habitat or nest abandonment or failure. Consideration should be given to the breeding, nesting, spawning, and growing seasons of wildlife and plant species in order to minimize disturbance and maximize success. For example, the construction of an oyster reef that is late by 1 month can delay oyster recruitment by an entire year. Thoughtful planning can include the life cycles of species and could involve the salvage and storage of plant and soil material for later use in the project. Successful nature-based shorelines stabilize over time as plants, roots, and oyster reefs grow and sediments deposit; however, inappropriately installed fill material has the potential to bury aquatic plants and animals, and sills and breakwaters installed without appropriate consideration for nearby effects have the potential to damage nearshore habitats and species, and offshore vegetation and aquatic species.
Congratulations on the construction of your project! The prior section gave some helpful tips on construction-related issues associated with nature-based solutions. But the end of construction is not the end of your project. In fact, your project is only now beginning. This next phase of your project life cycle involves monitoring project performance and impacts, maintaining the features of your project so that they will continue to provide the expected benefits, and implementing adaptive management if or when those benefits are not realized. After reading this section, you will better understand performance monitoring requirements and methods, common maintenance issues and costs, and tips for tracking project performance.
Nature-based solutions that provide flood and/or erosion benefits will often affect aquatic resources, landforms, property values, private or public infrastructure, and local and/or regional sediment transport characteristics, as well as critical habitats (NRC 2007). Monitoring a project's performance provides an opportunity to measure and assess these impacts.
Performance monitoring provides an opportunity to assess the project against performance metrics, identify potential adaptive management needs, and refine designs for future projects. Some form of performance monitoring is required when nature-based solutions provide compensatory mitigation. Funding agencies may also require performance monitoring. This guide recommends some basic data collection and visual observation for all projects, regardless of whether it is required. Monitoring data allows the project team to determine whether the project meets performance expectations. If performance falls short of expectations, the monitoring data informs the design and implementation of corrective actions. The process of monitoring and assessing project performance is critical for the continuous improvement of nature-based solutions (Yepsen et al. 2016).
Performance monitoring is seldom uniform across projects. Monitoring type, frequency, and methods are a function of project goals and objectives, which are often unique for every nature-based project. The design and implementation of performance monitoring is guided by a monitoring plan, which requires input from both the project team (e.g., design practitioners, compliance professionals, maintenance engineers) and stakeholders (e.g., regulatory agencies, funding agencies, NGOs, public). Initiating development of the monitoring plan in the project planning phase allows practitioners and stakeholders to provide their input on the process. Starting early is important for another reason: The project design may need to incorporate access provisions, monitoring stations, work platforms, and/or monitoring measurement locations.
This guide recommends following the framework of Yepsen et al. (2016) for developing a monitoring plan. Plan development is a multi-step process. These steps are briefly described in the following sections:
Plan execution logically follows plan development. In all cases, plan execution will require dedicated annual funding for the duration of the monitoring period. Some States, such as Virginia, include permit-required performance monitoring as a line item in their biennial budgets, which provides enough funds to execute monitoring plans. In other cases, performance monitoring is paid through appropriations requests, or through grant funding.
The Yepsen et al. (2016) framework is based on two common project types: living shorelines and tidal wetland restoration. Living shorelines–a type of nature-based solution–are often smaller, more focused projects aimed at shoreline stabilization and erosion control, but they also provide co-benefits such as habitat enhancement, water quality improvement, enhanced resilience, and other ecosystem services benefits. Tidal wetland restoration is often much larger in scale and is focused on restoring the extent and/or ecological function of tidal marshes. The purpose of tidal wetland restoration is not shoreline stabilization, although it is often an indirect benefit. The restoration of tidal wetlands can lead to habitat enhancement, water quality improvements, and resilience enhancements, as well as hydrologic improvements, and socioeconomic benefits at a much larger scale than living shorelines. While there are certainly other types of projects, these are used to describe some of the goals and monitoring metrics covered below. Other large-scale project types that can improve coastal highway resilience include programmatic dune restoration and beach nourishment, mangrove restoration, maritime forest conservation, and reef (coral and/or oyster) restoration.
The project types listed previously share many of the same goals. Project goals correspond to the type of project and its primary purpose. Project goals should be SMART–specific, measurable, achievable, relevant, and time-bound–to enable assessment and implementation of corrective actions. Assessment requires comparing performance monitoring data to project goals. Corrective action occurs when the assessment reveals that a project is not meeting, or not going to meet, a specific goal within the desired timeframe.
The Yepsen et al. (2016) framework is based on five categories of goals, appearing as the first five items in the list below. Here, we include a sixth category focused on transportation, which is relevant for readers of this guide. The categories of goals are as follows:
Erosion control is a goal common to many types of nature-based solutions. The objectives of erosion control are to reduce excessive sediment inputs to adjacent waters; stabilize the bank or slope; and, in some cases, manage shoreline retreat. The goal of erosion control, and shoreline stabilization more specifically, is relevant for coastal highway infrastructure. Erosion threatens the stability of coastal highway embankments, drainage infrastructure, and bridge approaches. Shoreline retreat threatens the stability of shore- and coast-parallel highways at many locations across the United States (FHWA 2008).
Water quality improvements involve steps to reduce concentrations of nutrients, contaminants, and/or suspended solids in receiving waters. Improving water quality is an important component of section 303(d) of the Clean Water Act. Transportation organizations are familiar with section 303(d) requirements and utilize stormwater BMPs to meet water quality standards and TMDL requirements for threatened and impaired waters of the United States. Nature-based solutions can often provide the desired water quality improvements.
Habitat enhancement goals focus on restoring or improving critical or essential habitat for wildlife; ecologically important, threatened, and/or protected species; and commercially or recreationally important fisheries. Associated goals focus on increasing habitat area, abundance, biodiversity, and so forth. Habitat enhancement may not be a primary goal for transportation-oriented projects, but it can be used as part of compensatory mitigation efforts.
Hydrologic enhancement goals focus on re-establishing hydrologic (upland) and hydraulic (tidal) functions and connections that development and human modifications have altered over time. Hydrologic improvements seek to restore the extent, depth, and duration of tidal inundation. Transportation corridors along the coast have historically affected tidal bodies of water and wetlands by modifying the "hydroperiods" of tidal wetlands and other estuarine environments. The hydroperiod corresponds to daily (tidal) and seasonal patterns of water levels within a tidal marsh.
Socioeconomic enhancement goals seek to enhance environmental attributes that contribute to social and/or economic well-being. These goals are the result of improved ecological function, but require different types of data collection in order to assess performance (if so desired). Some consideration should be given to tracking social and economic co-benefits, even if they are not the primary purpose of the project; the benefits may be of sufficient magnitude to warrant assessment and may be relevant for other project partners and stakeholders.
Transportation resilience goals are not part of the Yepsen et al. (2016) framework, but are obviously relevant for transportation agencies. Appropriate transportation resilience goals might include the following:
The Yepsen et al. (2016) framework describes monitoring metrics as "... specific parameters used to assess project success and gauge attainment of project goals." Their framework considers two categories of metrics: project-type metrics associated with a specific type of restoration project, and goal-based metrics associated with the specific project goals. Project-type metrics assess the effectiveness of the restoration technique. Goal-based metrics are specific to project goals. Tracking goal-based metrics are necessary for assessing project success and developing adaptive management strategies that correct performance shortcomings.
The project- and goal-oriented metrics are further subdivided into core metrics and conditional metrics (Figure 8-1). The core concerns represent a small number of metrics that are collected on all projects of a certain type. The conditional concerns represent more specific metrics that can be assessed for all projects, but depend on the specific project site and design. Figure 8-2 provides an example of how the general hierarchy of metrics applies to a living shoreline that is used to improve water quality. Suggested core and conditional metrics are presented in Appendix C (Table 10-2 through Table 10-8), and are provided only as an illustrative example. While the tabulated metrics are appropriate for many project types and goals, the project team must carefully consider whether some are unnecessary, and if any critical metrics are missing. Table 8-1 lists some common metrics associated with the six project goals. A more complete list is found in Appendix C (Table 10-2 through Table 10-8).
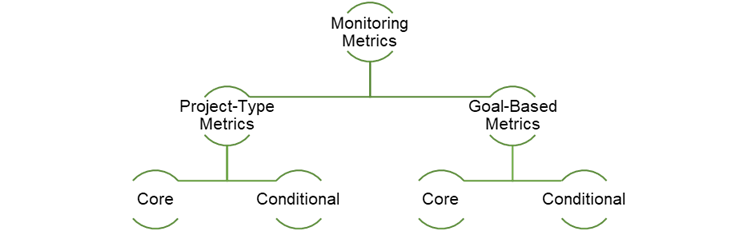
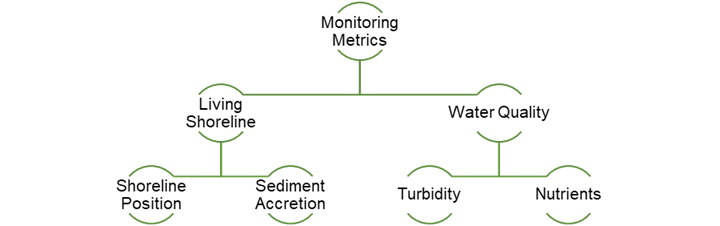
Monitoring methods represent the measurement techniques for a specific metric. Yepsen et al. (2016) suggest a range of methods, from simple to advanced, with the express goal of making performance monitoring accessible to all participants, and feasible for all projects. Many of the suggested methods are simple enough for volunteers and citizen scientists to perform. Yepsen et al. (2016) cite the value of citizen scientists at more than $20 per hour, resulting in significant cost savings and/or cost-share value. In a study published by Currin et al. (2008), volunteer data collection accounted for 223 out of 309 total worker-hours, which resulted in substantial cost savings and provided public engagement opportunities.
Transportation organizations will have in-house expertise and equipment for tackling some of the monitoring methods listed in Appendix C (Table 10-2 through Table 10-8). However, transportation professionals will require additional training and/or equipment for some of the methods. Overly complex monitoring methods may require outside help, which could come from local groups (e.g., NERRS, National Estuary Programs, coastal resource managers, local universities and their extension services).
| Goal | Sample Metrics |
|---|---|
| Erosion Control | Shoreline Position, Profile Volume, Intertidal Slope |
| Water Quality | Water Temperature, Salinity, Dissolved Oxygen |
| Habitat Enhancement | Vegetation Height, Density, Composition, Coverage, Species Biodiversity, Species Characteristics |
| Hydrologic Enhancement | Streamflow, Creek/Channel Morphology, Hydroperiod, Salinity |
| Socioeconomic Enhancement | Damages Avoided, Change in Property Value, Tourism, Fisheries Harvest |
| Transportation Resilience | Maintenance Cost and Frequency, Number of Flood Events, Number of Service Disruptions, Restoration/Recovery Time |
One of the most important monitoring protocols is also the easiest and least expensive: visual inspection of the site. Routine and preventative maintenance is as simple as visiting the site and looking for signs of trouble or distress, removing trash, clearing large debris from the wrack line, looking for signs of damage from recreational use (foot paths), inspecting the bank, noting signs of excessive erosion (vertical scarp in the bank or shoreline), and many others. Other than a bit of time and possibly a camera, the level of effort and difficulty for routine site visits is low. Also, most smartphones now have high-resolution cameras that automatically geo-reference photos when a user enables location services on their phone.
Yepsen et al. (2016) provide helpful comments regarding "additional user considerations" as they relate to the recommended monitoring methods. In addition to technical expertise, other considerations include temporal requirements for monitoring, data collection effort and investment of time, the cost of monitoring, and special cases that require permitting. Additional review of this document would provide more detailed information.
The monitoring plan documents and describes the process for measuring, assessing, and possibly tracking project performance over time. Yepsen et al. (2016) recommend implementation of the monitoring plan prior to construction. See the textbox for an example of a monitoring protocol called BACI (Before-After-Control-Impact) (Baggett et al. 2015; Yepsen et al. 2016). The plan should summarize the specific monitoring metrics and methods, experimental or data collection plans (e.g., data collection frequency, location, time of year), the specific roles and responsibilities of each person involved in implementation of the plan, the quality assurance and quality control plans, data archival and storage methods, and some indication as to how to summarize and report project performance on a continual basis. A monitoring plan of this scope is useful when developing a Quality Assurance Project Plan, which Federal agencies often require when funding projects. The monitoring plan should be able to address the questions posed in Figure 8-3.
Yepsen et al. (2016) recommend the following outline and structure for a monitoring plan:

Maintenance requirements vary by project type and setting. Projects that are more exposed to wave energy or have higher recreational uses often require more maintenance. However, successful, high-functioning projects may only require preventative maintenance. Miller et al. (2015) note that the nature-based projects that sustained the least amount of damage overall during hurricanes Irene, Lee, and Sandy were those with routine monitoring and maintenance plans in place. Some comments regarding maintenance of specific nature-based solution components are provided below.
Once established, there should be little maintenance required for living reef systems (Miller et al. 2015). Some restoration sites across the United States use stacked, bagged oyster shell as a substitute for stone in sills, toe revetments, and breakwaters. Experience has shown that the bags are susceptible to tearing/breakage, causing oyster shell to spill out. The failure of bags results in reduced crest elevation and/or a steepening of the structure side slopes. Also, loose oyster shell exposed to persistent wave action will degrade over time, resulting in very small shell fragments that easily escape their containment structures and containment bags, leading to unintended marine debris.
Beach nourishment projects will require periodic renourishment, depending on the rate of background erosion, as well as the frequency and magnitude of storm events. The use of structures in combination with beach nourishment greatly extends the life of the project and reduces renourishment requirements. Aside from renourishment activities, beaches require no routine maintenance. Like beaches, dunes may require maintenance and repair following a storm event. This would include repairing damage to a dune core (when present), reconstructing the dune, replacing dune vegetation, and repairing dune fencing (where present). Maintaining dune walkovers or dedicated footpaths is necessary for preserving dune and dune vegetation integrity.
Marsh vegetation may fail, or die off, for several reasons even when managed routinely. Some common problems are as follows:
Therefore, vegetative components of nature-based solutions tend to require the most maintenance. Just like any plant, marsh vegetation requires adequate light, water, and nutrients to maintain its productivity. Table 8-2 lists actions recommended by Duhring (2016) as part of routine and preventative marsh maintenance.
Stone structures, such as sills, breakwaters, and revetments, do not require much routine maintenance. Replacement of displaced or dislodged stones is a common form of maintenance following storm events. Adding more stones to the structure crest to maintain its design elevation can be a longer term maintenance requirement. Structure settlement and/or sea level rise may require this form of maintenance, which can be a form of adaptive management.
| Action | Comment |
|---|---|
| Remove Excess Debris and Trash | Trash degrades marsh health and water quality over time and encourages foraging. Large debris in the wrack line will damage and dislodge vegetation. |
| Replace Plugs | Newly planted marsh plugs may wash out because of excessive upland runoff or too much wave action. Replant the plug by burying it deeply in the soil. |
| Prune Shade Trees | Overhanging branches may shade marsh vegetation and reduce sunlight availability. Regularly prune branches and shade trees adjacent to the marsh. |
| Remove Non-Native and Invasive Species | Frequently remove non-native, invasive, and nuisance species as often as you see them. |
| Do Not Mow! | This should be obvious, but do not mow your marsh! |
| Avoid Chemicals | Do not apply herbicides, pesticides, or other chemicals to your marsh. Be cautious in application to adjacent upland lawns and vegetation, and protect the marsh from runoff. |
| Discourage Foraging | Animals, such as geese, love to eat marsh grass! Discourage foraging whenever possible. Movement of survey tape, affixed to stakes or nearby trees, in the wind is an effective deterrent for geese and other species. |
Routine maintenance costs for well-designed and well-built nature-based solutions should be minimal but are unlikely to be zero. It is unfair to generally state that the maintenance costs of nature-based solutions are less than those of traditional approaches (Duhring 2006). Maintenance costs and maintenance intervals vary by approach (e.g., structural, natural, nature-based, hybrid). A simple example below illustrates the concept of estimated maintenance costs for a nature-based solution and a structural feature (Beavers et al. 2016; Stamski 2005).
It is difficult to find accurate data and reports on maintenance costs for nature-based solutions. This is certainly a knowledge gap that needs to be filled through improved record keeping. Some specific values and ranges of maintenance costs are available in the literature, although they are often provided in qualitative terms (low, moderate, and high). Table 8-3 attempts to describe the annual maintenance costs and maintenance intervals, as well as replacement costs, for many of the features this guide describes. These subjective assessments are the result of synthesizing information and values given in Sutton-Grier et al. (2018), Faulkner (2010), Nichols and Brzozowski (2014), Beavers et al. (2016), Stamski (2005), and Miller et al. (2015)
| Feature | Maintenance Cost | Maintenance Interval | Replacement Cost |
|---|---|---|---|
| Bulkhead/Seawall1 | Low | Low | High |
| Revetment | Low | Low | Moderate |
| Breakwater | Low | Low | Low |
| Sill (stone) | Low | Low | Low |
| Vertical Sill (vinyl) | Low | Moderate | Moderate |
| Vertical Sill (timber) | Low | Moderate | High |
| Reefs | Low | Low | Low |
| Vegetation | Low | Moderate | Low |
| Beach Nourishment | High | Moderate | High |
| Coastal Bank2 | Moderate | Moderate | Moderate |
| Hybrid Solutions | Moderate | Moderate | Moderate |
1 Maintenance interval assumes that the project adequately meets the design conditions. Replacement cost may vary from moderate for partial replacement to high for complete replacement.
2 Refers to maintaining the bank slope and vegetation.
When executing a project, you should consider the entire life-cycle cost of resilience and mitigation measures. In doing so, the replacement cost of structural features tends to overwhelm those for nature-based solutions (Sutton-Grier et al. 2018). Successful nature-based solutions will be more self-sustaining over the long term, since the shared goal of all nature-based solutions is to restore and/or provide natural ecosystem functions. Projects used to restore natural functions face the same stresses that resulted in the degradation of the original feature. Yet, routine maintenance will help mitigate these "background" or pre-existing stresses. Projects used to provide natural function will experience both chronic stresses (e.g., lack of sediment supply, impact of adjacent projects, sea level rise) and acute impacts (e.g., coastal storms, floods, droughts, fires), and routine maintenance addresses these impacts on project performance.
Performance tracking and assessment represent opportunities to implement adaptive management practices if a project is under-performing. Tracking performance requires collecting monitoring data, generating maintenance reports, and synthesizing these sets of information in a manner that provides an assessment of performance relative to an expected goal or outcome. As mentioned previously, the goals of the project tend to fall into (broadly) one of the six categories: erosion, water quality, habitat, hydrologic, socioeconomic, and transportation. Each goal will have a quantitative measure related to performance. Some measures are defined by permitting or regulatory requirements. Stakeholders may define other measures of success. A final group of measures are the goals of the transportation organization. For example, consider this common regulatory requirement for tidal wetlands mitigation: achieve 80 percent wetland vegetative coverage by year 5. If vegetative coverage at the time of the first post-construction survey is 20 percent, then plant coverage must increase at least 12 percent per year (Year 1: 32%, Year 2: 44%, Year 3: 56%, Year 4: 68%, and Year 5: 80%). If the year 1 monitoring data show that coverage is 30%, then your coverage condition is behind schedule and you may consider some form of corrective action to increase coverage in the next growing season.
Performance monitoring data are only useful if they are used! One way to ensure that they are useful is to assess each performance goal on an annual basis, even for goals that do not have annual or interim targets. Synthesize monitoring measurements into simple tables and/or explanatory figures. It is helpful to show parameter values from each monitoring phase (pre-construction, as-built, and performance period) to compare trends to interim and end target goals. Figure 8-4 shows one such example for an assessment of restored Spartina alterniflora at three sites (DUML, NCMM, PKS) by Currin et al. (2008). The figure clearly shows the trends in mean percentage plant coverage over time at each site, the difference between the natural (control) marsh and restored (impact) marsh at each site, and the standard error for each measurement.
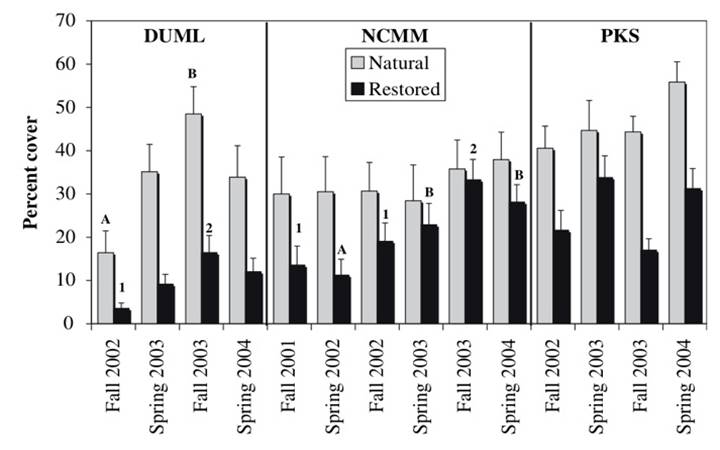
When monitoring data or observations indicate signs of trouble, try to take corrective actions as quickly as possible. Making small adjustments, through adaptive management, can aid in achieving interim and end target goals. Adaptive management acknowledges the uncertainty of natural and nature-based systems; it integrates monitoring and evaluation into an iterative decision-making process for management of the project. Incorporate results from the monitoring plan and program into subsequent planning activities to support adaptive management as a mechanism to consistently evaluate and refine plans (NRC 2007). Also, consider forward-looking adaptive management needs and opportunities. For example, will combining a structural feature with a nature-based solution provide the infrastructure resilience needed for a longer period? Or perhaps decrease the sensitivity of the infrastructure to uncertainty at future sea levels or storm frequency and magnitude? An example of proactive adaptive management is provided below.
The vegetative components of nature-based solutions are often prime candidates for adaptive management (Whalen et al. 2011), especially newly planted or distressed plants. For example, a storm event shortly following construction may remove newly planted marsh plugs and sediment from the project. Adding fill to re-establish the slope and repair low spots, and supplementing with new plugs, is the suggested form of corrective action. On the other hand, storms, strong currents, and upland runoff can deposit too much sediment that smothers marsh plants. According to Whalen et al. (2011), the subsequent change in slope and/or elevation can alter vegetative communities and sometimes facilitate the invasion of unwanted species, such as Phragmites. In that case, you may need to regrade the slope to ensure that a majority of the marsh area is below the MHW tidal datum; this discourages, but does not prevent, many nuisance plant species.
Structural components of nature-based solutions do not typically require routine maintenance, but they may require adaptive management. It may be necessary to modify the structure's design when it is not providing the expected benefits, or if it is having unintended consequences. Duhring (2016) notes that some restored tidal marshes fail because of excessively long periods of inundation associated with inadequate drainage and tidal flushing. Continuous structural enhancements that stabilize the marsh edge, such as sills, toe revetments, and edging material, have the potential to prevent drainage from the tidal marsh during the falling tide. Corrective actions, in this case, include modifying the features to promote better flushing and drainage, which may require removal or lowering of their crest elevation.
When considering how sea level rise and changes in temperature and precipitation patterns may affect coastal highway vulnerability over different timeframes, one may also need to consider similar changes in the performance, resilience, or reliability of natural features that have historically mitigated damage. For example, at what future time will an existing marsh that protects a roadway no longer be viable because of sea level rise? Answering this question provides an opportunity to support and accommodate the existing marsh for a period of time, after which alternative methods for preventing erosion and flooding will be required. Identifying so-called "tipping points" is one way to identify such opportunities.
A tipping point is defined here as a point in space, or in time, beyond which some alternative approach is required. Consider a marsh in front of a causeway. Assuming that the causeway is fixed in space with a set elevation that cannot be changed, sea level rise will impede migration of the marsh. Over time, the marsh will drown in place. At a specific elevation, the marsh will no longer provide protection for the causeway, and the road will experience flooding–first from wave runup and overtopping during storms because of the lack of wave attenuation by the marsh, then possibly during very high astronomical tides, and sometime later under daily high tides. That specific elevation is the tipping point and it may occur at different times in the future under various sea level rise projections. Implementation of a structural (e.g., roadway modification) or policy solution, before reaching that tipping point, could address the roadway's increasing vulnerability to flooding.
The "Living Shoreline Along Coastal Roadways Exposed to Sea Level Rise" case study provides an example of a tipping point analysis for a coastal roadway along Mount Sinai Harbor on Long Island, NY (FHWA 2016b). The study describes when, and potentially how, the use of structural and long-term management options can enhance the nature-based resilience provisions of a constructed tidal marsh. The roadway's existing elevation (+6 feet NAVD88) will prevent daily, high-tide flooding until 2065 under a higher sea level rise scenario (Figure 8-5). The road does experience flooding now under minor, but frequent, storm events (e.g., 1-year and 2-year return periods). Frequent wave-induced flooding (i.e., wave overtopping) may occur as early as 2025 without intervention. The proposed intertidal marsh with toe protection, represented in cross-section in Figure 8-6 and planform in Figure 8-7, delays the onset of wave-induced flooding by about 40 years, at which time the road experiences the daily flooding mentioned earlier. Prior to reaching those tipping points of elevation (+6 feet NAVD88 and/or 2065), implementation of a structural feature or strategy will similarly delay the onset of daily flooding. Potential solutions include raising the roadway elevation or adding a parapet wall along the edge of the pavement. Increasing either elevation by +1 foot or +2 feet delays the onset of daily flooding to 2080 and 2095, respectively.
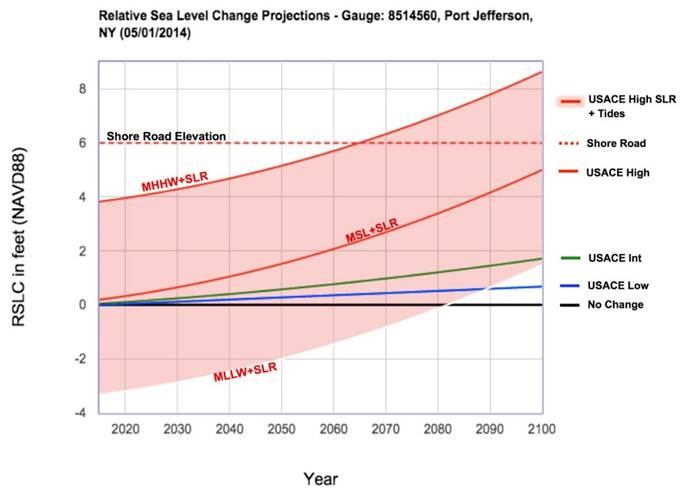
Figure 8-5. Relative sea level projections for three scenarios from 2015 to 2100 (FHWA 2016b).
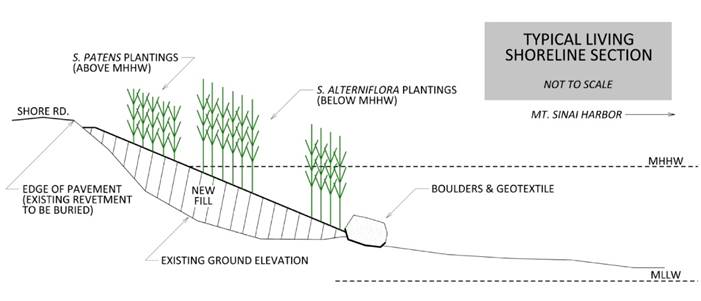
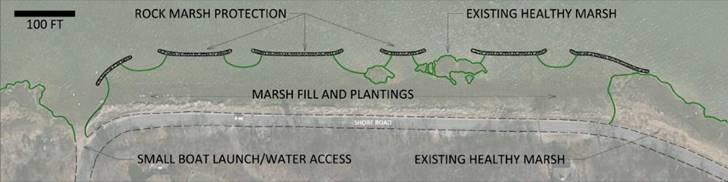
Nature-based solutions can play an important role within a systems-based approach to mitigating extreme weather risks for highways in the coastal environment. Either independently or when used in combination with policy measures and/or structural features, nature-based solutions simultaneously provide risk-reduction, ecological, water quality, and recreational benefits to transportation agencies and the broader community.
Incorporating nature-based solutions into coastal highway planning and design can increase resilience to a broad spectrum of coastal hazards that are known to disrupt or damage transportation infrastructure. Examples highlighted in this document include storm flooding, wave damage, erosion, and shoreline retreat. Many of the over 60,000 miles of coastal highways in the United States are exposed to and occasionally experience these types of hazards. The vulnerability of these coastal highway miles may increase over time with future sea level rise. By embracing the dynamic design of nature-based solutions, their adaptive capacity can serve to mitigate some of these hazards in a manner that can be self-sustaining if properly designed.
Transportation organizations will not always be able to implement nature-based solutions on their own. To overcome this obstacle, transportation organizations need to develop partnerships with other Federal and State agencies, as well as NGOs, who plan, fund, design, and implement nature-based solutions. Through collaboration and cooperation, these partnerships can lead to the development of agreements and an appropriate accounting of benefits that broaden funding sources and improve the likelihood of implementation. Partnerships also enable larger, landscape scale nature-based solutions, including areas outside of highway right-of-way. Larger scale solutions can provide higher levels of protection. Given that many transportation organizations lack the in-house expertise to design nature-based solutions, these partnerships play a crucial role in identifying the appropriate subject matter experts for implementing these projects.
This guide describes some common nature-based solutions and provided a few design examples with unique characteristics from different regions of the United States. While each of these solutions is somewhat unique, they all seek to address the site-specific conditions and project-specific needs while mimicking the local coastal ecology and geology. Do not misinterpret the examples in this guide as the "only" nature-based solutions. It is important to develop a somewhat broad interpretation of that terminology so that possible project alternatives are not overly constrained. Working with the local, State, university, NGO, and Federal partners can help frame the suite of nature-based solutions and identify additional implementation guidance that is most appropriate for your region.
Section 4.1 describes the key site characterization parameters to consider at the desktop analysis and extended analysis or site visit phases of a nature-based project. Table 10-1 provides a list of tools and other resources to assist in gathering the information needed to describe each of those parameters.
| Parameter Name | Site Characterization Tools & Resources | ||
|---|---|---|---|
| Desktop Analysis | Extended Analysis | ||
| System | Shoreline Type | Historical aerial imagery, online image servers/software (e.g., Google Earth™1) | Site visit, review of historical maps |
| Infrastructure | GIS, transportation inventory data, National Bridge Inventory | Site visit, maintenance and repair records, design details | |
| Erosion Rate | Historical aerial imagery, shoreline positions, LiDAR data, NOAA Digital Coast https://coast.noaa.gov/digitalcoast/ | Site visit, conduct interviews, consult historical maps and charts | |
| Sea Level Rise | Evaluate historical values: https://tidesandcurrents.noaa.gov/sltrends/sltrends.html Consider future scenarios: http://corpsmapu.usace.army.mil/rccinfo/slc/slcc_calc.html https://coast.noaa.gov/digitalcoast/tools/flood-exposure.html https://coast.noaa.gov/slr/#/layer/slr |
||
| Tide Range | Nearby tide station (https://tidesandcurrents.noaa.gov), NOAA VDatum tool (https://vdatum.noaa.gov/) | Measure at site; numerical modeling of tides in project area | |
| Hydrodynamic | Wind Waves (Fetch) | Use parametric wind-wave equations in USACE (2002) and/or FHWA (2008). Use the CHS database (USACE 2019d). | Collect wave measurements at the site. Perform numerical modeling of waves. |
| Boat Wakes | Unreliable. Assume a depth-limited wave height for conceptual design (FHWA 2008). | Collect wake measurements at site. | |
| Currents | Limited. Use operational forecast model data, near real-time measurements, or the CHS database (USACE, 2019b). https://tidesandcurrents.noaa.gov/forecast_info.html, https://ioos.noaa.gov/ |
Collect measurements at site. Perform numerical modeling of tidal currents. | |
| Ice | Limited. Evaluate online resources. https://www.natice.noaa.gov/index.html, https://icejam.sec.usace.army.mil |
Measure typical ice thickness and assess coverage and persistence at site. | |
| Storm Surge | Review return period surge elevations in latest FEMA Flood Insurance Study report. Consult online resources from NOAA (2018), USACE (2019d). | Numerical modeling of storm surge and/or wave runup and overtopping, as appropriate. See FHWA (2014), Webb (2017). | |
| Terrestrial | Upland Slope (V:H) | Use LiDAR data, digital elevation models, existing site survey data, etc. Search NOAA Digital Coast for elevation data. https://coast.noaa.gov/digitalcoast/ | Perform traditional site survey using rod and level, total station, or GPS. |
| Shoreline Slope | Same as for upland slope. Be cautious regarding data limitations, especially in regions with large tide ranges. | Perform wading survey using appropriate methods. | |
| Width | Imagery, maps, GIS tools, and/or tools such as Google Earth™ | Measure at site. Large areas may require a boat or vessel, total station, GPS, and/or depth measurement capabilities. | |
| Nearshore Slope | Use existing digital elevation models and/or bathymetric datasets, where available. Approximate from nautical charts if digital data are unavailable. https://coast.noaa.gov/digitalcoast/, https://charts.noaa.gov/ChartCatalog/MapSelect.html |
Perform a bathymetric survey using a vessel and appropriate depth-sounding instruments and a GPS for positioning. | |
| Water Depth | Same as for nearshore slope. | Same as for nearshore slope. | |
| Soil Strength | Limited. Search for soil maps, boring logs, sediment analyses, sand characterization data, dredge records, etc. | Collect measurements at the site. Obtain sediment cores (borings) for laboratory testing. Perform cone penetrometer or vane shear stress test in the field. | |
| Ecological | Water Quality | Online resources, including NOAA, USGS, and State agencies responsible for water quality. https://tidesandcurrents.noaa.gov/met_info.html https://ioos.noaa.gov/https://maps.waterdata.usgs.gov/mapper/index.html |
Collect measurements at the site using handheld devices or collect samples for laboratory testing. |
| Soil Type | Same as soil strength. | Collect measurements at the site and send to laboratory for evaluation and granulometric analysis. | |
| Sunlight Exposure | Limited. Consider using historical aerial imagery, online image services, or tools such as Google Earth™ or https://www.suncalc.org | Conduct site visit during spring, summer, or fall when vegetation is mature. Assess exposure conditions and plant conditions. | |
| Salinity | Same as for water quality. | Same as for water quality. | |
1 Be cautious when using aerial imagery to assess shoreline position or rates of erosion. The time of year (season) and the tide stage greatly affect interpretation of shoreline position.
Figure 10-1–Figure 10-4 are suggested decision trees for determining possible resilience strategies for coastal highways exposed to flood, erosion, and/or wave hazards. These decision trees include policy, nature-based, and structural approaches. The decision trees lead to an approach based on site constraints and vulnerability. For nature-based solutions, an appropriate strategy will also depend on the hazard and site characteristics. These decision trees are adaptable to various regions or problems by altering the recommendations in the white boxes.
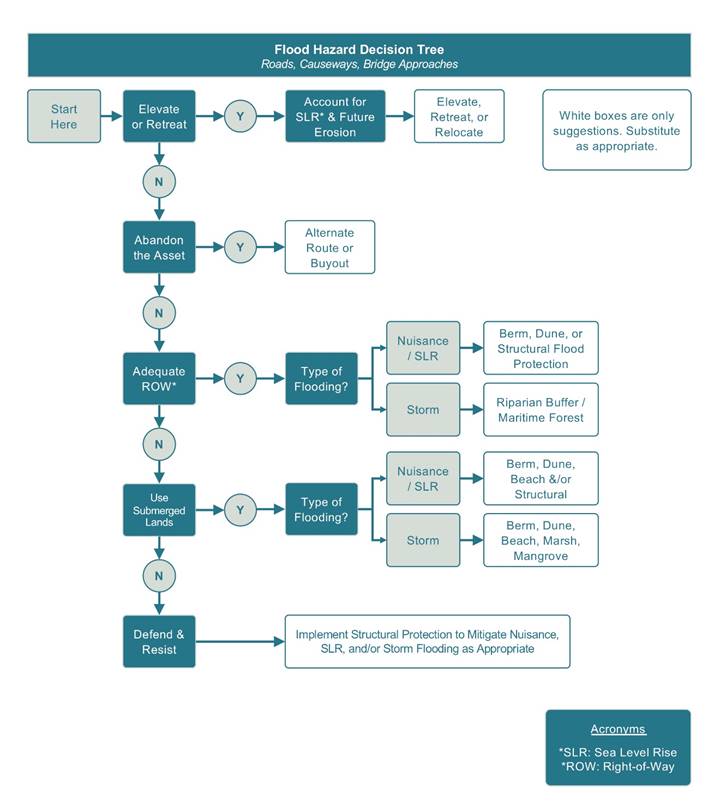
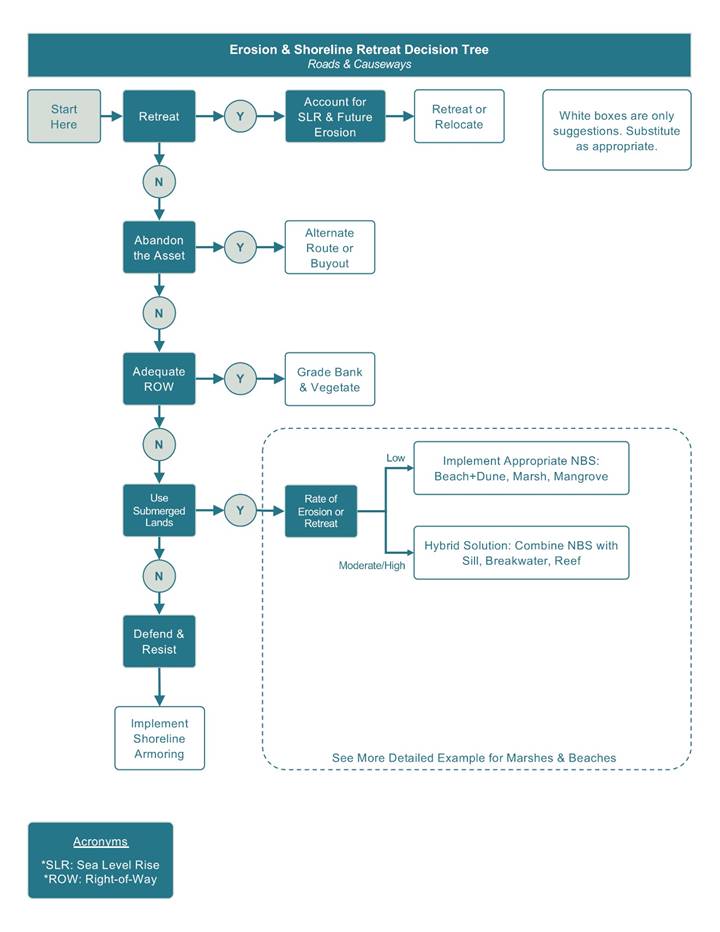
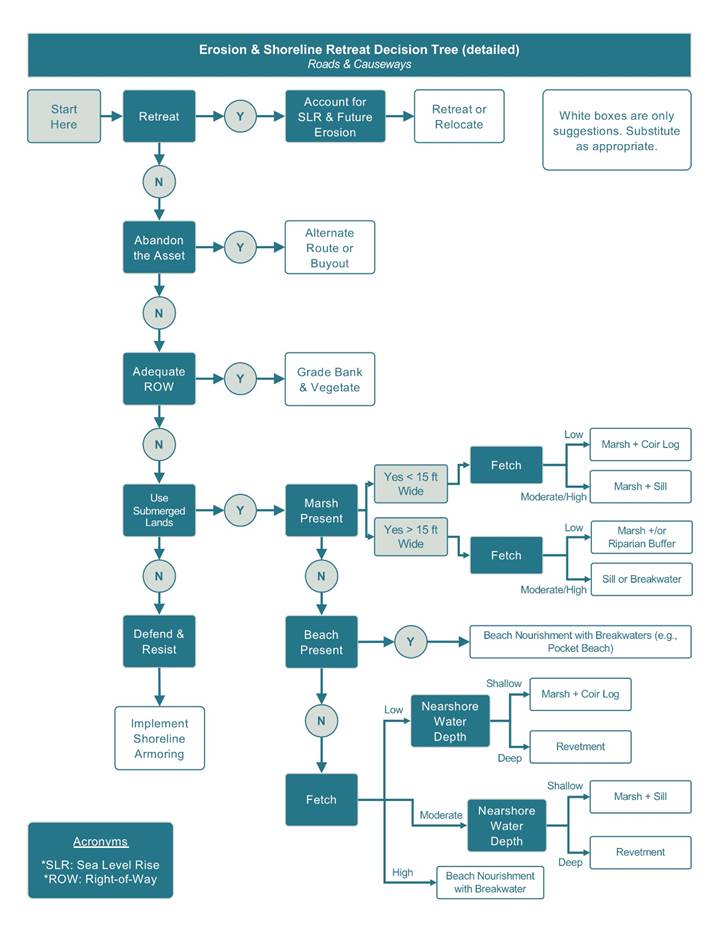
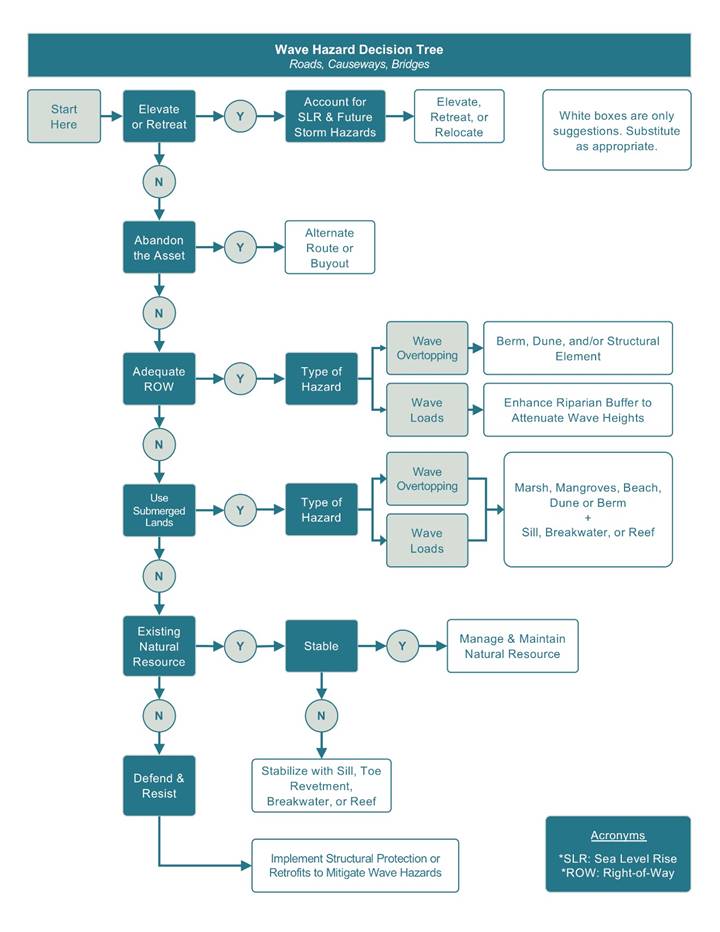
This appendix provides tables of potential monitoring performance metrics, as developed by Yepsen et al. (2016).
| Class | Metric categories | Method options | Additional user considerations |
|---|---|---|---|
| Core | Position of living shoreline structure AND Lateral Position of Shoreline (i.e., horizontal change, erosion) | RTK GPS (m/y) | Technical expertise; cost/expense; specialized equipment |
| Aerial photograph (m/y) | Technical expertise; temporal requirements; cost/expense; specialized equipment | ||
| Surveying Instrument (barcode leveling) | Technical expertise; cost/expense; specialized equipment | ||
| Distance from installed post or perm structure | Suited for all user groups | ||
| LiDAR | Technical expertise; cost/expense; specialized equipment | ||
| Vegetation Structure | Horizontal vegetative obstruction | Temporal requirements; specialized equipment | |
| Vertical light attenuation | Temporal requirements; specialized equipment | ||
| Cover per m2 | Suited for all user groups; temporal requirements | ||
| Number of stems per m2 | Temporal requirements; collection time investment | ||
| Structural integrity of materials (e.g. how well is the breakwater holding together) | Observation | Suited for all user groups | |
| Photograph (fixed point) | Suited for all user groups | ||
| Conditional | Sediment capture/ accretion | Sedimentation disc/tile/plate/ marker horizon | Cost/expense (for some methods); temporal requirements; specialized equipment (for some methods) |
| Measuring stick | Suited for all user groups | ||
| Wave energy or height and amplitude (wind/wake) | Gauges and Buoys (e.g., Acoustic Doppler Current Profilers) |
Technical expertise; cost/expense; collection time investment; specialized equipment | |
| Water level loggers | Technical expertise; cost/expense; temporal requirements; specialized equipment | ||
| Graduated rod | Temporal requirement; collection time investment | ||
| Plaster or gypsum ball/ clod card dissolution | Technical expertise; temporal requirements; collection time investment; specialized equipment | ||
| Vegetation Productivity | Biomass (above and/or belowground) | Technical expertise; temporal requirements; collection time investment; cost/expense; specialized equipment | |
| Vegetation Community Composition | List of species found at site | Suited for all user groups; temporal requirements | |
| Nuisance species | Cover per m2, Stem counts per m2, or presence/absence | Suited for all user groups; temporal requirements | |
| Observation of grazing or other disturbance | Suited for all user groups | ||
| Debris | Observation | Suited for all user groups | |
| Target species (e.g. Oysters...) | See habitat/ biodiversity goal table | ||
| Elevation (i.e. Vertical change): of the shoreline | RTK GPS (m/y) | Technical expertise; cost/expense; specialized equipment | |
| Lidar | Technical expertise; cost/expense; specialized equipment | ||
| Laser level height relative to position on permanent post or other structure | Cost/expense; specialized equipment | ||
| Thermal imaging | Technical expertise; temporal requirements; collection time investment; cost/expense; specialized equipment | ||
| Surveying Instrument (barcode leveling) | Technical expertise; cost/expense; specialized equipment | ||
| Foreshore slope | RTK GPS (m/y) | Technical expertise; cost/expense; specialized equipment | |
| Lidar | Technical expertise; cost/expense; specialized equipment | ||
| Laser level height relative to position on permanent post or other structure | Cost/expense; specialized equipment | ||
| Thermal imaging | Technical expertise; temporal requirements; collection time investment; cost/expense; specialized equipment | ||
| Surveying Instrument (barcode leveling) | Technical expertise; cost/expense; specialized equipment | ||
| Planted species (e.g. Mussels or vegetation) | Percent survival (of all if small area or quadrat samples if large area) | Suited for all user groups | |
| Socioeconomic | Difference in cost between hardened structure and a living shoreline ($) | Data collection method: Project budgets and existing data sources; Analysis method: substitute cost method | Technical expertise and specialized software needed. If using a BACI design, may require a large collection time investment (need to wait several years to have enough weather events to compare changes in damage per storm over time). |
| Cost-effectiveness of structure for shoreline stabilization (rate of erosion reduction per unit cost) | Data collection method: Project budgets; Analysis method: Cost effectiveness analysis | Technical expertise and specialized software needed. If using a BACI design, may require a large collection time investment (need to wait several years to have enough weather events to compare changes in damage per storm over time). | |
| Number of homes or structures benefitting (#) | Data collection methods: visual assessment or GIS analysis | Some technical expertise needed; may require additional collection time. | |
| Public awareness of living shorelines | Data collection methods: Surveys; focus group meetings; Analysis methods: NA | Note that the value placed on individual experience represents the social value of the visitor experience, or the value beyond the actual amount spent. Some technical expertise needed; may require additional collection time. |
| Class | Metric categories | Method options | Additional user considerations |
|---|---|---|---|
| Core | Elevation | RTK GPS | Technical expertise; cost/expense; specialized equipment |
| Surface elevation table | Technical expertise; temporal requirements; collection time investment; cost/expense; specialized equipment | ||
| Surveying Instrument (barcode leveling) | Technical expertise; cost/expense; specialized equipment | ||
| Lidar | Technical expertise; cost/expense; specialized equipment | ||
| Laser level height relative to position on permanent post or other structure | Suited for all user groups | ||
| Vegetation structure | Horizontal vegetative obstruction | Temporal requirements; specialized equipment | |
| Vertical light attenuation | Temporal requirements; specialized equipment | ||
| Cover per m2 | Suited for all user groups; Temporal Requirements | ||
| Stem heights | Collection time investment; temporal requirements | ||
| Number of stems per m2 | Collection time investment; temporal requirements | ||
| Habitat Type %, 50m Radius (e.g., High marsh, low marsh, invasives, pannes and pools etc.) | Collection time investment; temporal requirements | ||
| Vegetation community composition and diversity | List of species (plants) | Suited for all user groups, Temporal Requirements | |
| Conditional | Hydroperiod (i.e. Flood duration) | Water level loggers | Technical expertise; cost/expense; temporal requirements; specialized equipment |
| Vegetation productivity | Biomass (above and/ or belowground) | Technical expertise; temporal requirements; collection time investment; cost/expense; specialized equipment | |
| Photograph (fixed point) | Suited for all user groups; Temporal Requirements | ||
| Plant tissue nutrient analysis (C/N) | Technical expertise; temporal requirements; collection time investment; cost/expense; specialized equipment | ||
| Vegetation productivity (cont.) | LANDSAT/infrared imagery | Technical expertise; temporal requirements; collection time investment; cost/expense; specialized equipment | |
| Number of stems per m2 and stem height of dominant species | Suited for all user groups; Temporal Requirements; Collection Time Investment | ||
| Sediment capture (e.g. Capture, accretion) | Sedimentation disc/tile/ feldspar marker horizon | Cost/Expense (for some methods); Temporal Requirements; Specialized Equipment (for some methods) | |
| Measuring stick | Suited for all user groups | ||
| Sediment supply (e.g. TSS) | Filtration | Technical expertise; cost/expense; temporal requirements; specialized equipment | |
| Turbidity meter | Cost/expense; specialized equipment | ||
| Secchi disc | Suited for all user groups | ||
| Erosion rate/ shoreline position | RTK GPS (m/y) | Technical expertise; cost/expense; specialized equipment | |
| Aerial photograph (m/y) | Technical expertise; temporal requirements; cost/expense; specialized equipment | ||
| Surveying Instrument (barcode leveling) | Technical expertise; cost/expense; specialized equipment | ||
| Distance from installed post or permanent structure to shoreline (m/y) | Suited for all user groups | ||
| Lidar | Technical expertise; cost/expense; specialized equipment | ||
| Aerial photographs (GIS analysis) | Technical expertise; temporal requirements; cost/expense; specialized equipment | ||
| Foreshore slope | RTK GPS (m/y) | Technical expertise; cost/expense; specialized equipment | |
| Lidar | Technical expertise; cost/expense; specialized equipment | ||
| Laser level height relative to position on permanent post or other structure | Cost/expense; specialized equipment | ||
| Filtration | Technical expertise; temporal requirements; collection time investment; cost/expense; specialized equipment | ||
| Surveying Instrument (barcode leveling) | Technical expertise; cost/expense; specialized equipment | ||
| Drainage density/ position | Aerial photographs (GIS analysis) | Technical expertise; temporal requirements; cost/expense; specialized equipment | |
| RTK GPS | Technical expertise; cost/expense; specialized equipment | ||
| Survival of planted species | Percent survival (all if small area or quadrat samples if large area) | Suited for all user groups | |
| Nuisance species (e.g. Invasives, herbivory) | Cover per m2, number of stems per m2, or presence/absence | Suited for all user groups; Temporal Requirements | |
| Observation of grazing and other disturbance | Suited for all user groups; Temporal Requirements | ||
| Debris | Observation | Suited for all user groups | |
| Target habitat: salinity | Refractometer | Specialized equipment | |
| Meter (total dissolved solids) | Cost/expense/ specialized equipment | ||
| Socioeconomic | Damage costs avoided to surrounding homes ($) | Data collection method: Surveys; existing data sources; Analysis method: Avoided cost method; HAZUS modeling or other modeling that simulates changes in flood levels | Technical expertise and specialized software needed. If using a BACI design, may require a large collection time investment (need to wait several years to have enough weather events to compare changes in damage per storm over time). |
| Damage costs avoided to surrounding structures, roads or other public infrastructure ($) | Data collection method: Surveys; existing data sources; Analysis method: Avoided cost method; HAZUS modeling or other modeling that simulates changes in flood levels | Technical expertise and specialized software needed. If using a BACI design, may require a large collection time investment (need to wait several years to have enough weather events to compare changes in damage per storm over time). | |
| Spending by birders ($) | Data collection methods: surveys; existing data sources; Data analysis methods: Economic impact assessment | Some technical expertise needed; may require additional collection time. | |
| Value of visitors place on the improved water quality (boaters, anglers, beach visitors, etc.) ($) | Data collection methods: surveys; existing data sources; Data analysis methods: Contingent valuation or choice experiment | Note that the value placed on individual experience represents the social value of the visitor experience, or the value beyond the actual amount spent. Some technical expertise needed; may require additional collection time. |
| Class | Metric categories | Method options | Additional User Considerations |
|---|---|---|---|
| Core | Lateral position or shoreline or Erosion (i.e., horizontal change) of the shoreline (m/year) | RTK GPS | Technical expertise; cost/expense; specialized equipment |
| Aerial photograph | Technical expertise; cost/expense; specialized equipment | ||
| Lidar | Technical expertise; cost/expense; specialized equipment | ||
| Surveying Instrument (barcode leveling) | Technical expertise; cost/expense; specialized equipment | ||
| Distance from permanent post of other structure to shoreline | Suited for all user groups | ||
| Elevation of shoreline (m/year) | Rtk gps | Technical expertise; cost/expense; specialized equipment | |
| Lidar | Technical expertise; cost/expense; specialized equipment | ||
| Surveying Instrument (barcode leveling) | Technical expertise; cost/expense; specialized equipment | ||
| Laser level height relative to position on permanent post or other structure | Cost/expense; specialized equipment | ||
| Foreshore slope | Rtk gps | Technical expertise; cost/expense; specialized equipment | |
| Lidar | Technical expertise; cost/expense; specialized equipment | ||
| Laser level height relative to position on permanent post or other structure | Cost/expense; specialized equipment | ||
| Thermal imaging | Technical expertise; temporal requirements; collection time investment; cost/expense; specialized equipment | ||
| Surveying Instrument (barcode leveling) | Technical expertise; cost/expense; specialized equipment | ||
| Conditional | Accretion (m/year) | Sedimentation disc/tile/plate/ marker horizon | Cost/Expense (for some methods); temporal requirements; specialized equipment (for some methods) |
| Measuring stick | Suited for all user groups | ||
| Wave energy or height and amplitude (wind/wake) | Gauges and buoys (e.g., acoustic doppler current profilers for wave energy and stream/ creek flow) | Technical expertise; cost/expense; collection time investment; specialized equipment | |
| Water level loggers | Technical expertise; cost/expense; temporal requirements; specialized equipment | ||
| Graduated survey rod | Temporal requirement; collection time investment | ||
| Plaster or gypsum ball/ clod card dissolution | Technical expertise; temporal requirements; collection time investment; specialized equipment | ||
| Vegetation Structure | Horizontal vegetative obstruction | Temporal requirements; specialized equipment | |
| Vertical light attenuation | Temporal Requirements; Specialized Equipment | ||
| Cover per m2 | Suited for all user groups; Temporal Requirements | ||
| Number of stems per m2 | Temporal Requirements; Collection Time Investment | ||
| Vegetation Productivity | Biomass (above and/ or belowground) | Technical Expertise; Temporal Requirements; Collection Time Investment; Cost/Expense; Specialized Equipment | |
| Socioeconomic | Change in property value because of reduction in rate of erosion ($) | Data collection method: Existing data sources; Analysis method: Hedonic valuation | Technical expertise needed. |
| Difference in cost between hardened structure (e.g. bulkhead) and a living shoreline ($) | Data collection method: Project budgets and existing data sources; Analysis method: substitute cost method | Little technical expertise required; this method is suited for most user groups. | |
| Number of homes or structures benefitting (#) | Data collection methods: visual assessment or GIS analysis; Analysis method: NA | Suited for all user groups. Note that this metric only shows number, not the magnitude of the benefit. |
| Class | Metric categories | Method options | Additional user considerations |
|---|---|---|---|
| Core | Vegetation community composition and diversity | List species found at site (plants) | Suited for all user groups; temporal requirements |
| Vegetation Structure | Horizontal light obstruction | Temporal requirements; specialized equipment | |
| Vertical light attenuation | Temporal requirements; specialized equipment | ||
| Cover per m2 (for each plant species or total cover by plant species) | Suited for all user groups; temporal requirements | ||
| Stem heights of dominant species | Temporal requirements; collection time investment | ||
| Number of stems per m2 | Temporal requirements; collection time investment | ||
| Habitat Type %, 50m Radius (e.g., High marsh, low marsh, invasives, pannes and pools etc.) | Temporal requirements; collection time investment | ||
| Photographs (fixed point) | Suited for all user groups; temporal requirements | ||
| Conditional | Target species for restoration (e.g. black duck or oysters) or biodiversity | Observations (e.g., horseshoe crabs, terrapins) | Suited for all user groups; temporal requirements |
| Biomass (wet weight or dry weight/ m2) (e.g., plants, nekton, mussels) | Technical expertise; temporal requirements; collection time investment; cost/expense; specialized equipment; permitting requirements | ||
| Cover per m2 or # per m2 (e.g., percent cover of SAV, # of fiddler crab boroughs, # of fish in a sample, Ribbed mussel lip counts) | Suited for all user groups; temporal requirements | ||
| Target species for restoration (e.g. black duck or oysters) or biodiversity (cont.) | Morphometric (e.g., length of nekton or oysters) | Technical expertise; temporal requirements; collection time investment; cost/expense; specialized equipment; permitting requirements | |
| Health (e.g., condition index, of bivalves) | Technical expertise; temporal requirements; collection time investment; cost/expense; specialized equipment; permitting requirements | ||
| List of species found at site (e.g., nekton or benthic infauna) | Suited for all user groups; temporal requirements | ||
| Recruitment (e.g., oysters) | Suited for all user groups; temporal requirements | ||
| Feeding and breeding behavior (for avian target species) | Technical expertise; temporal requirements; collection time investment; permitting requirements | ||
| Soil texture | Grain size and soil type analysis | Technical expertise; collection time investments; cost/expense; specialized equipment | |
| Belowground stability | Shear vane strength | Technical expertise; cost/expense; specialized equipment | |
| Bearing capacity | Specialized equipment | ||
| Vegetation productivity | Photograph (fixed point) | Suited for all user groups; temporal requirements | |
| Plant tissue nutrient analysis (C/N) | Technical expertise; temporal requirements; collection time investment; cost/expense; specialized equipment | ||
| LANDSAT/infrared imagery | Technical expertise; temporal requirements; collection time investment; cost/expense; specialized equipment | ||
| Biomass (above and/or belowground) | Technical expertise; temporal requirements; collection time investment; cost/expense; specialized equipment | ||
| Number of stems per m2 and stem height of dominant species | Collection time investment; temporal requirements | ||
| Salinity | Refractometer | Specialized equipment | |
| Meter (total dissolved solids) | Cost/expense; specialized equipment | ||
| Dissolved oxygen | Meter (total dissolved oxygen) | Cost/expense; specialized equipment | |
| Area of habitat | GPS | Cost/expense; specialized equipment | |
| Aerial photography | Technical expertise; temporal requirements; cost/expense; specialized equipment | ||
| Nuisance species | Number of stems per m2 | Collection time investment; temporal requirements | |
| Cover per m2 | Suited for all user groups; Temporal Requirements | ||
| Presence/absence | Suited for all user groups; Temporal Requirements | ||
| Inhibition of fauna movement | Observations | Suited for all user groups; Temporal Requirements | |
| Socioeconomic | Economic impact of ecotourism ($) | Data collection methods: surveys; existing data sources; Data analysis methods: IMPLAN or other regional economic modeling, such as input/output models | Technical expertise and specialized software needed; only relevant for large enough projects to have a meaningful impact; if existing data sources are not available, may require additional collection time. |
| Spending by birders ($) | Data collection methods: surveys; existing data sources; Data analysis methods: Economic impact assessment | Some technical expertise needed; may require additional collection time. | |
| Revenues for commercial fisherman ($) | Data collection methods: surveys; interviews; existing data sources; Data analysis methods: Partial budget analysis | Some technical expertise needed; only relevant for large enough projects to have a meaningful impact. | |
| Value visitors to the site place on their experience ($) | Data collection methods: surveys; existing data sources; Data analysis methods: Contingent valuation or choice experiment | Note that the value placed on individual experience represents the social value of the visitor experience, or the value beyond the actual amount spent. Some technical expertise needed; may require additional collection time. | |
| Number of students benefiting from environmental education/research (#) | Data collection methods: Surveys; Focus group meetings; Tracking with a log; Data analysis methods: NA | Suited for all user groups. |
| Class | Metrics: Target water quality parameter- select one or more based on project goals | Method options | Additional user considerations |
|---|---|---|---|
| Conditional | Dissolved Oxygen | Meter (DO) | Cost/expense; specialized equipment |
| Titration kit | Cost/expense; specialized equipment | ||
| Winkler titration | Technical expertise; cost/expense; temporal requirements; specialized equipment | ||
| Turbidity | Meter (turbidity) | Cost/expense; specialized equipment | |
| Clarity tube | Suited for all user groups | ||
| Secchi disc | Suited for all user groups | ||
| Sediment supply / total suspended solids | Filtration | Technical expertise; cost/expense; temporal requirements; specialized equipment | |
| Nutrients nitrate, nitrite, ammonia | Filtration (lab tests TKN, etc.) | Technical expertise; cost/expense; temporal requirements; specialized equipment | |
| Laboratory Analysis | Technical expertise; cost/expense; temporal requirements; specialized equipment | ||
| Colorimeter | Technical expertise; cost/expense; temporal requirements; specialized equipment | ||
| Water - bacteria | Lab analysis (CFUs) | Technical expertise; cost/expense; temporal requirements; specialized equipment | |
| Nutrients: phosphates | Lab analysis | Technical expertise; cost/expense; temporal requirements; specialized equipment | |
| Ph | Titration kits | Cost/expense; specialized equipment | |
| Colorimeter | Cost/expense; specialized equipment | ||
| Meter (pH) | Specialized equipment | ||
| Salinity | Refractometer | Specialized equipment | |
| Meter (total dissolved solids) | Cost/expense; specialized equipment | ||
| Algal bloom | Chl a tests (lab or sensor) | Technical expertise; cost/expense; temporal requirements; specialized equipment | |
| Water BOD | Dilution method EPA method 5210B | Technical expertise; cost/expense; temporal requirements; specialized equipment | |
| Pollutants | Manometric method | Technical expertise; cost/expense; temporal requirements; specialized equipment | |
| Temperature | Meter | Cost/expense; specialized equipment | |
| Thermometer | Suited for all user groups | ||
| Potential socioeconomic metrics | Number of beach closing days (#) | Data collection method: existing data sources; analysis method: NA | Suited for all user groups. |
| Value of visitors place on the improved water quality (boaters, anglers, beach visitors, etc.) ($) | Data collection methods: surveys; existing data sources; data analysis methods: contingent valuation or choice experiment | The value placed on individual experience represents the social value of the visitor experience, or the value beyond the actual amount spent. Some technical expertise needed; may require additional collection time. | |
| Number of shellfisheries closing days (#) | Data collection method: existing data sources; analysis method: NA | Suited for all user groups. | |
| Delisting of a waterway from EPA 303d | Data collection method: existing data sources; analysis method: NA | Suited for all user groups. Note that this metric will only be relevant for large enough projects that would have a quantifiable impact on water quality. | |
| Change in property value because of water clarity improvements ($) | Data collection method: existing data sources; analysis method: hedonic valuation | Technical expertise needed. Note that this metric will only be relevant for large enough projects that would have a quantifiable impact on water quality. |
| Class | Metrics | Method options | Additional user considerations |
|---|---|---|---|
| Core | Stream flow | Flowmeter | Technical expertise; cost/expense; temporal requirements; specialized equipment |
| Gauges and Buoys (e.g., Acoustic Doppler Current Profilers) | Technical expertise; cost/expense; collection time investment; specialized equipment | ||
| Creek/channel morphometry | Aerial Photography or satellite imagery | Technical expertise; temporal requirements; cost/expense; specialized equipment | |
| Survey instrument (barcode leveling) | Technical expertise; cost/expense; specialized equipment | ||
| RTK GPS transects | Technical expertise; cost/expense; specialized equipment | ||
| Conditional | Hydroperiod | Water level loggers | Technical expertise; cost/expense; temporal requirements; specialized equipment |
| Sediment supply (e.g., TSS) | Meter (turbidity) | Cost/expense; specialized equipment | |
| Secchi disc | Suited for all user groups | ||
| Filtration | Technical expertise; cost/expense; temporal requirements; specialized equipment | ||
| Sediment capture/ accretion | Sedimentation disc/tile/plate/ marker horizon | Cost/expense (for some methods); temporal requirements; specialized equipment (for some methods) | |
| Measuring stick | Suited for all user groups | ||
| Salinity | Refractometer | Specialized equipment | |
| Meter (total dissolved solids) | Cost/expense; specialized equipment | ||
| Dissolved oxygen | Meter (total dissolved solids) | Cost/expense; specialized equipment | |
| Vegetation community composition | List of plant species in site | Suited for all user groups; temporal requirements | |
| Vegetation structure | Horizontal vegetative obstruction | Temporal requirements; specialized equipment | |
| Vertical light attenuation | Temporal requirements; specialized equipment | ||
| Cover per m2 | Suited for all user groups; temporal requirements | ||
| Number of stems per m2 | Collection time investment; temporal requirements | ||
| Stem heights | Collection time investment; temporal requirements | ||
| Habitat Type %, 50m radius (e.g., high marsh, low marsh, invasives, pannes & pools etc.) | Collection time investment; temporal requirements | ||
| Socioeconomic | Damage costs avoided to surrounding structures, roads or other public infrastructure ($) | Data collection method: Surveys; existing data sources; Analysis method: Avoided cost method; HAZUS modeling or other modeling that simulates changes in flood levels | Technical expertise and specialized software needed. If using a BACI design, may require a large collection time investment (need to wait several years to have enough weather events to compare changes in damage per storm over time). |
| Number of homes or structures benefitting (#) | Data collection methods: visual assessment or GIS analysis | Suited for all user groups. Note that this metric only shows number, not the magnitude of the benefit. | |
| Number of days per month that road is flooded (#) | Data collection method: Surveys; existing data sources; Analysis method: Modeling that simulates changes in flood levels | Some technical expertise required. Note that this metrics shows only the number of days, not the number of people benefitting. | |
| Change in property value because of decrease in flood risk ($) | Data collection method: Existing data sources; Analysis method: Hedonic valuation | Technical expertise needed. |
| Class | Metric categories | Method options | Additional user considerations |
|---|---|---|---|
| Community resilience | Damage costs avoided to surrounding structures, roads or other public infrastructure ($) | Data collection method: surveys; existing data sources; analysis method: avoided cost method; HAZUS modeling or other modeling that simulates changes in flood levels | Technical expertise and specialized software needed. If using a BACI design, may require a large collection time investment (need to wait several years to have enough weather events to compare changes in damage per storm over time). |
| Damage costs avoided to surrounding homes ($) | Data collection method: surveys; existing data sources; analysis method: avoided cost method; HAZUS modeling or other modeling that simulates changes in flood levels | Technical expertise and specialized software needed. If using a BACI design, may require a large collection time investment (need to wait several years to have enough weather events to compare changes in damage per storm over time). | |
| Value of time saved by individuals driving on a road where flooding is reduced ($) | Data collection method: surveys; existing data sources; analysis method: avoided cost method | Technical expertise required; specialized software may be needed, depending upon if hydrological modeling is used to supplement the analysis. | |
| Change in property value because of decrease in flood risk ($) | Data collection method: existing data sources; analysis method: hedonic valuation | Technical expertise needed. | |
| Difference in cost between hardened structure (e.g. bulkhead) and a living shoreline ($) | Data collection method: project budgets and existing data sources; analysis method: substitute cost method | Little technical expertise required; this method is suited for most user groups. | |
| Number of homes or structures benefitting (#) | Data collection methods: visual assessment or GIS analysis | Suited for all user groups. Note that this metric only shows number, not the magnitude of the benefit. | |
| Change in property value because of reduction in rate of erosion ($) | Data collection method: existing data sources; analysis method: hedonic valuation | Technical expertise needed. | |
| Recreation and tourism | Spending by birders, boaters or anglers ($) | Data collection methods: surveys; existing data sources; data analysis methods: economic impact assessment | Some technical expertise needed; may require additional collection time. |
| Number of visitors to the restoration site (#) | Data collection methods: car counter; surveys; geospatially referenced social media methodology; analysis methods: NA | Suited for all user groups. Note that this metric only shows number, not the magnitude of the benefit. | |
| Water quality | Number of shellfisheries closing days (#) | Data collection method: existing data sources; analysis method: NA | Suited for all user groups. Note that this metric will only be relevant for large enough projects that would have a quantifiable impact on water quality. |
Table 10-9 through Table 10-11 provide lists of additional tools and resources that can help you with planning and designing nature-based solutions. The tables are organized into nationwide resources, regional resources, and resources by State.
| Name | Source / Location | Brief Description |
|---|---|---|
| Coastal Resilience Tools | http://coastalresilience.org/tools/apps/ | A collection of web-based tools for assessing shorelines, habitats, sea level rise effects, economics, and risk |
| NOAA Digital Coast | https://coast.noaa.gov/digitalcoast/tools/ | A wide collection of tools and data on topics including adaptation, coastal hazards, resilience, and green infrastructure |
| NOAA Sea Level Rise Viewer | https://coast.noaa.gov/slr/#/layer/slr | A web-based tool for viewing sea level rise inundation, marsh migration predictions, social vulnerability data, and high tide flooding sensitivity |
| NOAA Office for Coastal Management | https://coast.noaa.gov/ | A collection of coastal data, factsheets, and links to relevant programs that can be filtered by State or topic area |
| NOAA Green Infrastructure Effectiveness | https://coast.noaa.gov/digitalcoast/training/gi-database.html | An online database of trusted literature sources related to the effectiveness of green infrastructure at reducing the impacts of coastal hazards |
| NOAA National Centers for Coastal Ocean Science | https://coastalscience.noaa.gov/ | Data, products, and tools relevant for the planning and design of nature-based solutions |
| NOAA National Data Buoy Center | https://www.ndbc.noaa.gov/ | Wave characteristics, meteorological data, water temperature, and salinity |
| NOAA Tides & Currents | https://tidesandcurrents.noaa.gov/ | Tide projections, tidal datums, measured water levels, meteorological data, sea level rise trends |
| USEPA Green Infrastructure Resources | https://www.epa.gov/green-infrastructure/green-infrastructure-design-and-implementation | A collection of manuals, tools, and resources, curated by the U.S. Environmental Protection Agency, regarding green infrastructure |
| USACE Coastal Hazards System | https://chs.erdc.dren.mil/default.aspx | Hydrodynamic data including water levels, waves, and currents for many different storm conditions |
| USACE Engineering With Nature® | http://www.engineeringwithnature.org/ | A collection of tools procured by USACE Engineering With Nature®, including information on Thin Layer Placement and Beneficial Use of Dredge Material |
| USGS Coastal Change Hazards Portal | https://marine.usgs.gov/coastalchangehazardsportal/ | A national overview of extreme events, shoreline change, shoreline position, and sea level rise impacts |
| Living Shorelines Academy | https://livingshorelinesacademy.org/ | A clearinghouse for information on living shorelines and nature-based solutions, including training, resources, guidance, project examples, and a directory of professionals |
| SAGE | http://sagecoast.org/ | Systems Approach to Geomorphic Engineering is a community of practice focused on furthering the use of green-gray/hybrid approaches for resilience |
| Adaptation Clearinghouse | https://www.adaptationclearinghouse.org/ | An online database for finding relevant information and organizations related to adaptation |
| Name | Source / Location | Brief Description |
|---|---|---|
| GulfTREE (Gulf) | http://www.gulftree.org/ | A decision support search engine for identifying tools for adaptation |
| USACE NACCS Study Data (NE) | https://www.nad.usace.army.mil/CompStudy/ | Geodatabase containing exposure and risk analysis, future sea level inundation mapping, and housing density projections |
| VIMS-CCRM (MA) | http://www.vims.edu/ccrm/ | A number of useful resources related to living shorelines and nature-based solutions for Virginia and the Chesapeake Bay |
| Integrated Ocean Observing System | https://ioos.noaa.gov | Coastal and ocean observing data for all coastal regions of the United States |
| Name | Source / Location | Agency |
|---|---|---|
| Alabama | http://www.adem.state.al.us/programs/coastal/default.cnt | Alabama Department of Environmental Management |
| Alaska | n/a | Alaska withdrew from the CZMP in 2011 |
| American Samoa | http://www.doc.as/resource-management/ascmp/ | American Samoa Government Department of Commerce |
| California | https://www.coastal.ca.gov/ | California Coastal Commission |
| Connecticut | https://www.ct.gov/deep/cwp/view.asp?a=2705&q=323536&deepNav_GID=1622 | Connecticut Department of Energy & Environmental Protection |
| Delaware | https://dnrec.alpha.delaware.gov/coastal-zone-act/ | Delaware Department of Natural Resources and Environmental Control |
| Florida | https://floridadep.gov/rcp/fcmp | Florida Department of Environmental Protection |
| Georgia | https://coastalgadnr.org/CoastalManagement | Georgia Department of Natural Resources |
| Guam | http://bsp.guam.gov/guam-coastal-management-program/ | Guam Bureau of Statistics and Plans |
| Hawaii | http://planning.hawaii.gov/czm/ | Hawaii Office of Planning |
| Illinois | https://www.dnr.illinois.gov/cmp/Pages/default.aspx | Illinois Department of Natural Resources |
| Indiana | https://www.in.gov/dnr/lakemich/ | Indiana Department of Natural Resources |
| Louisiana | http://www.dnr.louisiana.gov | Louisiana Department of Natural Resources |
| Maine | https://www.maine.gov/dmr/mcp/ | Maine Department of Marine Resources |
| Maryland | http://dnr.maryland.gov/ccs/Pages/funding/czma.aspx | Maryland Department of Natural Resources |
| Massachusetts | https://www.mass.gov/orgs/massachusetts-office-of-coastal-zone-management | Massachusetts Office of Coastal Zone Management |
| Michigan | https://www.michigan.gov/egle/ http://www.michigan.gov/deq/ | Michigan Department of Environment, Great Lakes, and Energy |
| Minnesota | https://www.dnr.state.mn.us/waters/lakesuperior/index.html | Minnesota Department of Natural Resources |
| Mississippi | http://www.dmr.ms.gov/index.php/coastal-resources-management | Mississippi Department of Marine Resources |
| New Hampshire | http://des.nh.gov/organization/divisions/water/wmb/coastal/index.htm | New Hampshire Department of Environmental Services |
| New Jersey | http://www.state.nj.us/dep/cmp/ | New Jersey Department of Environmental Protection |
| New York | https://www.dos.ny.gov/opd/ | New York Office of Planning & Development |
| North Carolina | https://deq.nc.gov/about/divisions/coastal-management | North Carolina Department of Environmental Quality; Division of Coastal Management |
| Northern Mariana Islands | https://dcrm.gov.mp/ | Northern Mariana Islands Department of Coastal Resources Management |
| Ohio | http://coastal.ohiodnr.gov/ | Ohio Department of Natural Resources Office of Coastal Management |
| Oregon | https://www.oregon.gov/lcd/Pages/index.aspx | Oregon Department of Land Conservation & Development |
| Pennsylvania | http://www.dep.state.pa.us/river/czmp.htm | Pennsylvania Department of Environmental Protection |
| Puerto Rico | http://drna.pr.gov/ | Puerto Rico Department of Natural and Environmental Resources |
| Rhode Island | http://www.crmc.ri.gov/ | Rhode Island Coastal Resources Management Council |
| South Carolina | https://www.scdhec.gov | South Carolina Department of Health and Environmental Control |
| Texas | http://www.glo.texas.gov/coast/grant-projects/cmp/index.html | Texas General Land Office |
| Virgin Islands | https://dpnr.vi.gov/ | USVI Department of Planning & Natural Resources |
| Virginia | https://www.deq.virginia.gov/Programs/CoastalZoneManagement.aspx | Virginia Department of Environmental Quality |
| Washington | http://www.ecy.wa.gov/programs/sea/czm/index.html | Washington Department of Ecology |
| Wisconsin | https://doa.wi.gov/Pages/LocalGovtsGrants/CoastalManagement.aspx | Wisconsin Department of Administration Coastal Management Program |
| Accretion | The accumulation or gain of land by the action of natural forces. On a beach, the deposition of beach material by wave action, tidal currents, or littoral currents. |
|---|---|
| Adaptive capacity | The degree to which the system containing the asset can adjust or mitigate the potential for damage or service interruption by climatic hazards. |
| Bay | (1) A body of water almost completely surrounded by land but open to some tidal flow communications with the sea. (2) A recess in the shore or an inlet of a sea between two capes or headlands. |
| Beach | The zone of unconsolidated material, typically sand, that extends landward from closure depths where sand is moved by waves to the place where there is marked change in material or physiographic form, or to the line of permanent vegetation (usually the effective limit of storm waves). |
| Benthic | Referring to the habitat-rich zone at the bottom of a body of water. |
| Bottom friction | The momentum transfer caused by the interaction of a body of water with the bottom surface. |
| Breakwater | A structure protecting a shore area, harbor, anchorage, or basin from waves. |
| Bulkhead | A structure or partition to retain or prevent sliding of the land. A secondary purpose is to protect the upland against erosion from wave action. |
| Coastal engineering | The planning, design, construction, and operation of infrastructure in the wave, tide, and sand environment that is unique to the coast. A well-established specialty area of civil engineering that focuses on the coastal zone and coastal processes. |
| Coir logs | Tube-shaped erosion-control devices filled with straw, flax, rice, coconut fiber material, or composted material. |
| Depth-limited wave height | A wave height that is limited by the local depth of water. |
| Dune | A ridge or mound of loose, wind-blown material, usually sand. |
| Ecosystem services | The direct and indirect contributions of ecosystems to human well-being. |
| Edging | The stabilization of a marsh edge. |
| Erosion | The wearing away of land by the action of natural forces. On a beach, the carrying away of beach material by wave action, tidal currents, littoral currents, or by deflation. |
| Estuary | (1) The region near a river mouth in which the fresh water of the river mixes with the saltwater of the sea and receives both fluvial and littoral sediment influx. (2) The part of a river that is affected by tides. |
| Fascine | A bundle of material, especially in a log shape. See Coir logs. |
| Fetch | The distance or area in which wind blows across the water, thus forming waves. |
| Floodwall | A long, narrow concrete or masonry embankment usually built to protect land from flooding. |
| Geomorphology | (1) That branch of physical geography that deals with the form of the Earth, the general configuration of its surface, the distribution of the land and water, etc. (2) The investigation of the history of geologic changes through the interpretation of topographic forms. |
| Hybrid approach | An integrated approach to shoreline stabilization that combines nature-based solutions with structures and possibly policy measures. |
| Intertidal | Refers to a feature that is covered by water during high tide and uncovered during low tide. |
| Levee | An earthen embankment that blocks an area on a reservoir or lake rim that is lower than the top of the dam. Also called a dike. |
| Littoral cell | An area of shoreline and associated topography/bathymetry wherein the movement of sediment is driven by waves and currents. |
| Living breakwater | A structure that provides potential habitat within it and functions like a breakwater to reduce wave energy on the shoreline. |
| Living shoreline | A method of shoreline stabilization that uses appropriate combinations of natural materials, and possibly some structure, to complement the natural ecological and geological setting and shoreline function. |
| Mangrove | Any of a group of tropical maritime trees or shrubs that live in the coastal intertidal zone. |
| Maritime forest | A coastal wooded area, usually found on higher ground than dune areas within a range of salt spray. |
| Marsh | (1) A tract of soft, wet land, usually vegetated by reeds, grasses, and occasionally small shrubs. (2) Soft, wet area periodically or continuously flooded to a shallow depth, usually characterized by a particular subclass of grasses, cattails, and other low plants. |
| Meteotsunami | Long-wave motions principally caused by meteorologically induced disturbances, including those associated with pressure jumps, frontal passages, and squalls. |
| Nonlinear | Occurring as a result of a mathematical operation that is not linear. |
| Nuisance flooding | Minor, recurrent flooding that occurs at high tide or during minor storms. |
| Nutrient loading | The quantity of nutrients (such as nitrogen or phosphorous) entering an ecosystem in a given timeframe. |
| Nutrient uptake | The process of plants absorbing, usually through the roots, nutrients from the surrounding environment. |
| Ocean acidification | A reduction in the pH of the ocean over an extended period of time, caused primarily by uptake of carbon dioxide (CO2) from the atmosphere. |
| Overtopping | Passing of water over the top of a structure (e.g., seawall, roadway), usually as a result of wave runup and/or coastal storm surge. Riverine flow can contribute to overtopping. |
| Overwashing | Sustained movement of water, and possibly sediment, over the top of a barrier island or roadway as a result of coastal storm surge and wave action. |
| Pocket beach | A beach, usually small and curved, in a coastal embayment between two headland littoral barriers. |
| Poorly graded | See Well sorted. |
| reef | Offshore consolidated rock. Often refers to coral fringing reefs in tropical waters, but may also include shellfish reefs such as oyster. |
| Return period | A concept used to define the average length of time between occurrences in which the value of the random variable, typically flood level, is equaled or exceeded. |
| Revetment | A layer or layers of stone, concrete, etc. that protect(s) an embankment, or shore structure, against erosion by wave action or currents. |
| Rhizome | A root-like, usually horizontal, stem growing under or along the ground. Roots sprout from the lower surface, and stems and leaves sprout from the top surface. |
| Risk | Chance or probability of failure resulting from all possible environmental inputs and all possible mechanisms. The concept of flood risk typically captures both the probability of the flood event and the consequences of the flood event. May also refer to the likelihood of an event. |
| Sea level rise | The long-term trend in mean sea level not accounting for the effects of land movement. |
| Seawall | A structure, often concrete or stone, built along a portion of a coast to prevent erosion and other damage by wave action. It often retains earth against its shoreward face. A seawall is typically more massive and capable of resisting greater wave forces than a bulkhead. |
| Sediment transport | The movement of (beach) sediments. Longshore sand transport occurs primarily parallel to the shoreline. |
| Sheet pile | Interlocking boards or planks of steel, vinyl, concrete, wood, or other materials that are driven into the ground to form a wall. |
| Sill | A coast-parallel, low-profile structure built with the objective of reducing the wave action on the shoreline by forcing wave breaking over the sill. |
| Stem density | A measurement of the average number of plant stems found in a given area. |
| Storm surge | A rise in average (typically over several minutes) water level above the normal astronomical tide level because of the action of a storm. Storm surge results from wind stress, atmospheric pressure reduction, and wave setup. |
| Subtidal | Refers to a feature that is always submerged, even at low tide. |
| Suspended solids | Particulate matter that is dispersed in a body of water. |
| Tidal restriction | A reduction of the tidal flow to and from a hydrologic feature, such as a marsh. |
| Tipping point | A point in space, or in time, beyond which some alternative approach is required. |
| Tsunami | A long-period wave, or series of waves, caused by an underwater disturbance, such as a volcanic eruption or earthquake. Commonly miscalled a tidal wave. |
| Tsunami runup | The large amount of water that a tsunami pushes onshore. |
| Water quality | The composition of the water in terms of its constituents, including the presence of nutrients, dissolved materials, and suspended solids. |
| Wave | A ridge, deformation, or undulation of the surface of a liquid. |
| Wave attenuation | To lessen the height or amplitude of a wave, wave-like feature, or velocity. |
| Wave breaking | Reduction in wave energy and height. In the surf zone, breaking is because of limited water depth. |
| Wave height | The vertical distance between a crest and the preceding trough. |
| Wave period | The time for a wave crest to traverse a distance equal to one wavelength. The time for two successive wave crests to pass a fixed point. |
| Wave runup | The upper level reached by a wave on a beach or coastal structure, relative to the still water level. |
| Wave setup | Superelevation of the water surface over normal surge elevation because of onshore mass transport of the water by wave action alone. |
| Wave transmission | The movement of a wave through some porous obstruction, which usually causes some attenuation of the wave. |
| Well sorted | A characterization of soil representing a very narrow (low variance) grain size distribution. |
The Federal Highway Administration would like to express appreciation to the members of the Technical Review Committee, whom contributed valuable input and technical expertise during the development of this implementation guide. The members were:
The Federal Highway Administration would also like to express appreciation to the participants in the four regional peer exchanges that informed the development of this guide. The list of participants is included in Peer Exchange Report: Nature-based Solutions for Coastal Highways.
AASHTO. (2011). Guidelines for Vegetation Management. American Association of State Highway and Transportation Officials, 304.
Allan, J. C., Geitgey, R., and Hart, R. (2005a). Dynamic Revetments for Coastal Erosion in Oregon. Oregon Department of Geology and Mineral Industries, Newport, OR, 112.
Allan, J. C., Geitgey, R., and Hart, R. (2005b). Dynamic Revetments for Coastal Erosion Stabilization: A Feasibility Analysis for Application on the Oregon Coast. Oregon Department of Geology and Mineral Industries, 76.
Allan, J. C., Ruggiero, P., Cohn, N., Garcia, G., O'Brien, F. E., Serafin, K., Stimely, L. L., and Roberts, J. T. (2015). Coastal Flood Hazard Study, Lincoln County, Oregon. Oregon Department of Geology and Mineral Industries, Portland, OR, 351.
Allen, R. J., and Webb, B. M. (2011). "Determination of wave transmission coefficients for oyster shell bag breakwaters." In: Proceedings of the Conference on Coastal Engineering Practice 2010, 684–697.
Anderson, M., Smith, J., Bryant, D., and McComas, R. (2013). Laboratory studies of wave attenuation through artificial and real vegetation. US Army Engineer Research and Development Center, 75.
d'Angremond, K., Van Der Meer, J. W., and De Jong, R. J. (1997). "Wave transmission at low-crested structures." In: Proceedings of the International Conference on Coastal Engineering, 2418–2427.
Baggett, L. P., Powers, S. P., Brumbaugh, R. D., Coen, L. D., DeAngelis, B. M., Greene, J. K., Hancock, B. T., Morlock, S. M., Allen, B. L., Breitburg, D. L., Bushek, D., Grabowski, J. H., Grizzle, R. E., Grosholz, E. D., La Peyre, M. K., Luckenbach, M. W., McGraw, K. A., Piehler, M. F., Westby, S. R., and zu Ermgassen, P. S. E. (2015). "Guidelines for evaluating performance of oyster habitat restoration: Evaluating performance of oyster restoration." Restoration Ecology, 23(6), 737–745.
Barbier, E. B. (2016). "The protective service of mangrove ecosystems: A review of valuation methods." Marine Pollution Bulletin, 109(2), 676–681.
Barbier, E. B., Hacker, S. D., Kennedy, C., Koch, E. W., Stier, A. C., and Silliman, B. R. (2011). "The value of estuarine and coastal ecosystem services." Ecological Monographs, 81(2), 169–193.
Barone, D. A., McKenna, K. K., and Farrell, S. C. (2014). "Hurricane Sandy: beach-dune performance at New Jersey Beach profile network sites." Shore Beach, 82(4), 13–23.
Beavers, R. L., Babson, A. L., and Schupp, C. A. (2016). Coastal Adaptation Strategies Handbook. National Park Service, Washington, D.C., 160.
Beck, M. W., Losada, I. J., Menéndez, P., Reguero, B. G., DÃaz-Simal, P., and Fernández, F. (2018). "The global flood protection savings provided by coral reefs." Nature Communications, 9(1).
Beck, R. J., Chambers, R. M., and Mitchell, M. M. (2017). "Evaluation of living shoreline marshes as a tool for reducing nitrogen pollution in coastal systems." Living Shorelines: The Science and Management of Nature-based Coastal Protection, M. Bilkovic, M. Mitchell, M. La Peyre, and J. Toft, eds., CRC Press, Taylor & Francis Group.
Bilkovic, D. M., and Mitchell, M. M. (2013). "Ecological tradeoffs of stabilized salt marshes as a shoreline protection strategy: Effects of artificial structures on macrobenthic assemblages." Ecological Engineering, 61, 469–481.
Bodge, K. R. (2003). "Design aspects of groins and jetties." Advances in coastal structure design, R. Mohan, O. Magoon, and M. Pirrello, eds., American Society of Civil Engineers, Reston, VA, 181–199.
Boudreau, R., Sloop, R., Holloway, A., and Rivera, J. (2018). "Maui's resilient living shoreline project provides adaptation strategy for critical infrastructure." Shore & Beach, 86(4), 26–35.
Boyd, C., Pace, N., Greenfeld, B., Ryan-Henry, J. (2017). "Exploring living shorelines permitting at the state, federal, and local level through case studies," Shore & Beach, 85(4), 25-33.
Breaux, A., Farber, S., and Day, J. (1995). "Using Natural Coastal Wetlands Systems for Wastewater Treatment: An Economic Benefit Analysis." Journal of Environmental Management, 44(3), 285–291.
Bridges, T. S., Bourne, E. M., King, J. K., Kuzmitski, H. K., Moynihan, E. B., and Suedel, B. C. (2018). Engineering with Nature: an Atlas. ERDC/EL SR-18-8, U.S. Army Engineer Research and Development Center, Vicksburg, MS.
Bridges, T., Wagner, P., Burks-Copes, K., Bates, M., Collier, Z., Fischenich, C., Gailani, J., Leuck, L., Piercy, C., Rosati, J., Russo, E., Shafer, D., Suedel, B., Vuxton, E., and Wamsly, T. (2014). Use of natural and nature-based features (NNBF) for coastal resilience. U.S. Army Corps of Engineers, 480.
Bryant, D., Bryant, M., and Grzegorzewski, A. (2017). Erosion of coastal foredunes : a review on the effect of dune vegetation. US Army Engineer Research and Development Center, 11.
Bryant, D., Bryant, M., Sharp, J., and Bell, G. (2018). "Erosion of Vegetated Dunes." Proceedings of the 7th International Conference on the Application of Physical Modelling in the Coastal and Port Engineering Science, Santander, Spain, 7.
Bryars, R. (2016). Living Shorelines: A Technical Guide for Contractors in Alabama and Mississippi. Baldwin County Soil and Water Conservation District, 43.
Costanza, R., Pérez-Maqueo, O., Martinez, M. L., Sutton, P., Anderson, S. J., and Mulder, K. (2008). "The Value of Coastal Wetlands for Hurricane Protection." AMBIO: A Journal of the Human Environment, 37(4), 241–248.
Cunnif, S., and Schwartz, A. (2015). Performance of natural infrastructure and nature-based measures as coastal risk reduction features. Environmental Defense Fund, 35.
Currin, C. A., Delano, P. C., and Valdes-Weaver, L. M. (2008). "Utilization of a citizen monitoring protocol to assess the structure and function of natural and stabilized fringing salt marshes in North Carolina." Wetlands Ecology and Management, 16(2), 97–118.
Das, S. C., Iimura, K., and Tanaka, N. (2010). "Effects of coastal vegetation species and ground slope on storm surge disaster mitigation." In: Proceedings of the International Conference on Coastal Engineering.
Davis, J. L., Currin, C. A., O'Brien, C., Raffenburg, C., and Davis, A. (2015). "Living Shorelines: Coastal Resilience with a Blue Carbon Benefit." PLOS ONE, 10(11).
Dean, R. G. (2000). "Storm damage reduction potential via beach nourishment." In: Proceedings of the 27th International Conference on Coastal Engineering, ICCE 2000, 3305-3318.
Dean, R. G. (2003). Beach Nourishment. World Scientific.
DLNR. (2013). Hawaii Coastal Erosion Management Plan. Department of Land and Natural Resources, Honolulu, HI, 90.
DOI. (2015). Recommendations for assessing the effects of the DOI Hurricane Sandy Mitigation and Resilience Program on ecological system and infrastructure resilience in the Northeast coastal region. Department of the Interior, Washington, DC, 69.
Duhring, K. (2016). "Living Shoreline Concept Designs: What needs to be considered?" Lewes, DE.
Duhring, K. (2006). "Overview of Living Shoreline Design Options." Management, Policy, Science, and Engineering of Nonstructural Erosion Control in the Chesapeake Bay, 13–18.
EWN. (2019). "International NNBF Guidelines Project." Engineering With Nature, <https://ewn.el.erdc.dren.mil/nnbf-guidelines.html> (Feb. 17, 2019).
Faulkner, D. (2010). Treating Shoreline Erosion: A Concise Guide for Homeowners. USDA/NRCS, Virginia, 10.
FEMA. (2018). "Hazard Mitigation Grant Program | FEMA.gov." Hazard Mitigation Grant Program, <https://www.fema.gov/hazard-mitigation-grant-program> (Jun. 15, 2018).
FEMA. (2019). Job Aid: Bioengineered Shoreline Stabilization. Federal Emergency Management Agency, Washington, DC, 14.
FHWA. (2008). HEC-25: Highways in the Coastal Environment. Hydraulic Engineering Circular FHWA-NHI-07-096. Federal Highway Administration, Washington, DC, 250.
FHWA. (2012). "Eligibility of Activities to Adapt to Extreme Weather Events Under the Federal-Aid and Federal Lands Highway Programs." <https://www.fhwa.dot.gov/federalaid/120924.cfm>
FHWA. (2014). HEC-25 Volume 2: Highways in the Coastal Environment: Assessing Extreme Events. Hydraulic Engineering Circular FHWA-NHI-14-006. Federal Highway Administration, Washington, DC, 147.
FHWA. (2016a). Barrier Island Roadway Overwashing from Sea Level Rise and Storm Surge: US 98 on Okaloosa Island, Florida. TEACR Engineering Assessment FHWA-HEP-17-015. Federal Highway Administration, Washington, DC, 32.
FHWA. (2016b). Living Shoreline along Coastal Roadways Exposed to Sea Level Rise: Shore Road in Brookhaven, New York. TEACR Engineering Assessment FHWA-HEP-17-016. Federal Highway Administration, Washington, DC, 29.
FHWA. (2017). A Primer on Modeling in the Coastal Environment. FHWA-HIF-18-002. Federal Highway Administration, Washington, DC, 72.
FHWA. (2018a). Henderson Point Connector (US HWY 90): Green Infrastructure Techniques for Coastal Highway Resilience. FHWA-HEP-18-042. Federal Highway Administration, Washington, DC, 47.
FHWA. (2018b). Peer Exchange Summary Report: Nature-Based Solutions for Coastal Highway Resilience. Federal Highway Administration, Washington, DC, 38.
FHWA. (2018c). Quantification of Flood Event Forcing and the Impact of Natural Wetland Systems: Great Bay Boulevard, Ocean County, New Jersey. FHWA-HEP-18-069. Federal Highway Administration, Washington, DC, 40.
FHWA. (2018d). Two Northeastern DOTs Consider Green Infrastructure Techniques for Coastal Highway Resilience: A Joint Study with Divergent Outcomes. FHWA-HEP-18-088. Federal Highway Administration, Washington, DC, 47.
FHWA. (2018e). White Paper: Nature-Based Solutions for Coastal Highway Resilience. FHWA-HEP-18-037. Federal Highway Administration, Washington, DC, 42.
FHWA. (2019a). HEC-25: Highways in the Coastal Environment, 3rd Ed. Federal Highway Administration, Washington, DC.
FHWA. (2019b). "Pilot Projects under Strategic Initiative on Nature-Based Solutions." Green Infrastructure, <https://www.fhwa.dot.gov/environment/sustainability/resilience/ongoing_and_current_research/green_infrastructure/pilots.cfm> (Feb. 17, 2019).
FHWA. (2019c). "FHWA | Environmental Review Toolkit | Eco-Logical | Environmental Initiatives." Implementing the Eco-Logical Approach, <https://www.environment.fhwa.dot.gov/env_initiatives/eco-logical.aspx> (Jan. 5, 2019).
Figlus, J., Sigren, J. M., Armitage, A. R., and Tyler, R. C. (2014). "Erosion of vegetated coastal dunes." In: Proceedings of the International Conference on Coastal Engineering, Lynett P., ed., American Society of Civil Engineers (ASCE).
Forand, N., DuBois, K., Halka, J., Hardaway, C. S., Janek, G., Karrh, L., Koch, E., Linker, L., Mason, P., Morgereth, E., Proctor, D., Smith, K., Stack, B., Stewart, S., and Wolinski, B. (2015). Removal Rates for Shoreline Management Projects. Watershed Technical Working Group, 161.
Garzon, J. L., Miesse, T., and Ferreira, C. M. (2019). "Field-based numerical model investigation of wave propagation across marshes in the Chesapeake Bay under storm conditions." Coastal Engineering, 146, 32–46.
GBF. (2011). Living Shorelines: A Natural Approach to Erosion Control. Galveston Bay Foundation, 32.
GDNR. (2013). Living Shorelines Along the Georgia Coast: A Summary Report of the First Living Shoreline projects in Georgia. Coastal Resources Division, Brunswick, GA, 43.
Gittman, R. K., Scyphers, S. B., Smith, C. S., Neylan, I. P., and Grabowski, J. H. (2016a). "Ecological consequences of shoreline hardening: a meta-analysis." BioScience, 66(9), 763–773.
Gittman, R. K., Peterson, C. H., Currin, C. A., Joel Fodrie, F., Piehler, M. F., and Bruno, J. F. (2016a). "Living shorelines can enhance the nursery role of threatened estuarine habitats." Ecological Applications, 26(1), 249–263.
Gralher, C., Kobayashi, N., and Do, K. (2012). "Wave overwash of vegetated dunes." In: Proceedings of the International Conference on Coastal Engineering.
Griffith, A. D., Coburn, A. S., Peek, K. M., and Young, R. S. (2014). "Hurricane Sandy: Did Beach Nourishment Save New Jersey?" Learning from the Impacts of Superstorm Sandy, Elsevier Inc., 57–68.
Guannel, G., Arkema, K., Ruggiero, P., and Verutes, G. (2016). "The power of three: Coral reefs, seagrasses and mangroves protect coastal regions and increase their resilience." PLoS ONE, 11(7).
Hallermeier, R. J., and Rhodes, P. E. (1989). "Generic treatment of dune erosion for 100-year event." In: Proceedings of the International Conference on Coastal Engineering, 1197–1211.
Hardaway, C. S., and Byrne, R. J. (1999). Shoreline Management in Chesapeake Bay. Applied Marine Science and Ocean Engineering, Virginia Institute of Marine Science, Gloucester Point, VA, 56.
Hardaway, C. S., and Gunn, J. R. (2002). "Shoreline Protection: Design Guidelines for Pocket Beaches in Chesapeake Bay, USA." Carbonate Beaches 2000, American Society of Civil Engineers, Westin Beach Resort, Key Largo, Florida, United States, 126–139.
Hardaway, C. S., and Gunn, J. R. (2011). "A brief history of headland breakwaters for shore protection in Chesapeake Bay, USA." Shore & Beach, 78(4), 9.
Hardaway, C. S., Gunn, J. R., and Reynolds, R. N. (1993). "Breakwater Design in the Chesapeake Bay: Dealing with the End Effects." 8th Symposium on Coastal and Ocean Management, ASCE, New Orleans, LA, 27–41.
Hardaway, C. S., Milligan, D., Wilcox, C., and Duhring, K. (2017). Living Shoreline Design Guidelines for Shore Protection in Virginia's Estuarine Environments. Virginia Institute of Marine Science, Gloucester Point, VA.
Harmon, T. (2018). "VDOT'S Chesapeake Bay TMDL Action Plan." Virginia Department of Transportation.
Hashim, A. M., and Catherine, S. M. P. (2013). "A Laboratory Study on Wave Reduction by Mangrove Forests." APCBEE Procedia, 5, 27–32.
Hatzikyriakou, A., Lin, N., Gong, J., Xian, S., Hu, X., and Kennedy, A. (2016). "Component-Based Vulnerability Analysis for Residential Structures Subjected to Storm Surge Impact from Hurricane Sandy." Natural Hazards Review, 17(1).
Hayward, S., Hashemi, M. R., Torres, M., Grilli, A., Gilli, S., King, J., Baxter, C., and Spaulding, M. (2018). "Numerical simulation of coastal erosion and its mitigation by living shoreline methods: A case study in southern Rhode Island." Shore & Beach, 86(4), 13–25.
Heerden, I. L. V. (2007). "The Failure of the New Orleans Levee System Following Hurricane Katrina and the Pathway Forward." Public Administration Review, 67(s1), 24–35.
Hoegh-Guldberg, O., Mumby, P. J., Hooten, A. J., Steneck, R. S., Greenfield, P., Gomez, E., Harvell, C. D., Sale, P. F., Edwards, A. J., and Caldeira, K. (2007). "Coral reefs under rapid change and ocean acidification." Science, 318(5857), 1737–1742.
Houston, J. (2016). "Beach nourishment as an adaptation strategy for sea level rise: a Florida east coast perspective." Shore & Beach, 84(2), 3–12.
Irish, J. L., Lynett, P. J., Weiss, R., Smallegan, S. M., and Cheng, W. (2013). "Buried relic seawall mitigates Hurricane Sandy's impacts." Coastal Engineering, 80, 79–82.
Irish, J. L., Weiss, R., Yang, Y., Song, Y. K., Zainali, A., and Marivela-Colmenarejo, R. (2014). "Laboratory experiments of tsunami run-up and withdrawal in patchy coastal forest on a steep beach." Natural Hazards, 74(3), 1933–1949.
Ismail, H., Abd Wahab, A. K., and Alias, N. E. (2012). "Determination of mangrove forest performance in reducing tsunami run-up using physical models." Natural Hazards, 63(2), 939–963.
Johannessen, J., MacLennan, A., Blue, A., Waggoner, J., Williams, S., Gerstel, W., Barnard, R., Carman, R., and Shipman, H. (2014). Marine Shoreline Design Guidelines. Washington Department of Fish and Wildlife, Olympia, WA, 419.
Kalakan, C., Sriariyawat, A., Naksuksakul, S., and Rasmeemasmuang, T. (2016). "Sensitivity analysis of coastal flooding to geographical factors: Numerical model study on idealized beaches." Engineering Journal, 20(1), 1–16.
Kim, H. D., Kobayashi, N., and Cárdenas, X. C. (2016). "Comparison of rock seawall and dune for storm damage reduction." Proceedings of the 35th International Conference on Coastal Engineering, Antalya, Turkey, 13.
Kirwan, M. L., and Megonigal, J. P. (2013). "Tidal wetland stability in the face of human impacts and sea-level rise." Nature, 504(7478), 53–60.
Kirwan, M. L., Temmerman, S., Skeehan, E. E., Guntenspergen, G. R., and Fagherazzi, S. (2016). "Overestimation of marsh vulnerability to sea level rise." Nature C. C., 6(3), 253–260.
Knutson, P., Brochu, R., Seelig, W., and Inskeep, M. (1982). "Wave damping in Spartina alterniflora marshes." Wetlands, 2(1), 87–104.
Kobayashi, N., Gralher, C., and Do, K. (2013). "Effects of woody plants on dune erosion and overwash." Journal of Waterway, Port, Coastal and Ocean Engineering, 139(6), 466–472.
Krauss, K. W., Doyle, T. W., Doyle, T. J., Swarzenski, C. M., From, A. S., Day, R. H., and Conner, W. H. (2009). "Water level observations in mangrove swamps during two hurricanes in Florida." Wetlands, 29(1), 142–149.
Leonardi, N., Ganju, N. K., and Fagherazzi, S. (2016). "A linear relationship between wave power and erosion determines salt-marsh resilience to violent storms and hurricanes." Proceedings of the National Academy of Sciences, 113(1), 64–68.
Leung, V. A., Woiwode, N., and Smith, M. P. (2018). A Procurement Guide to Nature-Based Solutions. The Nature Conservancy, 26.
Lulloff, A. R., and Keillor, P. (2016). Managing Coastal Hazard Risks on Wisconsin's Dynamic Great Lakes Shoreline. Wisconsin Coastal Management Program, 61.
Luscher, A., and Hollingsworth, C. (2007). Shore Erosion Control: The Natural Approach. National Oceanic and Atmospheric Administration, 12.
Manis, J., Garvis, S., Jachec, S., and Walters, L. (2015). "Wave attenuation experiments over living shorelines over time: a wave tank study to assess recreational boating pressures." Journal of Coastal Conservation,19(1), 1–11.
Maryland Dept. Natural Resources. (2019). "The Coastal Atlas." Maryland Dept. Natural Resources, <http://dnr.maryland.gov/ccs/coastalatlas/Pages/default.aspx> (Jan. 5, 2019).
Mazda, Y., Magi, M., Kogo, M., and Hong, P. N. (1997). "Mangroves as a coastal protection from waves in the Tong King delta, Vietnam." Mangroves and Salt Marshes, 1(2), 127–135.
MBNEP. (2014). Living Shorelines: A Guide for Alabama Property Owners. Mobile Bay National Estuary Program, Mobile, AL, 32.
MDE. (2008). Shore Erosion Control Guidelines for Waterfront Property Owners. Maryland Department of the Environment, Maryland, 58.
van der Meer, J. W., Briganti, R., Zanuttigh, B., and Wang, B. (2005). "Wave transmission and reflection at low-crested structures: Design formulae, oblique wave attack and spectral change." Coastal Engineering, 52(10–11), 915–929.
Mei, C. C., Chan, I.-C., and Liu, P. L.-F. (2014). "Waves of intermediate length through an array of vertical cylinders." Environmental Fluid Mechanics, 14(1), 235–261.
Miller, J., Rella, A., Williams, A., and Sproule, E. (2015). Living Shorelines Engineering Guidelines. Stevens Institute of Technology, New Jersey, 101.
Milligan, D. A. (1996). Public Beach Assessment Report Yorktown Public Beach, Yorktown Virginia. Virginia Institute of Marine Science.
Milligan, D. A., Hardaway, C. S., Meneghini, L. M., Thomas, G. R., and Wilcox, C. A. (2005). Yorktown Beach 2003-2005 with Hurricane Isabel Impacts. Virginia Institute of Marine Science, 40.
Mitchell, M., and Bilkovic, D. M. (2019). "Embracing dynamic design for resilient living shorelines." Journal of Applied Ecology, 56(5), 1099–1105.
Mitchell, M., Herman, J., Bilkovic, D. M., and Hershner, C. (2017). "Marsh persistence under sea-level rise is controlled by multiple, geologically variable stressors." Ecosystem Health and Sustainability, 3(10), 1379888.
Morris, J. T., Sundareshwar, P. V., Nietch, C. T., Kjerfve, B., and Cahoon, D. R. (2002). "Responses of coastal wetlands to rising sea level." Ecology, 83(10), 2869–2877.
Morris, R. L., Konlechner, T. M., Ghisalberti, M., and Swearer, S. E. (2018). "From grey to green: Efficacy of eco-engineering solutions for nature-based coastal defence." Global Change Biology, 24(5), 1827–1842.
Narayan, S., Beck, M. W., Reguero, B. G., Losada, I. J., Van Wesenbeeck, B., Pontee, N., Sanchirico, J. N., Ingram, J. C., Lange, G.-M., and Burks-Copes, K. A. (2016). "The effectiveness, costs and coastal protection benefits of natural and nature-based defences." PLoS ONE, 11(5).
Narayan, S., Beck, M. W., Wilson, P., Thomas, C. J., Guerrero, A., Shepard, C. C., Reguero, B. G., Franco, G., Ingram, J. C., and Trespalacios, D. (2017). "The Value of Coastal Wetlands for Flood Damage Reduction in the Northeastern USA." Scientific Reports, 7(1).
Nateghi, R., Bricker, J. D., Guikema, S. D., and Bessho, A. (2016). "Statistical analysis of the effectiveness of seawalls and coastal forests in mitigating tsunami impacts in Iwate and Miyagi prefectures." PLoS ONE, 11(8).
NCDEQ. (2019). "Estuarine Shoreline Stabilization Options." Stabilization Options, <https://deq.nc.gov/about/divisions/coastal-management/coastal-management-estuarine-shorelines/stabilization/stabilization-options> (Feb. 15, 2019).
Newkirk, S., Veloz, S., Hayden, M., Battalio, B., Cheng, T., Judge, J., Heady, W., Leo, K., and Small, M. (2018). Toward Natural Shoreline Infrastructure to Manage Coastal Change in California. California's Fourth Assessment, 70.
Nichols, K., and Brzozowski, A. (2014). A Landowner's Guide to Protecting Shoreline Ecosystems. Island Planners, 48.
NJDOT. (2009). Shoreline Stabilization Details, Route 52 (1933) Causeway from US Route 9 to Asbury Avenue Contract No. 000048030 Contract B Bridge Replacement Reconstruction and Resurfacing. New Jersey Department of Transportation, 371.
NOAA. (2015). Guidance for considering the use of living shorelines. National Oceanic and Atmospheric Administration, Washington, DC, 36.
NOAA. (2018). "NOAA Tides & Currents." NOAA Tides & Currents, <https://tidesandcurrents.noaa.gov/> (Mar. 5, 2018).
NOAA. (2019). "NOAA Sea Grant Program." Sea Grant > Welcome to NOAA Sea Grant, <https://seagrant.noaa.gov/> (Feb. 15, 2019).
NRC. (1995). Beach Nourishment and Protection. National Research Council. National Academies Press, Washington, D.C.
NRC. (2005). Valuing Ecosystem Services: Toward Better Environmental Decision-Making. National Research Council. National Academies Press, Washington, D.C.
NRC. (2007). Mitigating Shore Erosion along Sheltered Coasts. National Research Council. National Academies Press, Washington, D.C.
NYSDEC. (2017). Tidal Wetlands Guidance Document: Living Shoreline Techniques in the Marine District of New York State. New York State Department of Environmental Conservation, New York, 48.
O'Donnell, J., Vaudrey, J., Tobias, C., French, R., Schenck, P., and Lin, C. (2018). Beneficial Use of Dredged Material for Salt Marsh Restoration and Creation in Connecticut. 218.
ODOT. (2017). Green Infrastructure Techniques for Resilience of the Oregon Coast Highway. Oregon Department of Transportation, 71.
Onorevole, K. M., Thompson, S. P., and Piehler, M. F. (2018). "Living shorelines enhance nitrogen removal capacity over time." Ecological Engineering, 120, 238–248.
Paquier, A.-E., Haddad, J., Lawler, S., and Ferreira, C. M. (2017). "Quantification of the Attenuation of Storm Surge Components by a Coastal Wetland of the US Mid Atlantic." Estuaries and Coasts, 40(4), 930–946.
Parkinson, R. W., and Ogurcak, D. E. (2018). "Beach nourishment is not a sustainable strategy to mitigate change." Estuarine, Coastal and Shelf Science, 212, 203–209.
PDE. (2013). Living Shorelines in the Delaware Estuary: Best Practices from Lessons Learned. Partnership for the Delaware Estuary. 60.
Piazza, B. P., Banks, P. D., and La Peyre, M. K. (2005). "The potential for created oyster shell reefs as a sustainable shoreline protection strategy in Louisiana." Restoration Ecology, 13(3), 499–506.
Priest, W. I. (2006). "Design Criteria for Tidal Wetlands." Management, Policy, Science, and Engineering of Nonstructural Erosion Control in the Chesapeake Bay, 25–32.
Quartel, S., Kroon, A., Augustinus, P. G. E. F., Van Santen, P., and Tri, N. H. (2007). "Wave attenuation in coastal mangroves in the Red River Delta, Vietnam." Journal of Asian Earth Sciences, 29(4), 576–584.
RAE. (2015). Living Shorelines: from Barriers to Opportunities. Restore America's Estuaries, Arlington, VA, 55.
Reed, D. J., Bishara, D. A., Cahoon, D. R., Donnelly, J., Kearney, M., Kolker, A. S., Leonard, L. L., Orson, R. A., and Stevenson, J. C. (2008). "Site-Specific Scenarios for Wetlands Accretion as Sea Level Rises in the Mid-Atlantic Region." Background Documents Supporting Synthesis and Assessment Product 4.1, J. G. Titus and E. M. Strange, eds., USEPA, Washington, DC, 41.
Reguero, B. G., Beck, M. W., Agostini, V. N., Kramer, P., and Hancock, B. (2018a). "Coral reefs for coastal protection: A new methodological approach and engineering case study in Grenada." Journal of Environmental Management, 210, 146–161.
Reguero, B. G., Beck, M. W., Bresch, D. N., Calil, J., and Meliane, I. (2018b). "Comparing the cost effectiveness of nature-based and coastal adaptation: A case study from the Gulf Coast of the United States." PLOS ONE, 13(4).
Restore the Gulf. (2019). "About the RESTORE Act | Restore The Gulf." About the RESTORE Act, <https://www.restorethegulf.gov/history/about-restore-act> (Feb. 15, 2019).
Ridge, J. T., Rodriguez, A. B., Joel Fodrie, F., Lindquist, N. L., Brodeur, M. C., Coleman, S. E., Grabowski, J. H., and Theuerkauf, E. J. (2015). "Maximizing oyster-reef growth supports green infrastructure with accelerating sea-level rise. Scientific Reports, 5, 14785.
Rodriguez, A. B., Fodrie, F. J., Ridge, J. T., Lindquist, N. L., Theuerkauf, E. J., Coleman, S. E., Grabowski, J. H., Brodeur, M. C., Gittman, R. K., Keller, D. A., and Kenworthy, M. D. (2014). "Oyster reefs can outpace sea-level rise." Nature C. C., 4(6), 493–497.
Rogers, S. M. (2000). "Beach nourishment for hurricane protection: North Carolina project performance in Hurricanes Dennis and Floyd." Proceedings of the National Beach Preservation Conference, ASBPA, Maui, HI, 6.
Roland, R. M., and Douglass, S. L. (2005). "Estimating Wave Tolerance of Spartina alterniflora in Coastal Alabama." Journal of Coastal Research, 213, 453–463.
Rosati, J. D. (1990). Functional Design of Breakwaters for Shore Protection: Empirical Methods: Defense Technical Information Center, Fort Belvoir, VA.
SAGE. (2017). Natural and Structural Measures for Shoreline Stabilization. Systems Approach to Geomorphic Engineering, 7.
Saleh, F., and Weinstein, M. P. (2016). "The role of nature-based infrastructure (NBI) in coastal resiliency planning: A literature review." Journal of Environmental Management, 183, 1088–1098.
Schiavinato, L., and Kalo, J. (2014). Management Strategies for North Carolina's Estuarine Shoreline. North Carolina Sea Grant, Raleigh, NC, 150.
Schrass, K., and Mehta, A. V. (2017). Improved Use and Understanding of NNBF in the Mid-Atlantic. National Wildlife Federation, Annapolis, MD, 52.
Servold, K. P., Webb, B. M., and Douglass, S. L. (2015). "Effects of Low-Crested Living Shoreline Breakwaters on Wave Setup. In: Proceedings of the Coastal Structures and Solutions to Coastal Disasters Joint Conference, 421–431.
Sharma, S., Goff, J., Cebrian, J., and Ferraro, C. (2016). "A hybrid shoreline stabilization technique: Impact of modified intertidal reefs on marsh expansion and nekton habitat in the northern Gulf of Mexico." Ecological Engineering, 90, 352–360.
Shepard, C. C., Crain, C. M., and Beck, M. W. (2011). "The protective role of coastal marshes: A systematic review and meta-analysis." PLoS ONE, 6(11).
Silva, R., MartÃnez, M. L., Odériz, I., Mendoza, E., and Feagin, R. A. (2016). "Response of vegetated dune–beach systems to storm conditions." Coastal Engineering, 109, 53–62.
Smallegan, S. M., Irish, J. L., Van Dongeren, A. R., and Den Bieman, J. P. (2016). "Morphological response of a sandy barrier island with a buried seawall during Hurricane Sandy." Coastal Engineering, 110, 102–110.
Smith, W. G., and Kriebel, D. (2004). "Timber Wave Screen Design and Repair Issues." Ports 2004, American Society of Civil Engineers, Houston, Texas, United States, 1–10.
Spalding, M. D., Ruffo, S., Lacambra, C., Meliane, I., Hale, L. Z., Shepard, C. C., and Beck, M. W. (2014). "The role of ecosystems in coastal protection: Adapting to change and coastal hazards." Ocean and Coastal Management, 90, 50–57.
Stamski, R. (2005). "The Impacts of Coastal Protection Structures in California's Monterey Bay National Marine Sanctuary." MSD-05-3. Marine Sanctuaries Conservation Series. Silver Spring, MD: U.S. Department of Commerce, National Oceanic and Atmospheric Administration. https://sanctuaries.noaa.gov/science/conservation/coast_study.html
Stevenson, J. C., Ward, L. G., and Kearney, M. S. (1988). "Sediment transport and trapping in marsh systems: Implications of tidal flux studies." Marine Geology, 80(1–2), 37–59.
Storlazzi, C. D., Reguero, B. G., Cole, A. D., Lowe, E., Shope, J. B., Gibbs, A. E., Nickel, B. A., McCall, R. T., Van Dongeren, A. R., and Beck, M. W. (2019). Rigorously Valuing the Role of U.S. Coral Reefs in Coastal Hazard Risk Reduction. Open-File Report, U.S. Geological Survey, Reston, VA, 42.
Stout, J. P. (1984). The Ecology of Irregularly Flooded Salt Marshes of the Northeastern Gulf of Mexico: A Community Profile. U.S. Department of the Interior, 115.
Subramanian, B., Martinez, J., Luscher, A., and Wilson, D. (2006). "Living Shorelines Projects in Maryland in the Past 20 Years." Management, Policy, Science, and Engineering of Nonstructural Erosion Control in the Chesapeake Bay, 49–53.
Sutton-Grier, A. E., Gittman, R. K., Arkema, K. K., Bennett, R. O., Benoit, J., Blitch, S., Burks-Copes, K. A., Colden, A., Dausman, A., DeAngelis, B. M., Hughes, A. R., Scyphers, S. B., and Grabowski, J. H. (2018). "Investing in Natural and Nature-Based Infrastructure: Building Better Along Our Coasts." Sustainability, 10(2), 523.
Sutton-Grier, A. E., Wowk, K., and Bamford, H. (2015). "Future of our coasts: The potential for natural and hybrid infrastructure to enhance the resilience of our coastal communities, economies and ecosystems." Environmental Science and Policy, 51, 137–148.
Sweet, W., Kopp, R., Weaver, C., Obeysekera, J., Horton, R., Thieler, E. R., and Zervas, C. (2017). Global and Regional Sea Level Rise Scenarios for the United States. National Oceanic and Atmospheric Administration, Silver Spring, MD, 75.
Tabb, K. (2019). "Kitty Hawk Living Shoreline to Protect Road." Coastal Review Online, <https://www.coastalreview.org/2019/01/kitty-hawk-living-shoreline-to-protect-road/> (Jan. 24, 2019).
The Nature Conservancy. (2019). "North Carolina Living Shorelines Explorer." Coastal Resilience | North Carolina, <https://maps.coastalresilience.org/northcarolina/> (Jan. 5, 2019).
Titus, J. G., Anderson, K. E., Cahoon, D. R., Gill, S. K., Gutierrez, B. T., Thieler, E. R., and Williams, S. J. (2009a). "Ongoing Adaptation." Coastal Sensitivity to Sea-Level Rise: A Focus on the Mid-Atlantic Region, U.S. Environmental Protection Agency, Washington, D.C., 157–162.
Titus, J. G., Hudgens, D. E., Trescott, D. L., Craghan, M., Nuckols, W. H., Hershner, C. H., Kassakian, J. M., Linn, C. J., Merritt, P. G., McCue, T. M., O'Connell, J. F., Tanski, J., and Wang, J. (2009b). "State and local governments plan for development of most land vulnerable to rising sea level along the US Atlantic coast." Environmental Research Letters, 4(4).
Tomiczek, T., Kennedy, A., Zhang, Y., Owensby, M., Hope, M. E., Lin, N., and Flory, A. (2017). "Hurricane Damage Classification Methodology and Fragility Functions Derived from Hurricane Sandy's Effects in Coastal New Jersey." Journal of Waterway, Port, Coastal, and Ocean Engineering, 143(5),.
Traylor, B. (2017). "Adapted management strategies for shoreline stabilization using bioengineering techniques in Ocean City, New Jersey." Shore & Beach, 85(4), 55–65.
Trump, D. (2017). Presidential Executive Order on Establishing Discipline and Accountability in the Environmental Review and Permitting Process for Infrastructure.
USACE. (2002). Coastal Engineering Manual. Engineering Manual, Department of the Army, U.S. Army Corps of Engineers, Washington, DC.
USACE. (2015). North Atlantic Coast comprehensive study: Resilient adaptation to increasing risk (main report). Final Report, U.S. Army Corps of Engineers, NY, 140.
USACE. (2017). Great Lakes Region National Shoreline Management Study. U.S. Army Corps of Engineers Institute for Water Resources, 105.
USACE. (2018). Hawaiian Islands National Shoreline Management Study. U.S. Army Corps of Engineers Institute for Water Resources, 258.
USACE. (2018b). Author communication with David Olson of USACE.
USACE. (2019a). "Regulatory In-Lieu Fee and Bank Information Tracking System." US Army Corps of Engineers, <https://ribits.usace.army.mil/ribits_apex/f?p=107:2> (Jan. 13, 2019).
USACE. (2019b). "Thin-Layer Placement of Dredged Material." Thin-Layer Placement, <https://tlp.el.erdc.dren.mil/> (May 15, 2019).
USACE. (2019c). "Sea-Level Change Curve Calculator." US Army Corps of Engineers Sea-Level Change Curve Calculator, <https://corpsmapu.usace.army.mil/rccinfo/slc/slcc_calc.html> (May 15, 2019).
USACE. (2019d). "Coastal Hazards System." US Army Corps of Engineers Coastal Hazards System, <https://chs.erdc.dren.mil/> (May 15, 2019).
USEPA. (2015a). "National Menu of Best Management Practices (BMPs) for Stormwater." Overviews and Factsheets. National Menu of Best Management Practices (BMPs) for Stormwater, <https://www.epa.gov/npdes/national-menu-best-management-practices-bmps-stormwater> (Mar. 15, 2019).
USEPA. (2015b). "Wetlands Compensatory Mitigation." <https://www.epa.gov/sites/production/files/2015-08/documents/compensatory_mitigation_factsheet.pdf> (Feb. 15, 2019).
USGCRP. (2017). NCA4, Volume I. U.S. Global Change Research Program, Washington, DC, 470.
VIMS. (2019). "Comprehensive Coastal Resource Management Portals (CCRMPs) | Virginia Institute of Marine Science." Virginia Institute of Marine Science, <https://www.vims.edu/ccrm/ccrmp/index.php> (Feb. 15, 2019).
Walling, K., Miller, J. K., Herrington, T. O., and Eble, A. (2014). "Comparison of Hurricane Sandy impacts in three New Jersey coastal communities." Proceedings of the Coastal Engineering Conference, Lynett P., ed., American Society of Civil Engineers (ASCE).
Walling, K. R., Herrington, T. O., and Miller, J. K. (2015). "Comparison of Damage Mechanisms to Oceanfront Structures Protected by a Beach and Dune System with vs. without a Rock Seawall during Hurricane Sandy." In: Proceedings of the Coastal Structures and Solutions to Coastal Disasters Joint Conference 2015, American Society of Civil Engineers (ASCE), 80–87.
WIIN Act (2016). Water Infrastructure Improvements for the Nation Act.
Webb, B. M., and Allen, R. (2015). "Wave transmission through artificial reef breakwaters." In: Proceedings of the Coastal Structures and Solutions to Coastal Disasters Joint Conference 2015, American Society of Civil Engineers (ASCE), 432–441.
Whalen, L., Kreeger, D., Bushek, D., Moody, J., and Padeletti, A. (2011). Practitioner's Guide: Shellfish-Based Living Shorelines for Salt Marsh Erosion Control and Environmental Enhancement in the Mid-Atlantic.
White House. (2018). Memorandum of Understanding Implementing One Federal Decision under Executive Order 13807. Washington, DC.
Woods Hole Group. (2017). Living Shorelines in New England: State of the Practice. 55.
World Bank. (2017). Implementing nature-based flood protection: Principles and implementation guidance. World Bank, Washington, DC.
Wowk, K. M., and Yoskowitz, D. (2017). "Socioeconomic and Policy Considerations of Living Shorelines - US Context." Living Shorelines: The Science and Management of Nature-based Coastal Protection, M. Mitchell, M. La Peyre, J. Toft, and D. M. Bilkovic, eds., CRC Press, Taylor & Francis Group.
Yepsen, M., Moody, J., and Schuster, E. (2016). A Framework for Developing Monitoring Plans for Coastal Wetland Restoration and Living Shoreline Projects in New Jersey. National Oceanic and Atmospheric Administration, 57.
Zhang, K., Liu, H., Li, Y., Xu, H., Shen, J., Rhome, J., and Smith, T. J. (2012). "The role of mangroves in attenuating storm surges." Estuarine, Coastal and Shelf Science, 102–103, 11–23.
The following references were used in the creation of Table 2-4 and some are used elsewhere in the document and also listed above:
Beavers, R. L., Babson, A. L., and Schupp, C. A. (2016). Coastal Adaptation Strategies Handbook. National Park Service, Washington, D.C., 160.
Bowlsby, R., Courtain, K., Dumouchel, R., Hansen, F., and Theriault, A. (2016). Shoreline Protection Options for Humboldt Bay. Humboldt State University, 45.
Boyd, C. (2007). Shoreline Protection Products: Cost Estimates. Mississippi-Alabama Sea Grant Consortium, 2.
Brown, S. D., Ruddock, K., and Smith, R. (2014). "Living Shorelines: Non-Structural Erosion Control Practices."
Bryars, R. (2016). Living Shorelines: A Technical Guide for Contractors in Alabama and Mississippi. Baldwin County Soil and Water Conservation District, 43.
Carter, J., Agarwal, A., Connor, C., Harter, C., Fenical, S., and Bermudez, H. (2014). Living Shoreline Demonstration Project: Coastal Engineering Alternatives Analysis. 60.
Carter, J., Agarwal, A., Connor, C., and Todd, J. (2015a). Living Shoreline Demonstration Project for Jefferson Parish: Coastal Engineering and Alternatives Analysis. 35.
Carter, J., Connor, C., Agarwal, A., Harter, C., Fenical, S., and Bermudez, H. (2015b). Living Shoreline Demonstration Project: Prepared for Louisiana Coastal Protection and Restoration Authority. 50.
Carter, J., Fenical, S., Harter, C., and Todd, J. (2015c). "CFD Modeling for the Analysis of Living Shoreline Structure Performance." Proceedings of the Coastal Structures and Solutions to Coastal Disasters Joint Conference 2015, ASCE, Boston, MA, 442–450.
Caulk, A., Gannon, J. E., Shaw, J. R., and Hartig, J. H. (2000). Best Management Practices for Soft Engineering of Shorelines. Greater Detroit American Heritage River Initiative, Detroit, MI, 85.
CBF. (2007). Living Shorelines for the Chesapeake Bay Watershed. Chesapeake Bay Foundation, Annapolis, MD, 12.
Davis, J. L., and Luscher, A. (2006). "Incentives to Promote Living Shoreline Techniques in the Chesapeake Bay." In: Proceedings of the 2006 Living Shoreline Summit, 10.
DeVore, D. L. (2010). Cost and Maintenance of Living Shorelines.
Faulkner, D. (2010). Treating Shoreline Erosion: A Concise Guide for Homeowners. USDA/NRCS, Virginia, 10.
Fear, J., and Currin, C. (2012). Sustainable Estuarine Shoreline Stabilization: Research, Education and Public Policy in North Carolina. 151.
GBF. (2011). Living Shorelines: A Natural Approach to Erosion Control. Galveston Bay Foundation, 32.
Gittman, R. K., Popowich, A. M., Bruno, J. F., and Peterson, C. H. (2014). "Marshes with and without sills protect estuarine shorelines from erosion better than bulkheads during a Category 1 hurricane." Ocean & Coastal Management, 102, 94–102.
Hardaway, C. S., Milligan, D. A., and Duhring, K. (2010). Living Shoreline Design Guidelines for Shore Protection in Virginia's Estuarine Environments. Special Report in Applied Marine Science and Ocean Engineering, Virginia Institute of Marine Science, Gloucester Point, VA, 123.
Hardaway, C. S., Milligan, D., O'Brien, K., Wilcox, C., Berman, M., Killeen, S., Rudnicky, T., and Nunez, K. (2008). Occohannock Creek Shoreline Erosion Assessment and Living Shoreline Options. Virginia Institute of Marine Science, Gloucester Point, VA, 61.
Hoffman, E., and Ries, T. (2016). "The Costs of Shoreline Stabilization." Jacksonville, FL.
LaClergue, S. G. (2009). Green Shorelines: Bulkhead Alternatives for a Healthier Lake Washington. City of Seattle, Washington, 36.
Luscher, A., and Hollingsworth, C. (2005). Shore Erosion Control: The Natural Approach. National Oceanic and Atmospheric Administration, 6.
Luscher, A., and Hollingsworth, C. (2007). Shore Erosion Control: The Natural Approach. National Oceanic and Atmospheric Administration, 12.
MACZM. (2016). "StormSmart Properties Comparison Chart: Relative Costs of Shoreline Stabilization Options." Massachusetts Office of Coastal Zone Management.
MBNEP. (2014). Living Shorelines: A Guide for Alabama Property Owners. Mobile Bay National Estuary Program, Mobile, AL, 32.
Milligan, D., and Hardaway, C. S. (2010). Mathews County Shoreline Management Program. Virginia Institute of Marine Science, 4.
NCDCM. (2014). Living Shorelines Strategy. North Carolina Division of Coastal Management, 21.
Nichols, K., and Brzozowski, A. (2014). A Landowner's Guide to Protecting Shoreline Ecosystems. Island Planners, 48.
NJRCI. (2016). A Community Resource Guide for Planning Living Shorelines Projects. New Jersey Resilient Coastlines Initiative, 15.
NRC Solutions. (n.d.). "Living Shorelines." Naturally Resilient Communities, <http://nrcsolutions.org/living-shorelines/> (Jan. 17, 2018).
PDE. (2012). Living Shorelines: Healthy Shores, Healthy Communities. Partnership for the Delaware Estuary, Inc., Delaware, 6.
RAE. (2015). Living Shorelines: from Barriers to Opportunities. Restore America's Estuaries, Arlington, VA, 55.
Rella, A., and Miller, J. (2012a). A Comparative Cost Analysis of Ten Shore Protection Approaches at Three Sites Under Two Sea Level Rise Scenarios. Stevens Institute of Technology, Hoboken, NJ, 130.
Rella, A., and Miller, J. (2012b). Engineered Approaches for Limiting Erosion along Sheltered Shorelines: A Review of Existing Methods. Stevens Institute of Technology, Hoboken, NJ, 104.
Reston Association. (2006). Shoreline Stabilization Guidelines. 18.
Sparks, E. (2017). "Living Shorelines: Alternatives to Hardened Shorelines." Ocean Springs, MS.
Stamski, R. (2005). The Impacts of Coastal Protection Structures in California's Monterey Bay National Marine Sanctuary. Marine Sanctuaries Conservation Series, National Oceanic and Atmospheric Administration, Silver Spring, MD, 26.
Subramanian, B. (2010). "Living Shorelines Projects: Do They Work?" Maryland.
Subramanian, B. (2013). "Maryland's Living Shorelines Program." Maryland.
Swann, L. (2008). "The Use of Living Shorelines to Mitigate the Effects of Storm Events on Dauphin Island, Alabama, USA." American Fisheries Society Symposium, 12.
VIMS. (2014). Living Shoreline Implementation: Challenges and Solutions. Rivers & Coast, Virginia Institute of Marine Science, Gloucester Point, VA, 9.
Zelo, I., Shipman, H., and Brennan, J. (2000). Alternative Bank Protection Methods for Puget Sound Shorelines. Ecology Publication, Washington Dept. of Ecology, Washington, 137.
2 23 CFR § 450.206 (a).
3 23 CFR § 450.216, Development and content of the long-range statewide transportation plan and 23 CFR § 450.324, Development and content of the metropolitan transportation plan.
4 23 CFR § 450.216, Development and content of the long-range statewide transportation plan and 23 CFR § 450.324, Development and content of the metropolitan transportation plan.
5 23 CFR § 450.214, Development of programmatic mitigation plans and 23 CFR § 450.320, Development of programmatic mitigation plans.
7 Representatives from the Bureau of Land Management, U.S. Environmental Protection Agency, FHWA, NOAA Fisheries Service, National Park Service, USACE, U.S. Department of Agriculture Forest Service, U.S. Fish and Wildlife Service, the Knik Arm Bridge and Toll Authority, and several State DOTs, including North Carolina DOT, Vermont Agency of Transportation, and Washington DOT contributed to the completion of Eco-Logical.
8 Take as defined under the ESA means "to harass, harm, pursue, hunt, shoot, wound, kill, trap, capture, or collect, or to attempt to engage in any such conduct" (16 U.S.C. § 1531 et seq.).
9 Essential Fish Habitat is defined under the 1996 amendments to the Magnuson-Stevens Fishery Conservation and Management Act, or Magnuson-Stevens Act, as "those waters and substrate necessary to fish for spawning, breeding, feeding or growth to maturity" (16 U.S.C. § 1801 et seq.).
10 Programmatic mitigation planning is addressed in 23 CFR § 450.214, Development of Programmatic Mitigation Plans.

