U.S. Department of Transportation
Federal Highway Administration
1200 New Jersey Avenue, SE
Washington, DC 20590
202-366-4000
Freight Economy
Date: May 2, 2016
Our Host: Port Authority of New York and New Jersey
| HIGHWAYS | I-95, I-287, I-495, I-80, I-78, I-87, I-78, I-280, US-1&9, I-84, I-380, I-81, I-684, I-487 | |
| RAILROADS | CSX, Norfolk Southern, Canadian Nat’l, and Canadian Pacific Railways; Oak Island, Oak Point, Croxton, Kearny, Greenville, 65th, Fresh Pond, and North Bergen Yards; Port Authority ExpressRail; and Brookhaven Rail Terminal | |
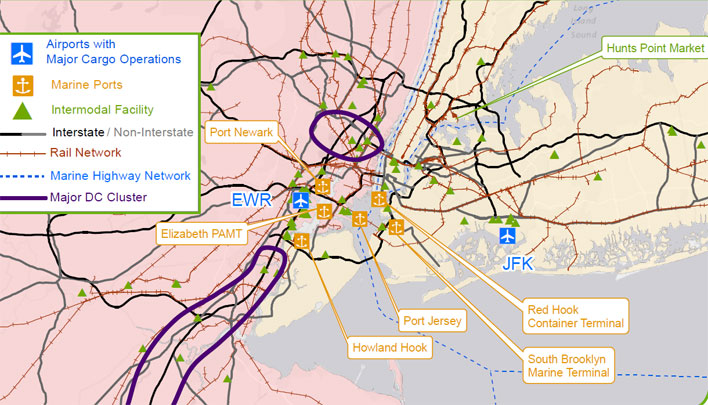
| AIRPORTS | JFK International Airport- NY, Newark Liberty International Airport-NJ | |
| WATERBORNE | Port Newark; the Elizabeth-Port Authority, Howland Hook, Brooklyn-Port Authority, Port Jersey Port Authority, and the South Brooklyn Marine Terminals; and the Red Hook Container Terminal. | |
| FREIGHT CLUSTER | Food distribution center Hunts Point Market, supply chain spine Northern NJ Warehouse, millions sq-feet NJ Turnpike 8A Interchange, Bayway Refinery (NJ), and retail/restaurant/parcel Manhattan Central Business District |
Source: PANYNJ, NJDOT, NYSDOT, NYCDOT
Data represents freight activity for NY Metro region ( NY/NJ/CT/PA)
| Commodity | Value (millions $) | % of total |
|---|---|---|
| Misc. mfg. prods. | 544,003 | 16% |
| Electronics | 364,348 | 11% |
| Pharmaceuticals | 296,902 | 9% |
| Mixed freight | 202,522 | 6% |
| Machinery | 172,037 | 5% |
| All commodities | 3,331,581 | 100% |
| Commodity | Tons (thousands) | % of total |
|---|---|---|
| Natural gas (Coal-n.e.c.) | 158,845 | 14% |
| Nonmetal min. prods. | 122,272 | 11% |
| Other foodstuffs | 102,220 | 9% |
| Gravel | 94,675 | 8% |
| Waste/scrap | 79,216 | 7% |
| All commodities | 1,161,701 | 100% |
| Trade partner | Tonnage | % of total |
|---|---|---|
| New York | 77,985 | 31% |
| Connecticut | 33,724 | 13% |
| Pennsylvania | 33,158 | 13% |
| New Jersey | 30,506 | 12% |
| Canada | 22,047 | 9% |
| Total outbound | 254,561 | 100% |
| Trade partner | Tonnage | % of total |
|---|---|---|
| Pennsylvania | 113,801 | 27% |
| Canada | 37,582 | 9% |
| Eastern Asia | 33,346 | 8% |
| Europe | 25,847 | 6% |
| New York | 25,007 | 6% |
| Total inbound | 427,500 | 100% |
Based on FAF4.1 data with base year 2012 and forecasts up to 2045
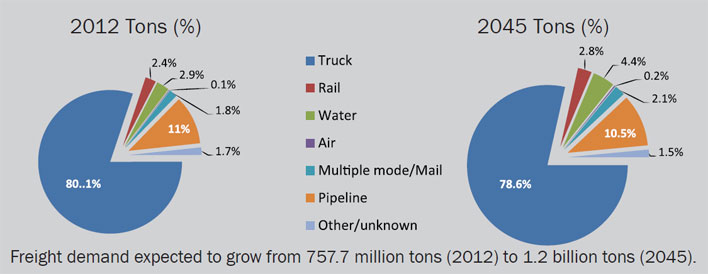
Between 2012 and 2045, NY metro will see freight activity grow by about 50% in tonnage and will more than double in value.
In 2014, annual congestion costs in the New York- Newark NY-NJ-CT region were estimated at $17.7 billion and ranked as the highest in the nation.
In 2013, the New York region’s (Northern NJ-Long Island, NY-NJ-PA) GDP alone ranked 13th among the world’s nations, next to Australia and ahead of South Korea.
About one-third of the NY metro’s employment is generated by freight-intensive industries
The Port of NY & NJ is the largest marine port on the East coast, third largest in North America, and the 27th in the world. In 2015, the PANYNJ handled nearly 6.4 million containers (TEUs) and over 477,000 vehicles. JFK is the number one international air freight gateway in the US by value of shipments.
The I-95 corridor across NJ and NYC is a critical regional and national highway bottleneck (Cross Bronx Expressway, George Washington Bridge connecting New York and New Jersey, including the New Jersey Turnpike.)
The JFK Travel Plaza truck parking lot is the only public lot in NYC. The next nearest lots are in Commack, Long Island and across the George Washington Bridge at the Vince Lombardi rest area.
The NY metro’s share of international freight by value is projected to grow from 20% in 2012 to about 40% in 2045.
For both inbound and outbound freight, Europe is projected to be the NY metro’s largest freight trading partner by value by 2045.
Trucks represent the NY metro’s predominant freight carrier now and into the future. Trucks currently carry almost 80% of freight.
Sources for Freight Facts: FAF4 Data, US DOT Freight Fact and Figure, TTI 2015 Urban Mobility Scorecard,NYMTC, NJTPA, NYC, PANYNJ, NYSDOT, NJDOT
To view PDF files, you can use the Adobe® Reader®.

