

Excerpt from First Progress Report of the Highway Cost Allocation Study
| Year | Motor - vehicle travel | Number of registered vehicles1 | Average travel per vehicle | ||||
|---|---|---|---|---|---|---|---|
| Main rural road travel | Local rural road travel | Total rural travel | Urban travel | Total travel | |||
| Million vehicle miles | Million vehicle miles | Million vehicle miles | Million vehicle miles | Million vehicle miles | Thousands | Miles | |
| Passenger cars2 | 178,732 | 84,356 | 263,088 | 224,452 | 487,540 | 52,092 | 9,359 |
| Buses: Commercial | 1,152 | 300 | 1,452 | 1,804 | 3,256 | 96 | 34,035 |
| School and nonrevenue | 623 | 504 | 1,127 | 124 | 1,251 | 159 | 7,836 |
| All buses | 1,775 | 804 | 2,579 | 1,928 | 4,507 | 255 | 17,658 |
| All passenger vehicles | 180,507 | 85,160 | 265,667 | 226,380 | 492,047 | 52,347 | 9,400 |
| Trucks and combinations | 47,481 | 23,005 | 70,486 | 40,901 | 111,387 | 10,413 | 10,697 |
| All vehicles | 227,988 | 108,165 | 336,153 | 267,281 | 603,434 | 62,760 | 9,615 |
- Registration figures differ slightly from those in Bureau of Public Roads table MV - 1 because of adjustments in classification in a few States.
- Includes taxicabs.
| Year | All vehicles, vehicle - miles | Passenger cars | Buses | Trucks and combinations | |||
|---|---|---|---|---|---|---|---|
| Percentage of all vehicles | Vehicle - miles | Percentage of all vehicles | Vehicle - miles | Percentage of all vehicles | Vehicle - miles | ||
| Millions | Millions | Millions | Millions | ||||
| 1940 | 302,188 | 82.60 | 249,604 | 0.88 | 2,657 | 16.52 | 49,927 |
| 1945 | 250,173 | 80.02 | 200,199 | 1.53 | 3,832 | 18.45 | 46,142 |
| 1945:1940 ratio | .83 | .97 | .80 | 1.74 | 1.44 | 1.12 | .92 |
| 1950 | 458,246 | 79.35 | 363,613 | .89 | 4,081 | 19.76 | 90,552 |
| 1950:1945 ratio | 1.83 | .99 | 1.82 | .58 | 1.06 | 1.07 | 1.96 |
| 1950:1940 ratio | 1.52 | .96 | 1.46 | 1.01 | 1.54 | 1.20 | 1.81 |
| 1955 | 603,434 | 80.79 | 487,540 | .75 | 4,507 | 18.46 | 111,387 |
| 1955:1950 ratio | 1.32 | 1.02 | 1.34 | .84 | 1.10 | .93 | 1.23 |
| 1955:1945 ratio | 2.41 | 1.01 | 2.44 | .49 | 1.18 | 1.00 | 2.41 |
| 1955:1940 ratio | 2.00 | .98 | 1.95 | .85 | 1.70 | 1.12 | 2.23 |
| Year | All vehicles, vehicle - miles | Passenger cars and buses | All trucks and truck combinations | Single - unit trucks | Truck combinations | ||||
|---|---|---|---|---|---|---|---|---|---|
| Percentage of all vehicles | Vehicle - miles | Percentage of all vehicles | Vehicle - miles | Percentage of all trucks and truck combinations | Vehicle - miles | Percentage of all trucks and truck combinations | Vehicle - Miles | ||
| Millions | Millions | Millions | Millions | Millions | |||||
| 1940 | 109,815 | 80.80 | 88,715 | 19.20 | 22,100 | 79.10 | 16,699 | 20.90 | 4,401 |
| 1945 | 85,792 | 78.00 | 66,885 | 22.00 | 18,907 | 71.90 | 13,602 | 28.10 | 5,305 |
| 1945:1940 ratio | .78 | .97 | .75 | 1.15 | .90 | .91 | .81 | 1.34 | 1.21 |
| 1950 | 174,349 | 77.20 | 134,527 | 22.80 | 39,822 | 68.40 | 27,257 | 31.60 | 12,565 |
| 1950:1945 ratio | 2.03 | .99 | 2.01 | 1.04 | 2.11 | .95 | 2.00 | 1.12 | 2.37 |
| 1950:1940 ratio | 1.59 | .96 | 1.52 | 1.19 | 1.90 | .86 | 1.63 | 1.51 | 2.86 |
| 1955 | 227,988 | 79.20 | 180,507 | 20.80 | 47,481 | 67.80 | 32,173 | 32.20 | 15,308 |
| 1955:1950 ratio | 1.31 | 1.08 | 1.34 | .91 | 1.19 | .99 | 1.18 | 1.02 | 1.22 |
| 1955:1945 ratio | 2.66 | 1.02 | 2.70 | .95 | 2.51 | .94 | 2.37 | 1.15 | 2.89 |
| 1955:1940 ratio | 2.08 | .98 | 2.03 | 1.08 | 2.25 | .86 | 1.93 | 1.54 | 3.48 |
Figure 1. Total travel, motor-vehicle registration, motor-fuel consumption, and gross national product, 1936-55, as percentages of the respective amounts in 1950.
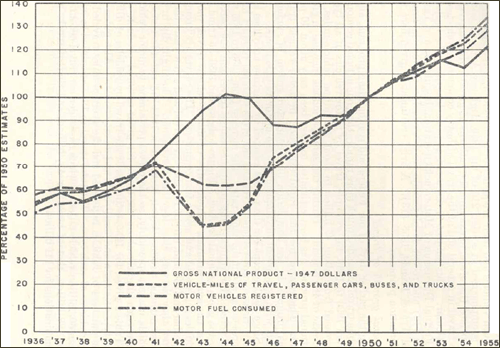
Figure 2. Ton-miles carried by trucks and truck combinations on main rural roads, 1936-55.
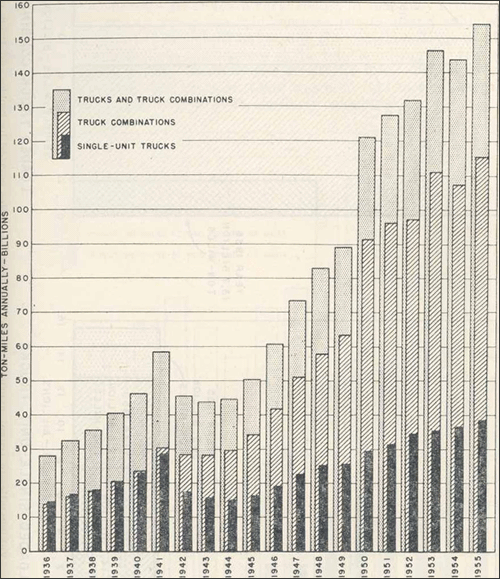
Figure 3. Vehicle-miles of travel, average carried load, and ton-miles carried by trucks and truck combinations on main rural roads in 1955 compared with 1936 and 1950.
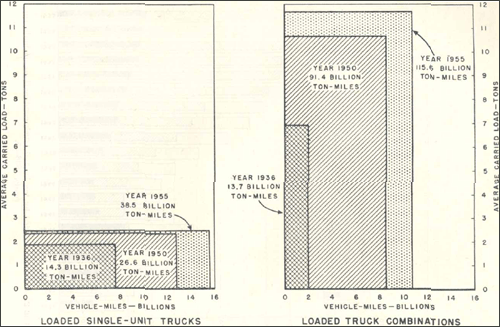
Figure 4. Number of gross loads of 30,000, 40,000, and 50,000 pounds or more, per 1,000 loaded and empty trucks and truck combinations, on main rural roads in the summers of 1942-55 and a pre-war year.
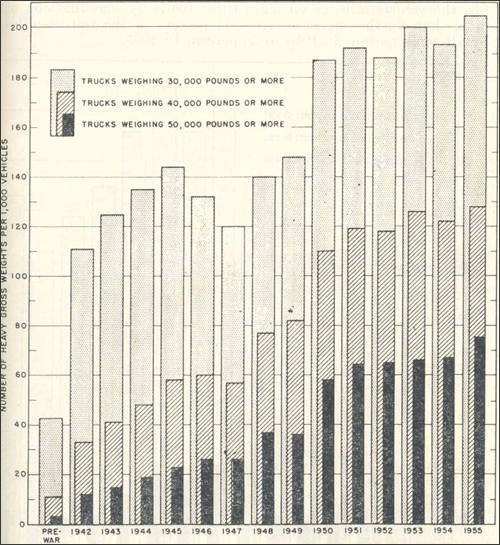
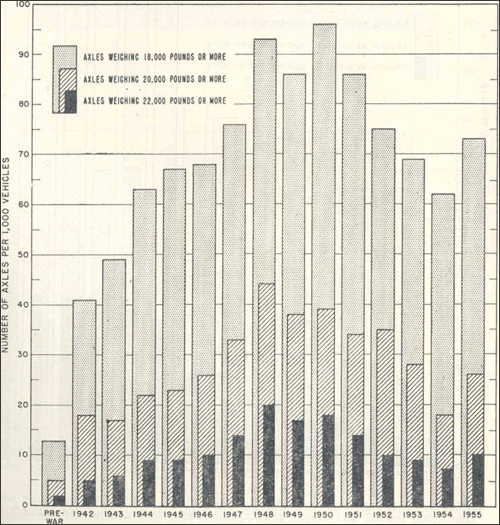
Figure 5. Number of axles weighing 18,000, 20,000, and 22,000 pounds or more, per 1,000 trucks and truck combinations, on main rural roads in the summers of 1942-55 and a pre-war year.
- Table 2.
Table 2 shows estimated travel by vehicles of different types - passenger cars, buses, all passenger vehicles, and trucks and combinations - on main and local roads and on city streets in 1955. It also presents the numbers of vehicles registered and the average miles traveled by vehicles of each type. Registrations totaled 52,092,000 passenger cars; 255,000 buses of all types, including commercial and school buses; and 10,413,000 single-unit trucks and truck combinations. Total travel in 1955 amounted to more than 603 billion vehicle-miles, of which passenger-car travel accounted for 488 billion, that of buses for 4½ billion, and that of trucks and combinations for 111 billion. - Table 3.
Table 3 compares vehicle-miles of travel on all roads and streets by motor vehicles of different types (passenger cars, buses, and trucks and combinations) for 1940, 1945, 1950, and 1955. From 1940 to 1950, vehicle-miles of travel increased 81 percent for trucks and truck combinations and 46 percent for passenger cars. From 1950 to 1955, the increase was 23 percent for trucks and truck combinations and 34 percent for passenger cars. - Table 4.
Table 4 shows the same relationships among vehicle-miles of travel by motor vehicles of different types as depicted in table 3, but restricted to main rural roads for the years 1940, 1945, 1950, and 1955. The term "main rural roads" covers roads that are part of the Federal-aid primary system, including roads designated under the Federal-Aid Highway Act of 1944 as part of the Interstate System, and other primary State highways, including turnpikes, outside of cities. The roads total 13 percent of the total 3 million rural road miles. Some of the key figures in the table are:- In 1940, all vehicles totaled 110 billion vehicle-miles traveled; in 1955, the total had doubled to 228 billion.
- Vehicle-miles traveled by passenger cars and buses increased from 89 billion in 1940 to 180 billion in 1955. As a percentage of total vehicle miles of travel, passenger cars constituted roughly 80 percent throughout the period covered by the table - 81 percent of all vehicles in 1940 and 79 percent in 1955.
- Vehicle-miles of travel by all trucks and truck combination more than doubled, from 21 billion in 1940 to 47 billion in 1955. Single-unit trucks, including vans and other trucks used mostly in short hauls for freight or personal freight, doubled (17 billion vehicle-miles of travel in 1940 compared with 32 billion in 1955. Truck combinations, most often used in interstate freight operations, tripled from 4 billion vehicle-miles of travel in 1940 to 15 billion in 1955.
- Figure 1.
Figure 1 shows the trends from 1936 to 1955 for gross national product (GNP), vehicle-miles of motor-vehicle travel, motor vehicles registered, and motor fuel consumed as percentages of the respective amounts in 1950. Except for the war years (1941-1945) and the post-war period, the curves lie very close together throughout. During the war, GNP increased significantly, exceeding the 1950 GNP. However, the factors related to motor vehicles declined to less than half their total in 1950 because of wartime rationing of gasoline and rubber. After the war, the lines representing motor vehicle factors began increasing as the line representing GNP declined as the economy adjusted from its wartime high to reflect the post-war economic boom brought about by consumer demand. The curves come together again in 1950 and continue on an upward trend. The figure shows a slight dip in the GNP during the recession of 1954 but the decline did not affect motor-vehicle usage appreciably, so the curves pertaining to motor vehicles - travel, registration, and fuel consumed - rose slightly above the curve for GNP through 1955. - Figure 2.
Figure 2 reflects the growing importance of trucks in freight transportation by depicting the ton-miles of load carried by trucks and truck combinations on main rural roads in each year from 1936 to 1955, inclusive. The term "ton-mile" refers to the shipment of 1 ton of freight 1 mile - it is considered the primary measure of freight transportation because it reflects volume (tons) and distance (miles). In 1936, trucks hauling on main rural roads - Federal-aid primary routes, including the Interstate System, and primary State roads, including turnpikes - amounted to 28 billion ton-miles. In 1955 the total had increased to 154 billion ton-miles, an increase of 450 percent, compared to an increase of 208 percent in truck vehicle-mileage. - Figure 3.
The growth in ton-mileage by single-unit trucks and truck combinations from 1936 to 1955 is illustrated in another manner in Figure 3. Ton-mileage - a "ton-mile" is 1 ton of freight shipped 1 mile - is the product of the vehicle-mileage traveled by loaded vehicles and the average tonnage carried per vehicle. In separate rectangles for single-unit trucks and truck combinations, this chart shows ton-mileage as the product of vehicle-mileage for loaded vehicles of each type and average carried loads. The rectangle for single-unit trucks, which are used for short hauls and personal transportation of goods, shows that ton-mileage increased from 14.3 billion in 1936 to 38.5 billion in 1955. This increase occurred mainly because of an increase in the mileage traveled by loaded vehicles, because the average carried load for this class of vehicles increased very little, especially from 1950 to 1955. The rectangle for truck combinations, which are commonly used in interstate freight transportation, shows explosive growth in ton-mileage from 13.7 billion in 1936 to 115.6 billion in 1955. The increase resulted from a substantial increase in the average carried load for truck combinations and a much greater proportional increase in mileage traveled by loaded vehicles. - Figure 4.
In Figure 4, a bar graph is used to show the increasing frequency of heavy loads on main rural roads. In 1936, vehicles with a gross weight of 50,000 pounds or more averaged only 3 per thousand trucks and combinations encountered on main rural roads; in 1955 they averaged 75 per thousand, a twenty-five fold increase per thousand vehicles. But, since there was a threefold increase in the vehicle-mileage of all trucks and combinations, the increase in the vehicle-mileage by trucks weighing 50,000 pounds or more was 3 X 25=75-fold. For vehicles weighing 40,000 pounds or more, a 35-fold increase occurred in the vehicle-mileage from 1936 to 1955, similarly calculated. - Figure 5.
Figure 5 is a bar graph depicting the number of heavy axleloads - 18,000, 20,000, and 22,000 pounds per axle. From the point of view of highway costs, the frequency of heavy axleloads is of more significance than the frequency of heavy gross loads. This is because the impact of weight on a pavement - the loadings it must absorb - varies based on the number of axles the weight is distributed among. Figure 5 compares heavy axleloads per thousand trucks and combinations for the prewar period from 1936 to 1941 and each year from 1942 to 1955. Heavy axleloads increased very rapidly from the prewar period to 1948. However, from 1948 to 1950, axleloads leveled off and from 1950 to 1954 a substantial decline occurred in the frequency of heavy axleloads in the three categories shown.