


MassDOT Incorporates Equity Factors into Pedestrian Safety Analysis
The Massachusetts Department of Transportation (MassDOT) wanted to identify safety improvements to help produce more equitable outcomes for pedestrian safety and mobility. The agency began by using traditional data elements that are known to correlate with risk of pedestrian deaths, such as roadway and infrastructure factors like speed limit and number of lanes. MassDOT then went a step further in its safety analysis and included equity and environmental justice (EJ) factors to consider the needs of vulnerable populations based on socioeconomic data.
The study, funded through a grant by the U.S. DOT under its Safety Data Initiative competition, confirmed that socioeconomic characteristics can be related to pedestrian safety.
“We’ve heard that socioeconomic characteristics can correlate with severe pedestrian crashes,” said MassDOT safety engineer Bonnie Polin. “This study helped us highlight that this correlation is present in Massachusetts—we’re actually seeing the data and saying ‘yes, these data can point to risk.’”
Traditional risk factors were also analyzed. MassDOT found the majority of fatal and serious injury pedestrian crashes occurred on roads that had posted speed limits of 35 miles per hour and less and were two-way with an undivided configuration. These roads also had an annual average daily traffic of 9,000 vehicles per day for some functional classes and 15,000 vehicles per day for others; were principal arterial, minor arterial, and major collector roads; and had two travel lanes.
Adding the equity and EJ factors via socioeconomic data gave a more complete picture. That data showed fatal and serious injury crash risks were higher in communities with at least one EJ factor present.
“If the road segment is located within an area that has a high percentage of low-income households, a higher percentage of non-English speakers, or lower employment rates, the road segment has an elevated risk and is therefore assigned a higher score,” Polin said.
The value of this type of systemic analysis is that, by identifying more risk factors, agencies can prioritize and apply countermeasures proactively, likely preventing some crashes from happening.
“The systemic approach is one of our strongest safety strategies,” said Jerry Roche, data-driven safety analysis program manager for FHWA. “It is exciting to see States incorporate more and more factors into their analysis. That means more lives saved.”
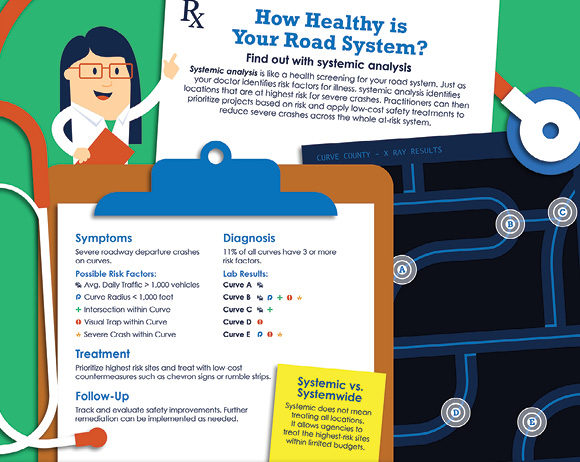
Systemic analysis identifies roadway locations that are at highest risk for severe crashes, allowing agencies to prioritize and apply countermeasures proactively. Watch a video from the FHWA Office of Safety to learn the concepts behind this type of data-driven safety analysis.
Credit: FHWAPolin said considering this wider spectrum of risk factors can help MassDOT address pedestrian safety from even more fronts.
“We look at both ways of solving the problem. If we’re seeing high crash locations—high crash intersections, locations where there are a lot of run-off-the-road crashes—we can address those with projects,” she said. “But we also want to know where the risks are. So, not only the crashes that are occurring, but where the crashes could occur so we can address those and be proactive.”
MassDOT used the results of the study to develop a safety analysis tool that uses these data to pinpoint the top 5 percent of Massachusetts road segments that have the highest risk for fatal or serious injury crashes. The tool uses a broad base of factors, including roadway conditions like traffic volume and whether a median is present, as well as socioeconomic variables like employment density and ratio of population living in poverty.
The data inform the investments—which projects to prioritize, how much and what kind of funding may be applied to projects, and agency evaluation of whether project processes are equitable.
“A lot has come out now with bringing equity into the equation. Are our funds being distributed in a way that promotes equitable outcomes for all users? We have to look at this from the lens of equity,” Polin said, emphasizing the analysis considered all the data, not just equity. “The data are telling us where to focus our resources and our funds. It happens to be the needs are elevated in environmental justice communities, which guides us to improve safety for all road users.”
The result is agencies investing safety dollars with more confidence.
“The data are driving this home,” Polin concluded. “We try to use data-driven processes to get to safety enhancements, and the data are directing us here. That, to me, is the step we need to take.”
—MORE INFORMATION
Read the MassDOT report summarizing the socioeconomic and demographic risk factor analysis performed for pedestrian crashes.
Contact Jerry Roche, FHWA Office of Safety, for more information on data-driven safety analysis.
Taking the Systemic Approach to Safety
The systemic approach to safety identifies locations based on high-risk roadway features correlated to particular crash types, rather than crash frequency, to proactively improve locations based on risk. To help practitioners implement this approach, FHWA developed the Systemic Safety Project Selection Tool, which presents a process for incorporating systemic safety planning into traditional safety management processes.
Crash trees can also be used as part of systemic analysis to identify focus crash types and facilities. FHWA developed a Crash Tree Maker (80MB download) that automates the process and makes it easier to try different combinations. Learn more from this tutorial video.
Notice: The U.S. Government does not endorse products or manufacturers. Trademarks or manufacturers’ names appear in this article only because they are considered essential to the objective of the document.
Recommended Citation: U.S. Department of Transportation, Federal Highway Administration - Washington, DC (2022) Innovator Newsletter, July/August 2022, Volume 16 (91). https://doi.org/10.21949/1521845