Value Capture: Capitalizing on the Value Created by Transportation - Presentation
October 22, 2018
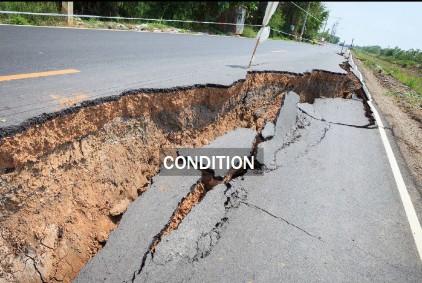
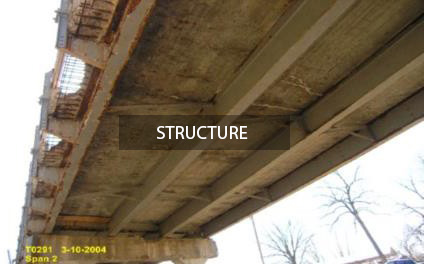
What is Value Capture?
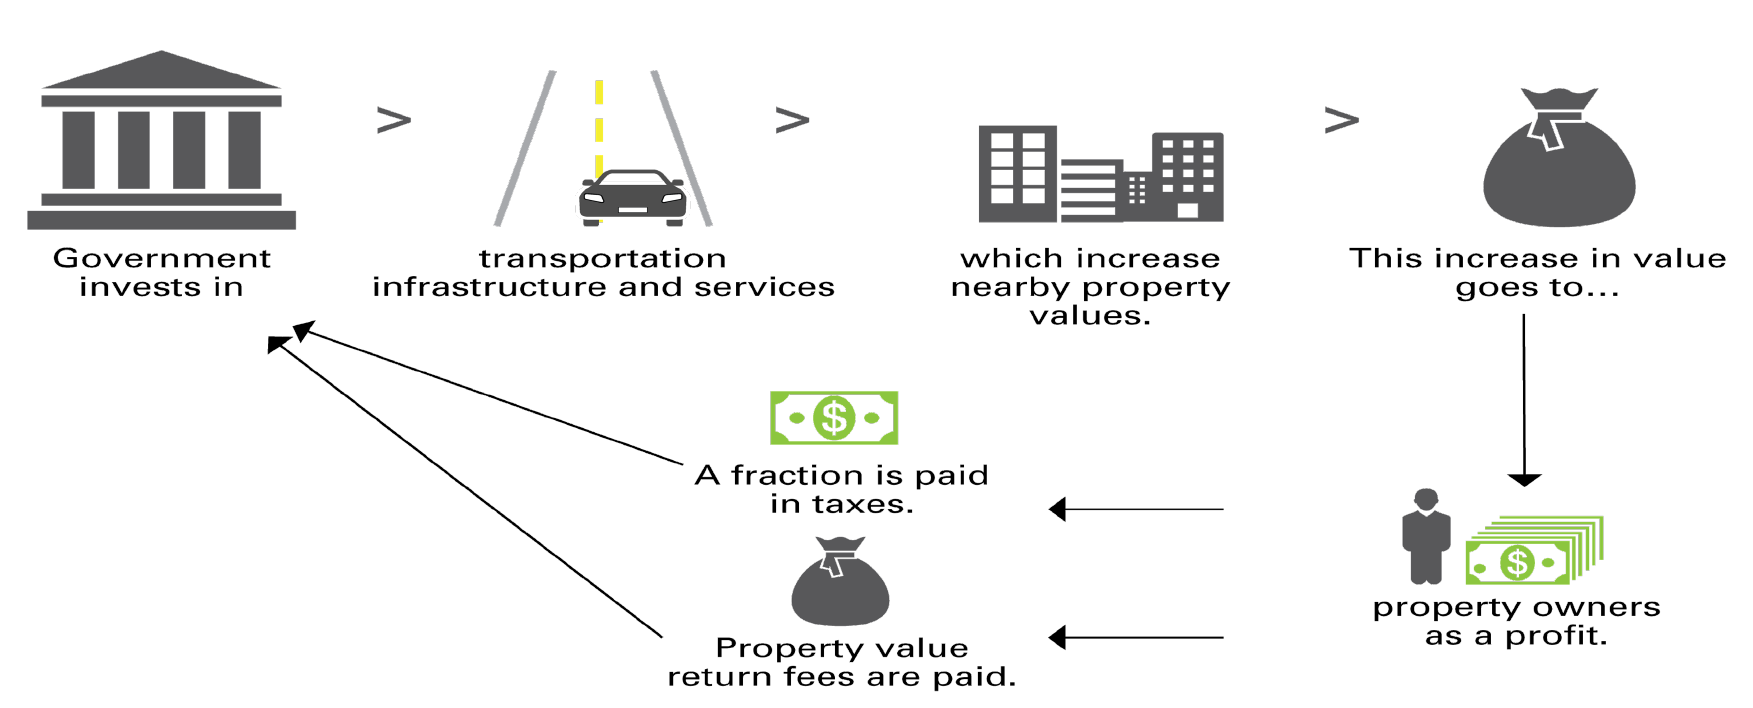
- Government invests in infrastructure and services which increase nearby property values.
- This increase in value goes to property owners as a profit.
- A fraction is paid in taxes.
- Property value return fees are paid.
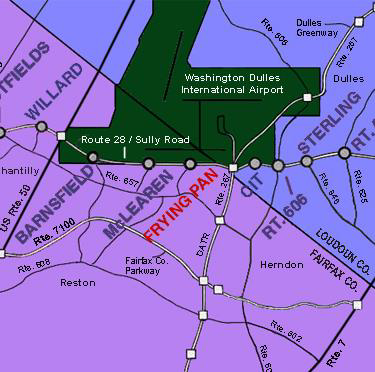
Example: Value Capture Funds Corridor Improvement
Virginia Route 28 Transportation Improvement District
- District formed in 1987 jointly by Loudon and Fairfax Counties
- Maximum tax rate of $0.20 per $100 of assessed value
- Raises ~ $23 million in revenue
- $138 million, 14-mile widening from two to six lanes completed in 1991
- District and State share project costs 75/25
Virginia Route 28 Transportation Improvement District project profile
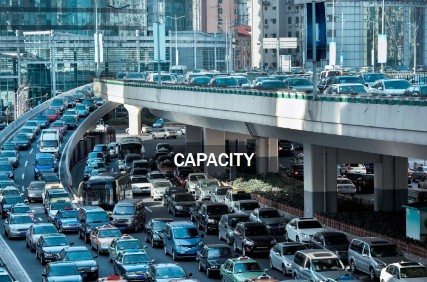
Why is Value Capture Needed?

Value Capture Overview & Benefits
What is Value Capture?
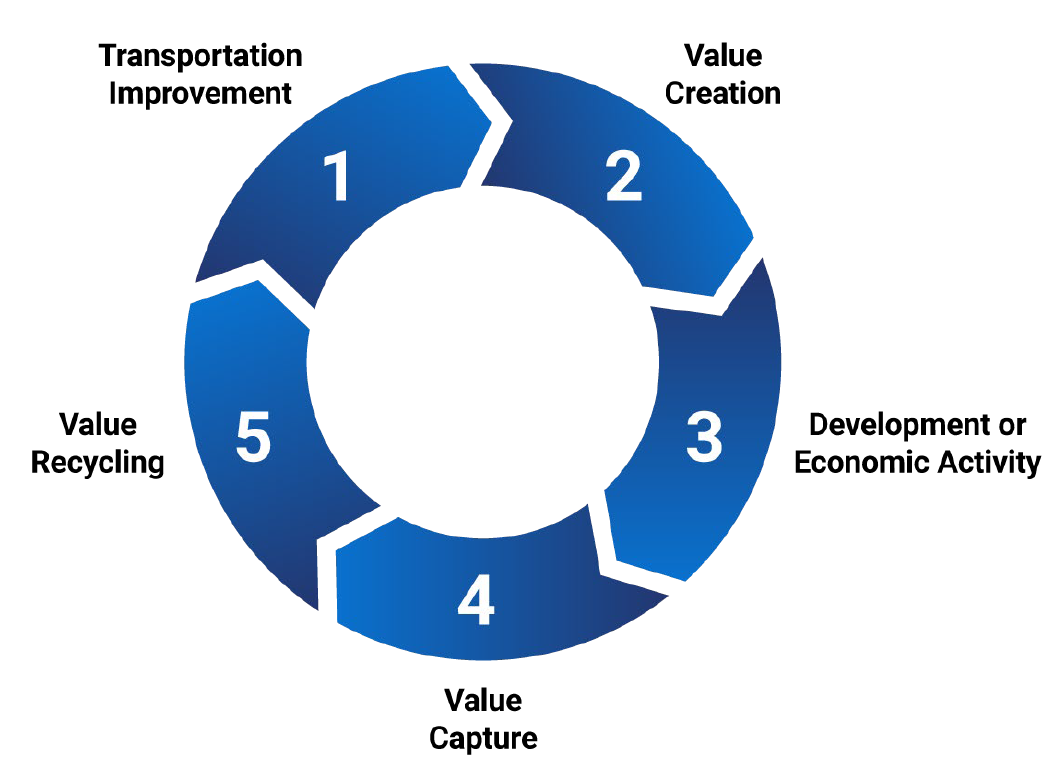
- Transportation Improvement
- Value Creation
- Development or Economic Activity
- Value Capture
- Value Recycling
Value Capture Beneficiaries
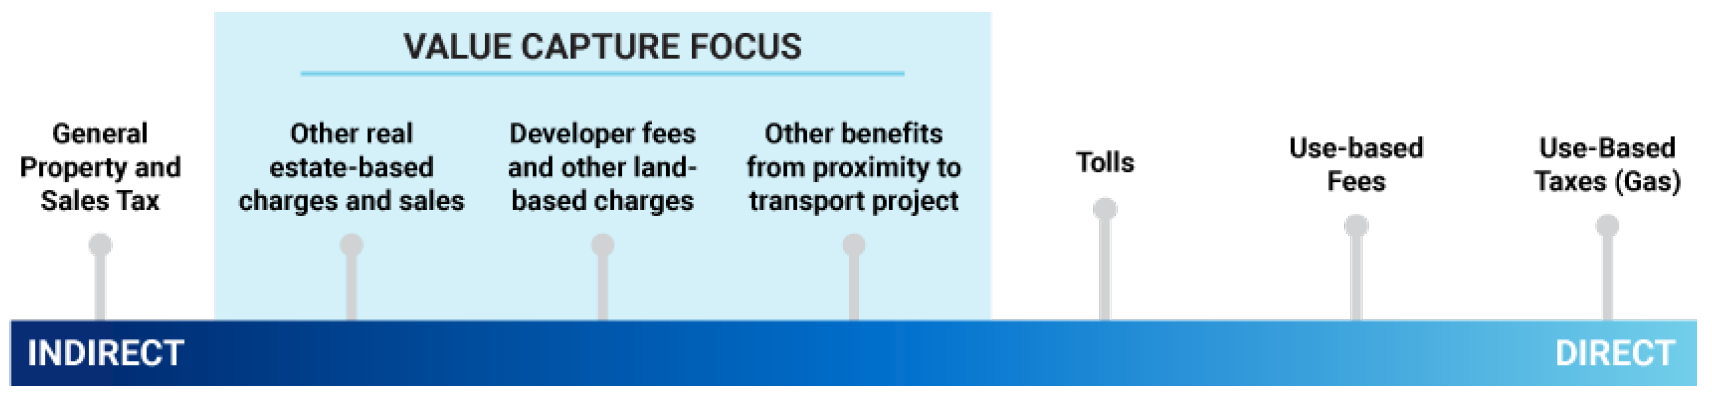
Text of Value Capture Focus chart
- General Property and Sales Tax
- Other real estate-based charges and sales (Value Capture Focus)
- Developer fees and other land-based charges (Value Capture Focus)
- Other benefits from proximity to transport project (Value Capture Focus)
- Tolls
- Use-based Fees
- Use-Based Taxes (Gas)
Potential Benefits of Value Capture
Provide gap funding sources for highway improvements & infrastructure life cycle costs

- Facilitate access to ongoing revenue stream to Local Public Agencies
- Accelerate project delivery & safety Improvements
- Induce private investment
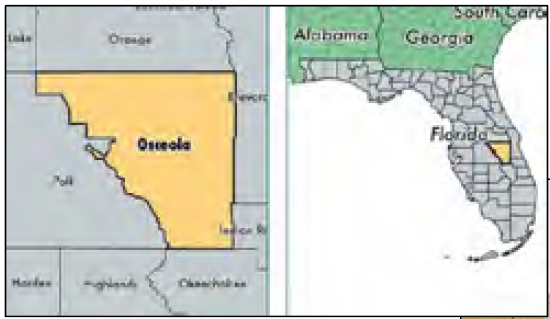
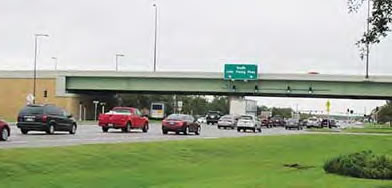
Osceola County Case Study
John Young Parkway / Osceola Parkway Interchange
Case Study - Assembly Square, Somerville MA
Eric Bourassa, Boston Metropolitan Area Planning Council
Value Capture Case Study: Assembly Square, Somerville Massachusetts
Eric Bourassa
Director of Transportation Planning
Metropolitan Area Planning Council - Boston
October 24, 2018
ebourassa@mapc.org
Value Capture Tools More Commonly Used in Massachusetts
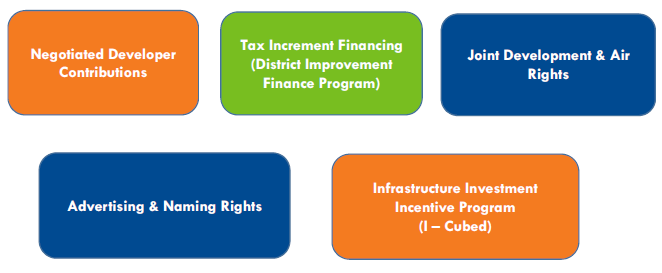
Negotiated Developer Contributions
Tax Increment Financing (District Improvement Finance Program)
Joint Development & Air Rights
Advertising & Naming Rights
Infrastructure Investment Incentive Program (I-Cubed)
Tax Increment Financing
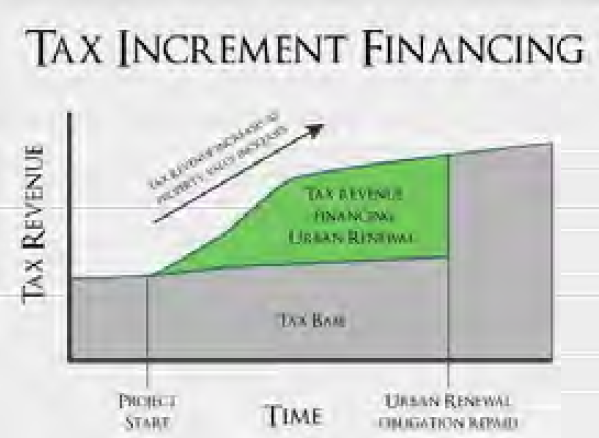
This chart shows that tax revenue goes up over time, with the tax base remaining stable but the value added taxes increasing throughout the live of the project. Urban Renewal Obligations are repaid by the end of the project.
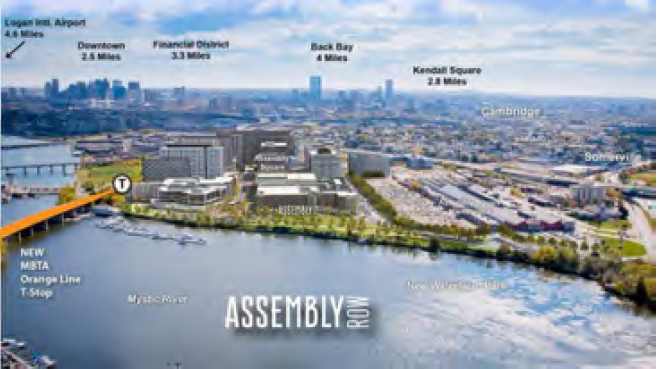
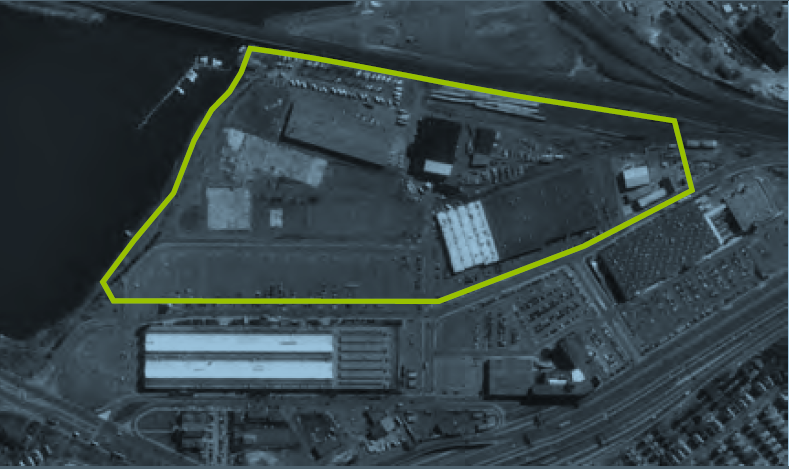
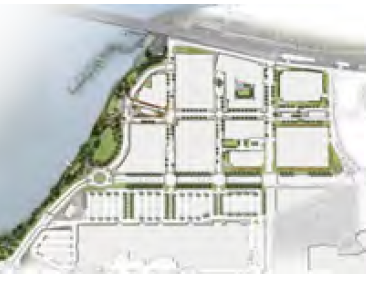
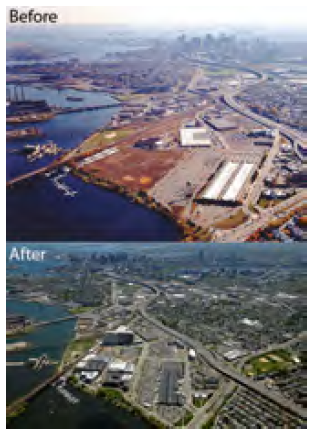
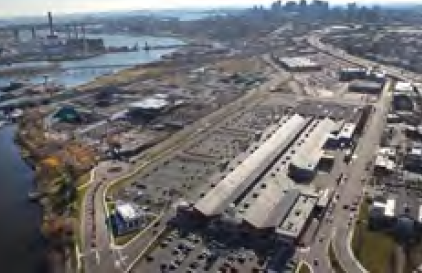
Assembly Square Somerville
Assembly Square - 1995
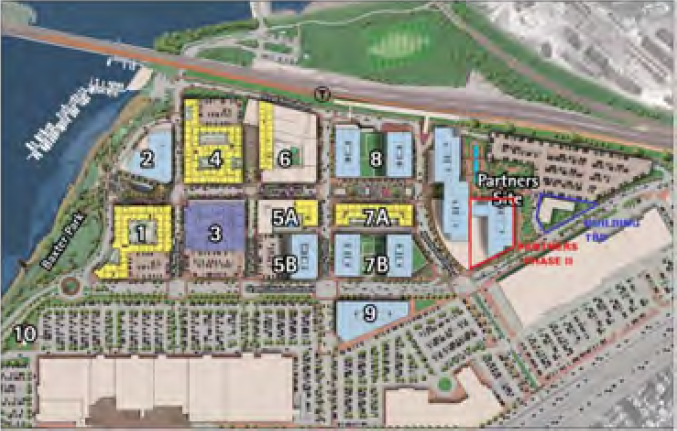
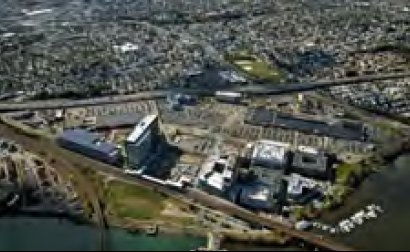
Assembly Square Redevelopment Vision
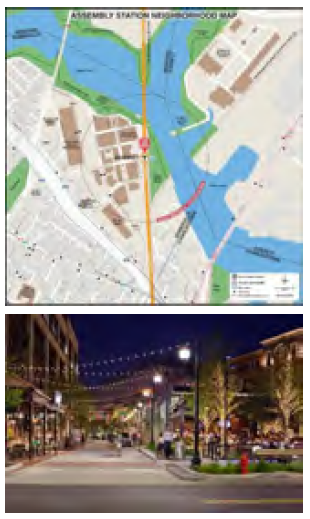
Infrastructure Needed
- Internal Roads and Streetscape
- Water and Sewer
- New MBTA Orange Line Station
Value Capture Mechanisms Used
- $25 Million TIF District to support road access ($14 Million in ARRA)
- $40 Million of I-Cubed for streetscape and utility improvements.
- $15 Million developer contribution for new Orange Line Station (half the cost).
When and Where to Consider Using Value Capture
 |
|
| Limited Value Capture Potential | Strong Value Capture Potential |
|---|---|
Weak real estate market Limited development potential Project perceived as creating limited new value for property owners and developers Multiple jurisdictions Many property owners Significant competing needs and limited municipal resources Lack of political support Projected revenues insufficient to justify transaction costs Limited availability of other funding sources and debt financing |
Strong real estate market Significant development potential Project creates significant value for nearby properties One or a small number of jurisdictions Relatively few property owners Strong municipal fiscal position Political support and municipal capacity Projected revenues of sufficient scale to justify transaction costs Availability of other funding sources and debt financing |
From the Facebook page of Capital Crossing