Value Capture: Capitalizing on the Value Created by Transportation - Presentation
October 18, 2018
What is Value Capture?
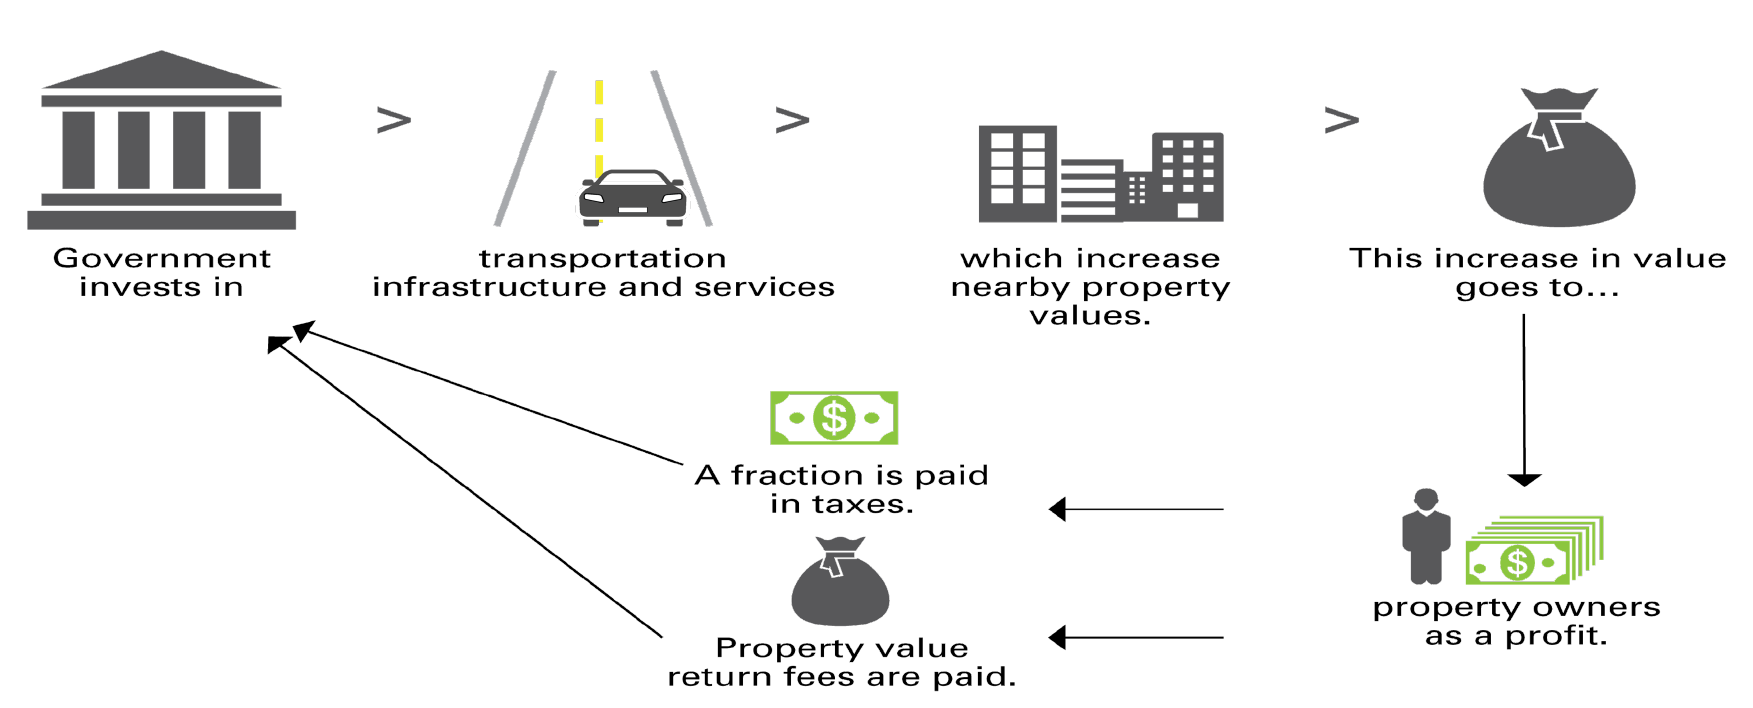
- Government invests in infrastructure and services which increase nearby property values.
- This increase in value goes to property owners as a profit.
- A fraction is paid in taxes.
- Property value return fees are paid.
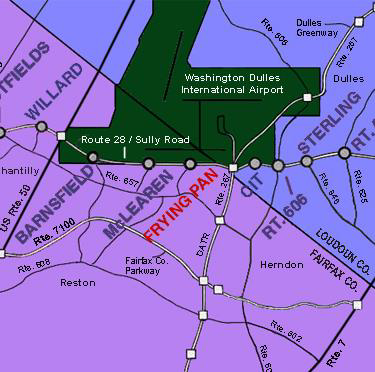
Example: Value Capture Funds Corridor Improvement
Virginia Route 28 Transportation Improvement District
- District formed in 1987 jointly by Loudon and Fairfax Counties
- Maximum tax rate of $0.20 per $100 of assessed value
- Raises ~ $23 million in revenue
- $138 million, 14-mile widening from two to six lanes completed in 1991
- District and State share project costs 75/25
Virginia Route 28 Transportation Improvement District project profile
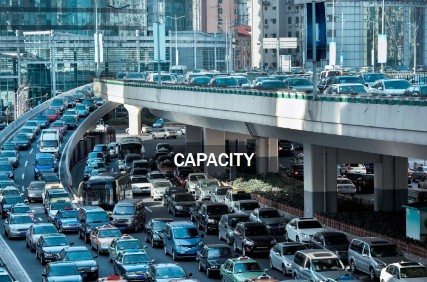
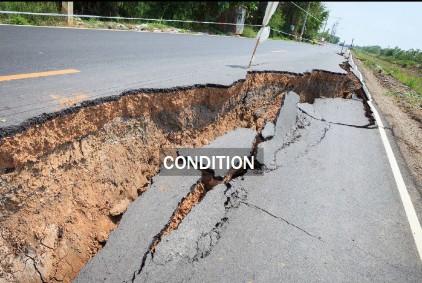
Why is Value Capture Needed?

Value Capture Overview & Benefits
What is Value Capture?
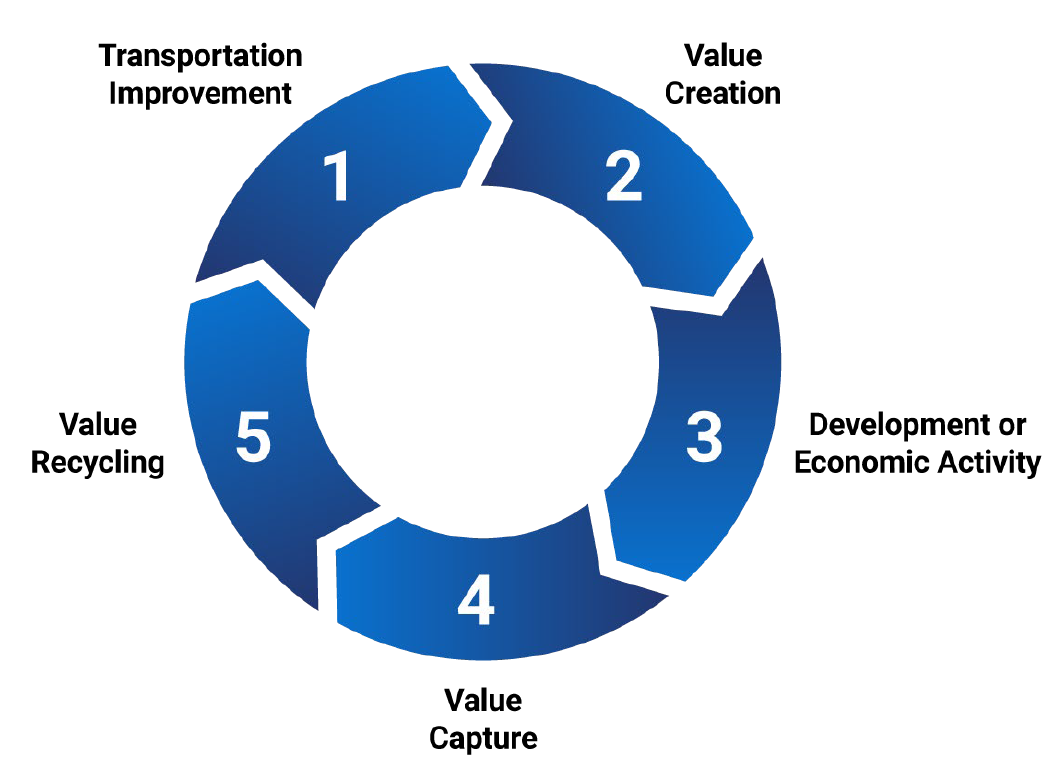
- Transportation Improvement
- Value Creation
- Development or Economic Activity
- Value Capture
- Value Recycling
Value Capture Beneficiaries
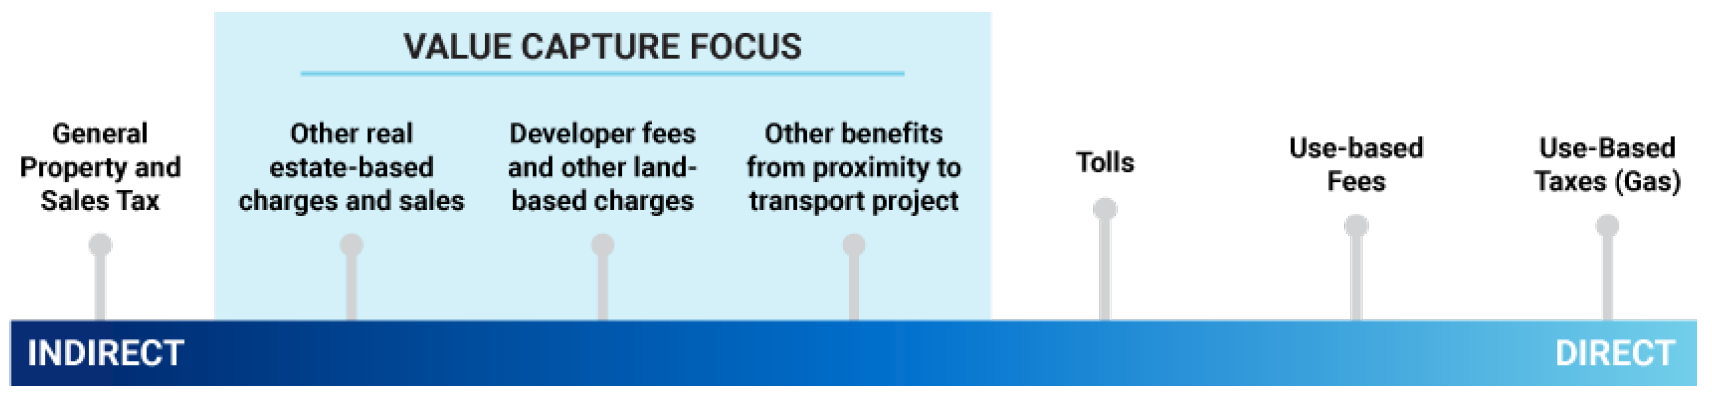
Text of Value Capture Focus chart
- General Property and Sales Tax
- Other real estate-based charges and sales (Value Capture Focus)
- Developer fees and other land-based charges (Value Capture Focus)
- Other benefits from proximity to transport project (Value Capture Focus)
- Tolls
- Use-based Fees
- Use-Based Taxes (Gas)
Potential Benefits of Value Capture
Provide gap funding sources for highway improvements & infrastructure life cycle costs

- Facilitate access to ongoing revenue stream to Local Public Agencies
- Accelerate project delivery & safety Improvements
- Induce private investment
Case Studies
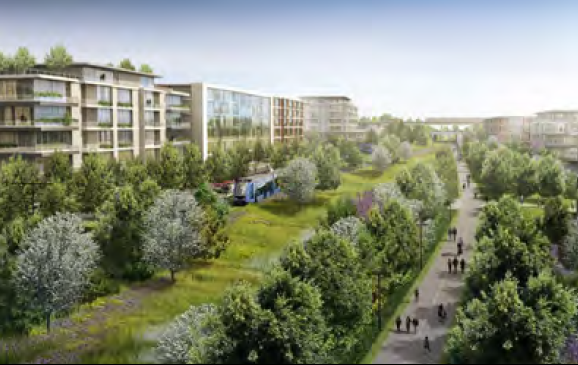
The Atlanta BeltLine
FHWA EDC-5 Summit
18 Oct 2018
 @atlantabeltline
 @atlantabeltline
 @atlantabeltline

Organizational Structure
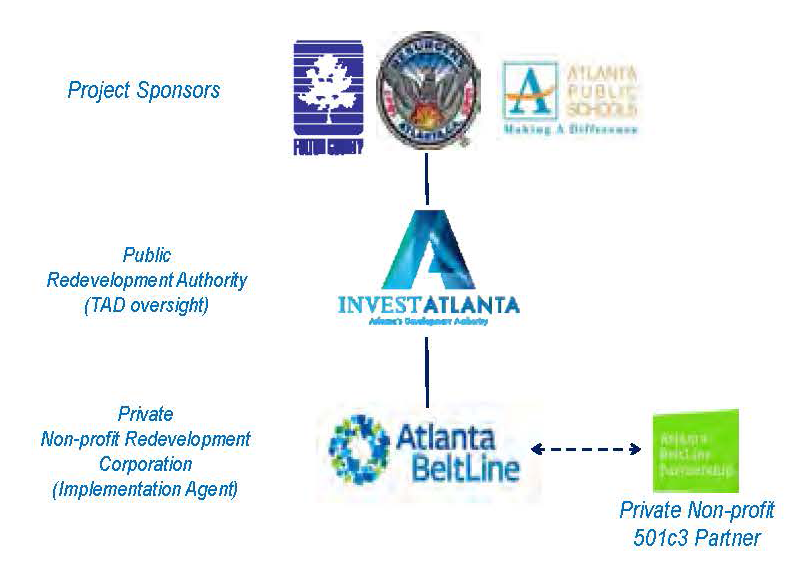
Text of Organizational Structure flow chart
- Project Sponsors - Fulton County, Resurgence Atlanta, Atlanta Public Schools
- Public Redevelopment Authority - Invest Atlanta
- Private Non-profile Redevelopment Corporation (Implementation Agent) - Atlanta BeltLine
- Private Non-profit 501c3 Partner - Atlanta BeltLine Partnership
- Private Non-profile Redevelopment Corporation (Implementation Agent) - Atlanta BeltLine
- Public Redevelopment Authority - Invest Atlanta
Strategic Partnerships
- Introduction and Background
- The Texas TRZ
- Evolution of the TRZ Legal Framework
- The TRZ Implementation Process
- Opportunities and Limitations
- Active Texas TRZs
Bringing 45 neighborhoods Together
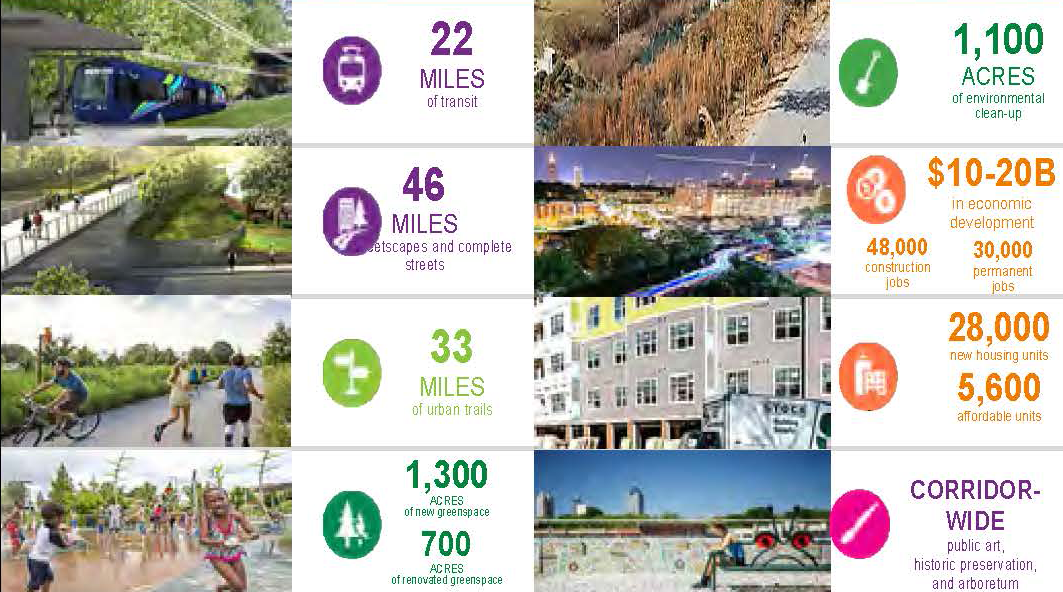
- 22 miles of transit
- 46 miles of streetscapes and complete streets
- 33 miles of urban trails
- 1,300 acres of new greenspace
- 700 acres of renovated greenspace
- 1,100 acres of environmental clean-up
- $10-20B in economic development
- 48,000 construction jobs
- 30,000 permanent jobs
- 28,000 new housing units
- 5,600 affordable units
- Corridor-wide public art, historic preservation, and arboretum
- Framework for a multi-use and transit corridor in the heart of the region
- Links many of Atlanta's historical landmarks and cultural destinations
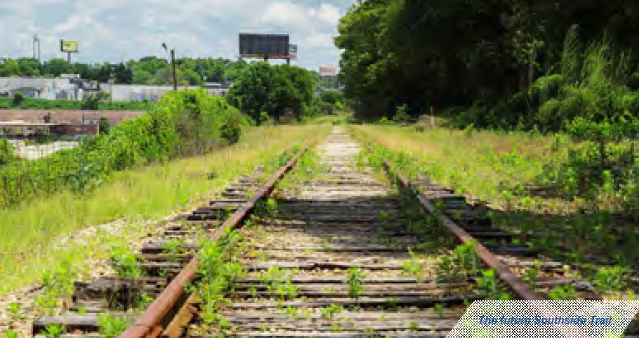
- Connects four historic rail corridors
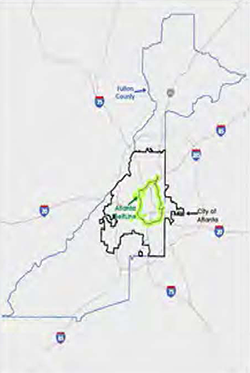
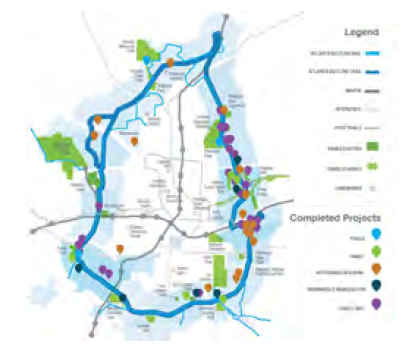
The Atlanta BeltLine TAD
- Area: 6,500 acres
- Part of Total Planning area:15,000 acres
- 22% of the City of Atlanta population is within the planning area
- 19% of the City's land is within the planning area
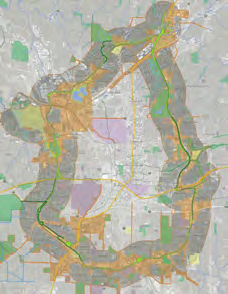
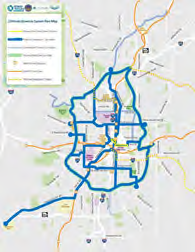
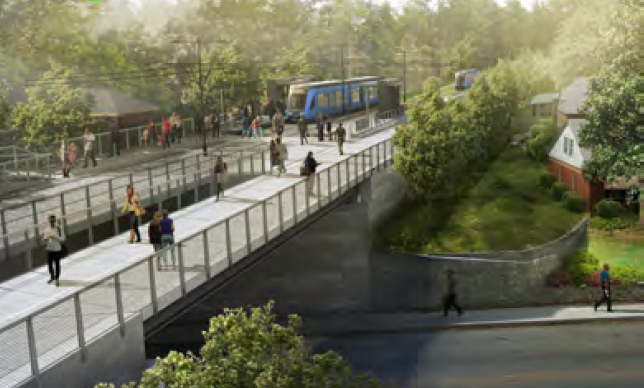
Proposed Streetcar System
- Planning Area overlaps with Streetcar System Plan
- Transit has been at the heart of the Atlanta BeltLine from the start
- SSP focused on the Atlanta BeltLine and connectivity with MARTA and the City's core
- Policy framework for 50+ miles of streetcar service
- Adopted by City Council in Dec 2015
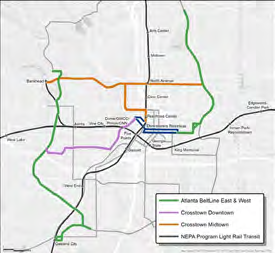
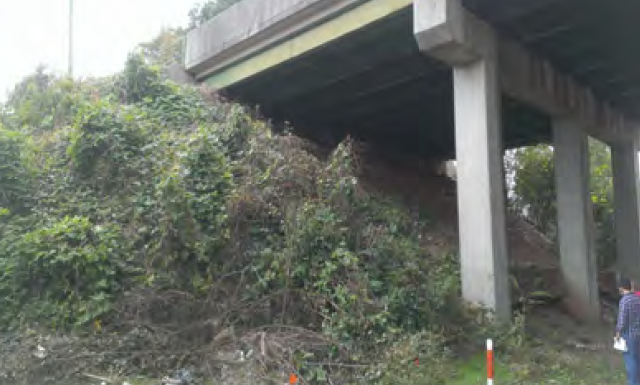
Atlanta Streetcar NEPA Clearance
- Gateway to Federal Funds
- 16+ Miles so far
- 2018-2020, clear remaining 50 mi
Why?
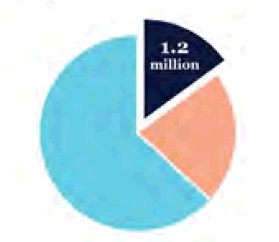
1.2 million
If we assume the region will grow to 8 million people and 15% of those people want to live in the City of Atlanta, then the population of the city will grow to 1.2 million.
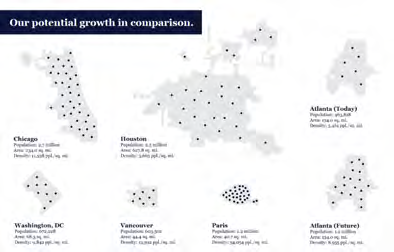
What are we Working Towards?
How it's Gotten Done, so far...
Investment to Date
Public & Private investment to date:
$500 million
(Over $53m in private donations )
Development to Date
Private development is following Public & Private investment:
- Over 130 projects complete or underway within Planning Area*
- More than 7 million SF of new commercial space completed
- Over 8 to 1 return on investment through 2017
* Projects larger than 10 dwelling units or 10,000 square feet
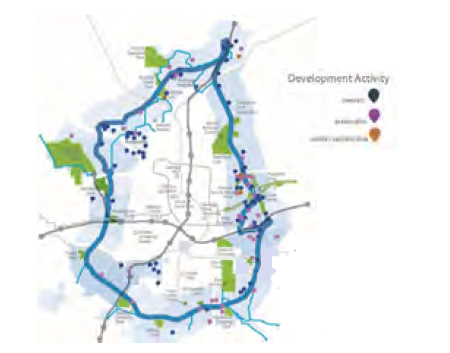
More than $4.1 billion in development to date
Economic Development: Priority Activities
KEY ACTIVITIES
- Job Attraction (permanent & construction)
- Private Investment Attraction
- Product Development
- Supporting Good Development
- Establishing Viable Commercial and Light Industrial Product
- Corridor Activation/New Revenue
- Existing Business Engagement
- Technology Innovation

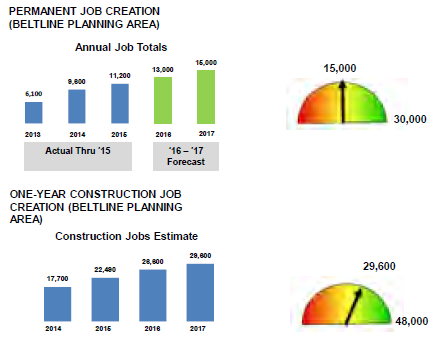
Job Creation
CONTEXT
Actual jobs through 2015 pending Census Data Update for '16 & '17
2016 - 2017 conservative forecast considers (full Ponce City Market Activation, Piedmont Hospital growth, SW Atlanta Film and Digital Media activity)
Construction activity has been consistently trending up
Job Breakout by Sector
Context
- Healthcare, Hospitality & Food Services are leading job types but overall job types are diverse
- The "Other" category includes Manufacturing, Real Estate, Construction and Logistics
- Digital Media & Film in SW are emerging & a number of technology firms are located in the NE and SE
- Leading job nodes are Piedmont Hospital, Armour Yards, Ponce City Market & West Midtown
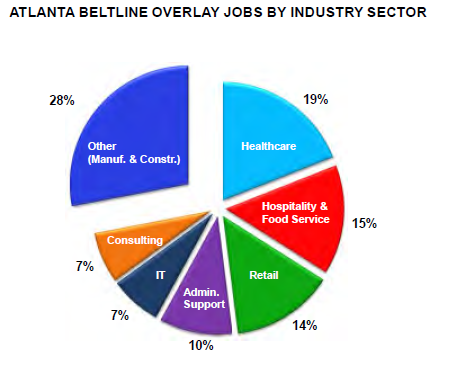
- 28% Other (Manuf. & Constr.)
- 19% Healthcare
- 15% Hospitality & Food Service
- 14% Retail
- 10% Admin. Support
- 7% IT
- 7% Consulting
Equity & Affordability
NEW FUNDING STRATEGY
- $18+ million commitment of TAD revenue over next three years:
- 20% of available TAD increment
- $11.6M from 2016 bond issue
- 75% of any mid-year increment
PROGRAMS
- Affordable Housing Trust Fund incentives
- Acquisition and predevelopment
PARTNERSHIPS (in addition to Invest Atlanta and City of Atlanta)
- Atlanta Housing Authority: Englewood partnership
- Atlanta BeltLine Partnership: Homeowner education workshops

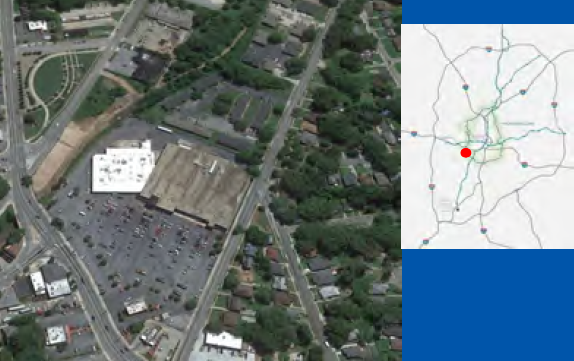
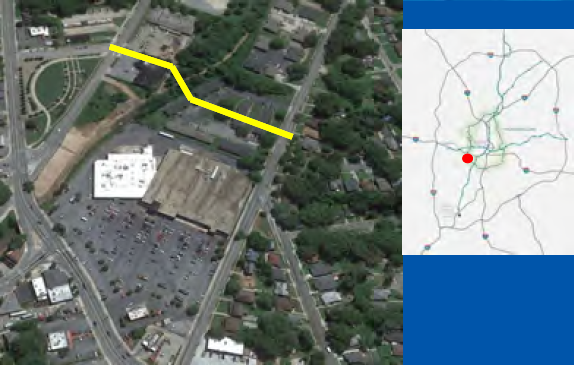
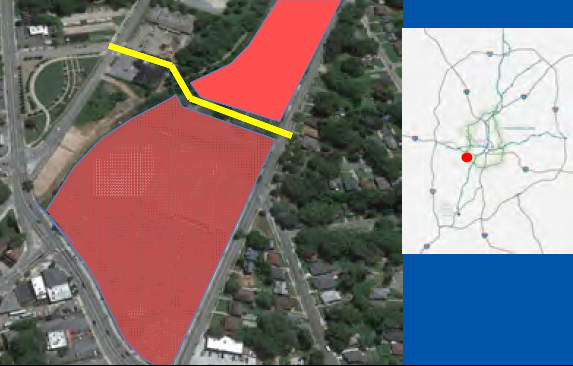
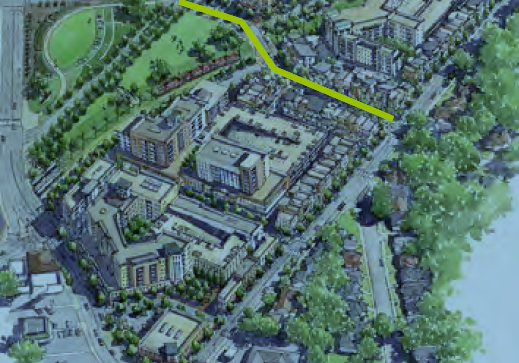
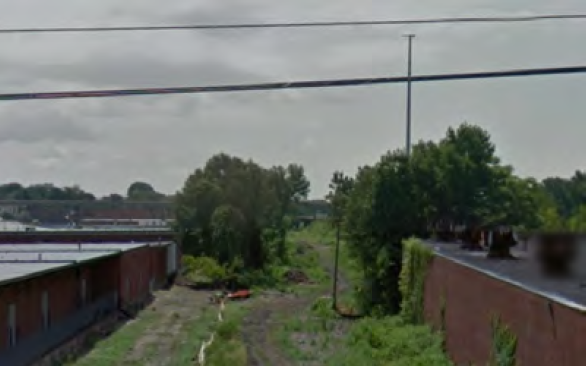
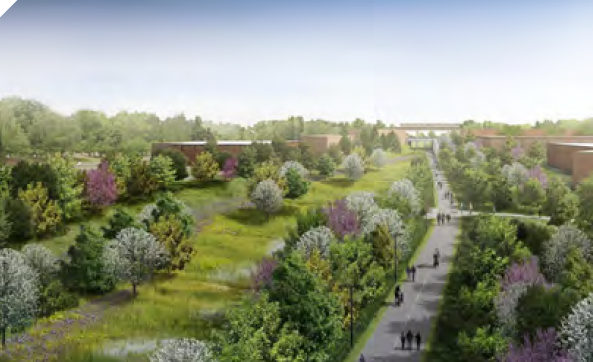
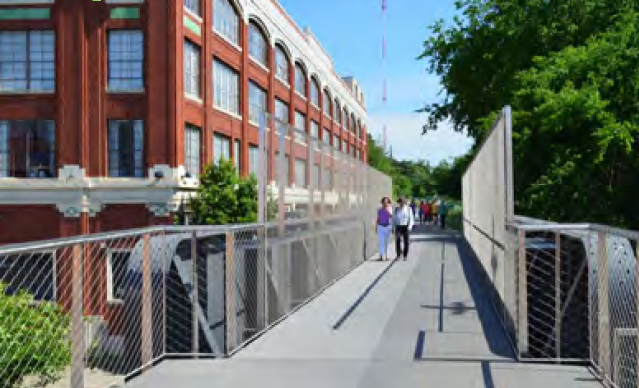
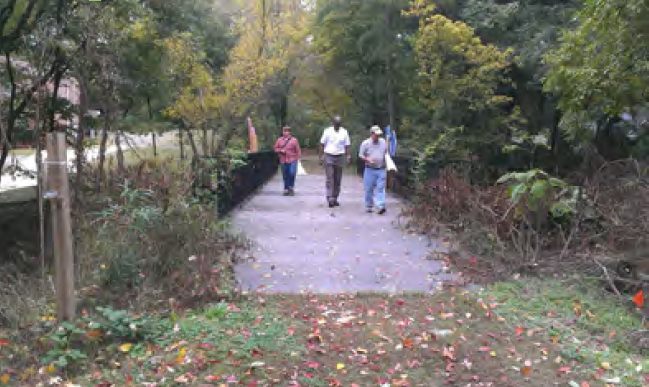
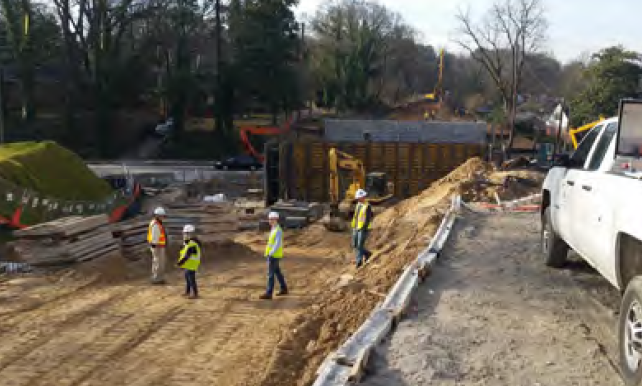
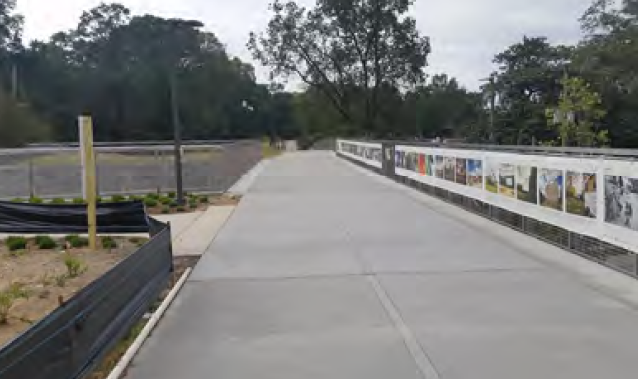
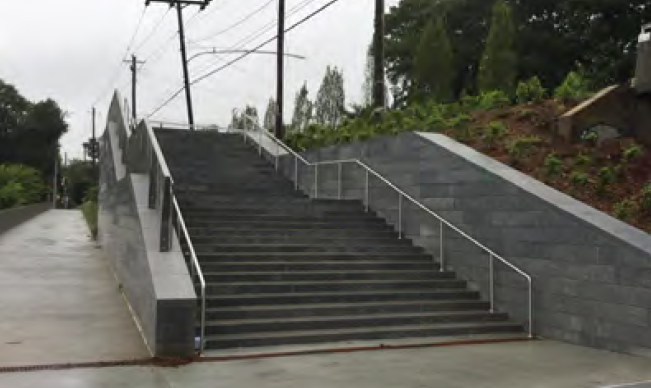
Trails & Parks
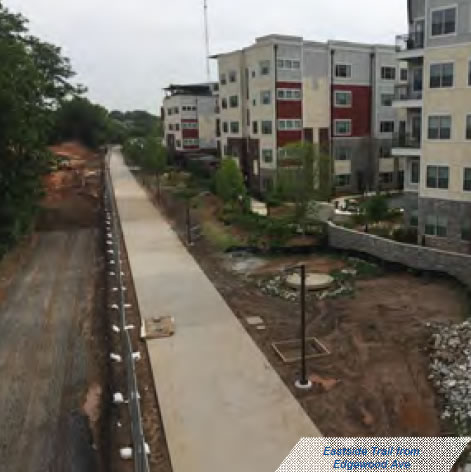
Eastside Trail
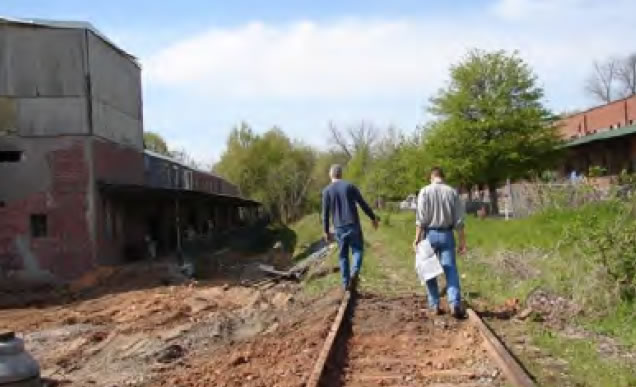
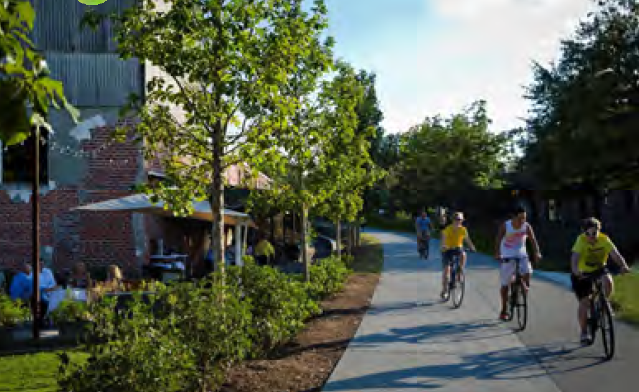
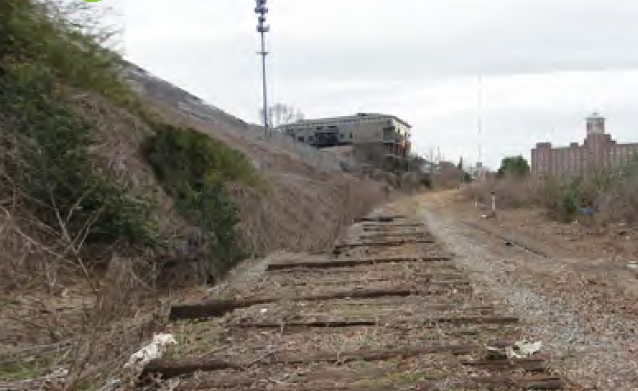

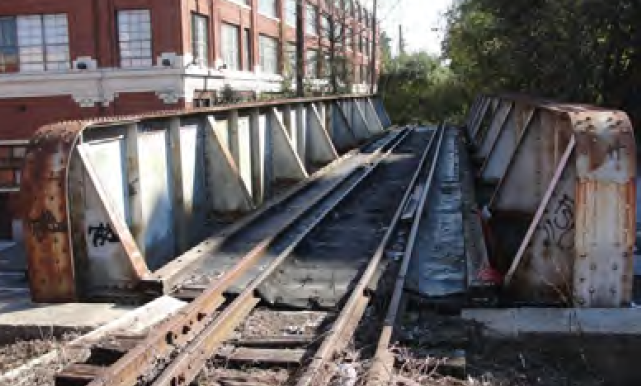
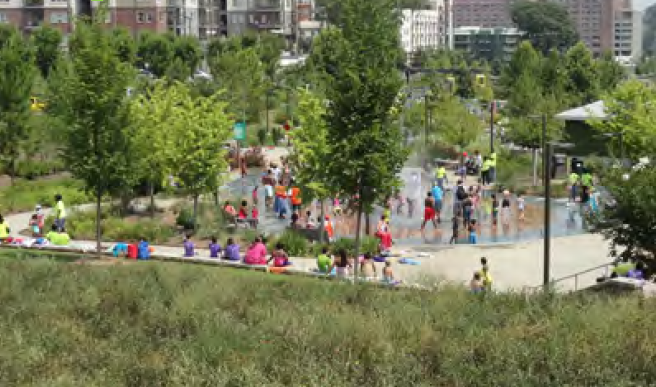
Fourth Ward Park
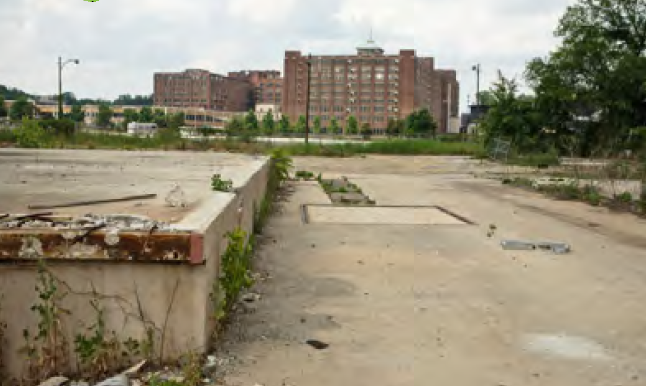
Westside Trail
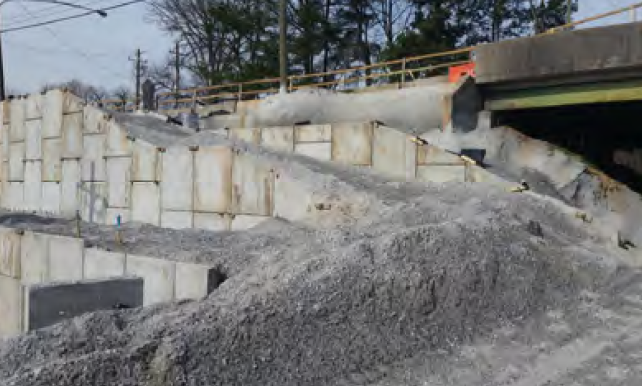
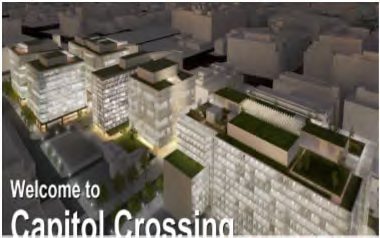
The Washington DC I-395 Capitol Crossing Project
Background: Washington D.C. I-395 Capitol Crossing
- The construction of the I-395 in the late 1960's created divisions between the Capitol Hill and East End Districts.
- The idea of decking over the Interstate 395 dates to 1989
- The area is one of the largest areas in development in downtown Washington, DC
- In 2012, the District awarded the right to develop the property to Property Group Partners (PGP)
- The largest air rights project ever undertaken in Washington D.C.
- The Capitol Crossing project broke ground in May 2015. The entire project is expected to be completed by 2021
- $1.3 billion highway, local, street, and real estate development project in Washington, D.C.
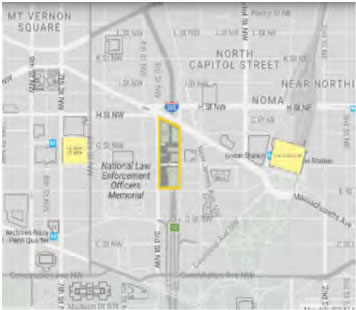
- Located above I-395 between E Street and Massachusetts Ave and 2nd and 3rd Streets NW
- Five mixed-use buildings with 2.2 million square feet
- Seven-acre decked development site above I-395

Development Detail
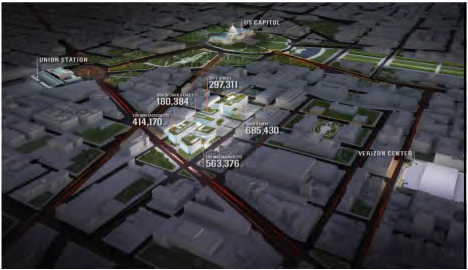
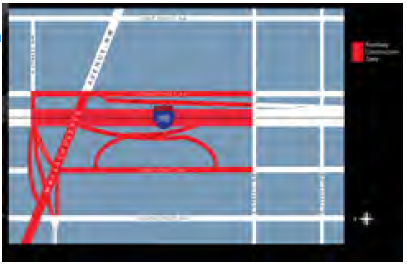
3rd Street Tunnel Project (Transportation portion of the Capitol Crossing Project)
$270 million in transportation improvements/costs paid by the private sector real estate developer
- Restoration of the original street grid (F and G Streets, NW)
- Enhanced vehicular, pedestrian and bicycle connections around and across I-395
- Utility relocations
- Reconfiguration of I- 395 ramps at 2nd and 3rd Streets, NW
From the Facebook page of Capitol Crossing
https://www.facebook.com/search/top/?q=Capitol%20Crossing%20construction
Capitol Crossing Value Capture
Property Group Partners (PGP) acquired the air rights from the District of Columbia in 2012 for a fee of up to $120 million
The completed project will generate an estimated $40 million in annual new property tax revenue
PGP will fund the $270 million Third Street Tunnel Project
- Employment
- 4,000 construction jobs
- 8,000 permanent jobs
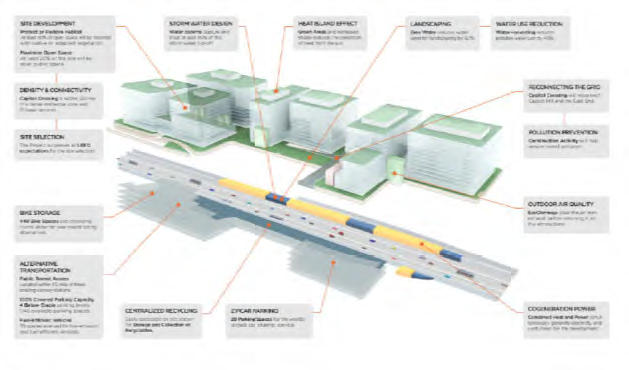
Sustainability
Capitol Crossing - Questons?