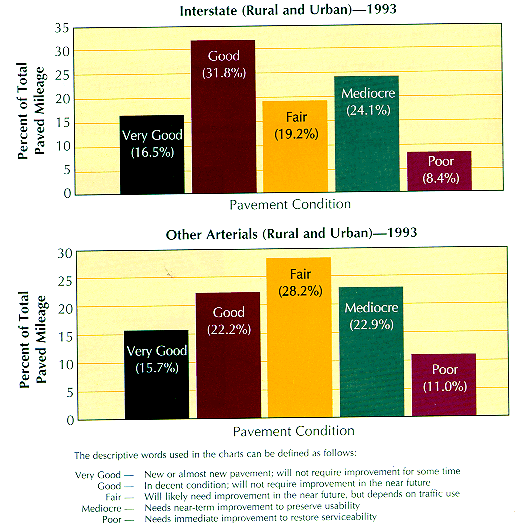
Pavement Conditions of Interstate and Other Arterials
The preservation of the Nation's highways is a priority of all levels of government. Although pavement conditions and trends vary significantly among the States, average conditions on the Nation's arterial systems appear to have stabilized or perhaps even improved in the latter years. This has diminished a continuous downward trend in physical conditions that was evident in the 1970's and early 1980's. This is due primarily to increased attention and fiscal resources assigned to the preservation of pavement during the mid to late 1980's.

For 1993, a combination of Pavement Serviceability Rating (PSR), a subjective rating system, and International Roughness Index (IRI), and objective instrument-based rating system, has been used. In the future, only the objective IRI will be used to denote pavement condition as these data become fully reported.
Page 20


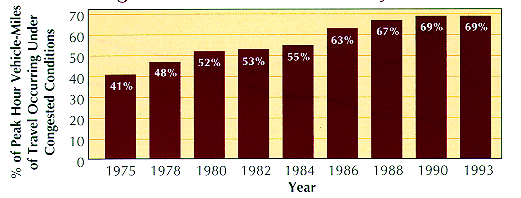
Travel Congestion on Urban Interstate System
Travel congestion on the urban Interstate System is steadily increasing, but at a slower pace in recent years. In 1993, 69 percent of the peak-hour travel on this system occurred under congested conditions, while only 52 percent of the travel occurred under these congested conditions in 1980. Note however, that the peak is now much longer than 1 hour (both AM and PM). The measure of congestion used in this analysis is called the Volume/Service Flow (V/SF) Ratio. As this ratio gets larger, traffic slows and eventually stops as the theoretical value of 1.00 is approached (the volume of traffic = service flow capability of the facility). A V/SF ration value of greater than or equal to 0.80 was used here to indicate congestion.

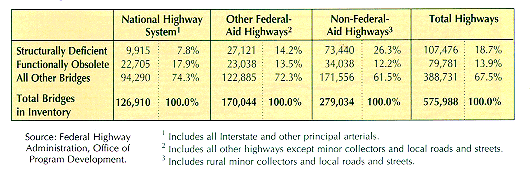
Bridge Conditions (as of December 31, 1994)
Thirty-three percent of the Nation's estimated 575,988 bridges are structurally deficient or functionally obsolete. Twenty-six percent of the 126,910 bridges on the National Highway System (Interstate and all other principal arterials) are structurally deficient or functionally obsolete.
A structurally deficient bridge is closed or restricted to light vehicles only because of deteriorated structural components. Structurally deficient bridges are not necessarily unsafe. Strict observance of signs limiting traffic or speed on bridges will generally provide adequate safeguards for those using the bridges.
A functionally obsolete bridge is one that cannot safely service the volume or type of traffic using it. These bridges are not unsafe for all vehicles, but have older design features that prevent them from accommodating current traffic volumes and modern vehicle sizes and weights.

Page 21

Motor-Vehicle Fatalities and Travel
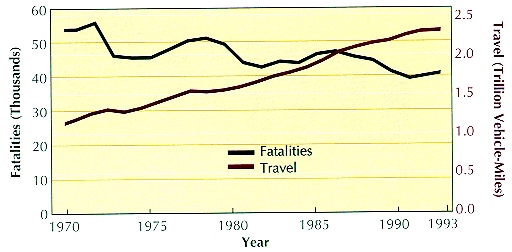
After a series of declines during the mid 1970's and early 1980's, the number of fatalities increased from 1986 to 1988, and then started to decline again. In 1993 there were 40,115 fatalities; 3,916 (or 10 percent) occurred on the Interstate System. An estimated 43.6 percent of highway fatalities in 1993 were alcohol related.


Fatality (Interstate and Total) Rates
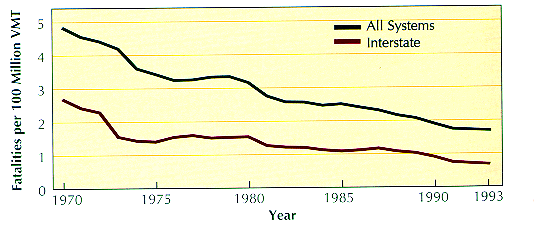
The fatality rate-fatalities per 100 million vehicle-miles of travel (VMT) - on all highway systems continues to decline. In 1993, the fatality rate reached 1.75, a 64 percent decrease from 1970. The decrease in the fatality rate occurred despite a 107 percent increase in highway travel and a 79 percent increase in motor vehicle registrations during the 1970 to 1993 time period. The fatality rate (.75) on the Interstate System is less than half the rate on all highway systems.
Page 22

Principal Classes of Motor-Vehicle Deaths

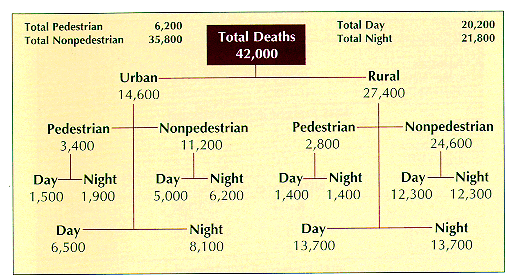
Almost two out of three deaths in 1993 occurred in places classified as rural. In urban areas, nearly one fourth of the victims were pedestrians; in rural areas, the victims were mostly occupants of motor vehicles. More than one half of all deaths occurred in night accidents.
Source: National Safety Council Estimates; Accident Facts, 1994 edition.

Fatalities Involving Medium/Heavy Trucks1
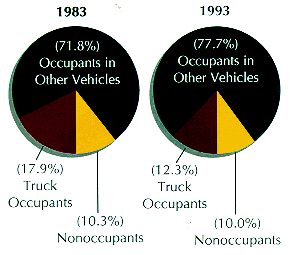
There were 4,849 fatalities in accidents involving medium and heavy trucks in 1993. Occupants in other vehicles accounted for 3,845 or 78 percent of the fatalities involving medium and heavy trucks.

There were 543 fewer fatalities involving medium and heavy trucks from 1983 to 1993. Occupants in other vehicles showed a decrease of 96 of the fatalities involving medium and heavy trucks while the nonoccupant fatalities decreased by 75 over that same period of time.

1 Medium/Heavy Truck--Single-unit truck with gross vehicle weight greater then 10,000 lbs., tractor-trailer combination, truck with cargo trailer(s), or truck-tractor pulling no trailer.


Source: National Highway Traffic Safety
Administration, Fatal Accident Reporting System

Page 23

Back to Contents