Increasing Use of Older Vehicles
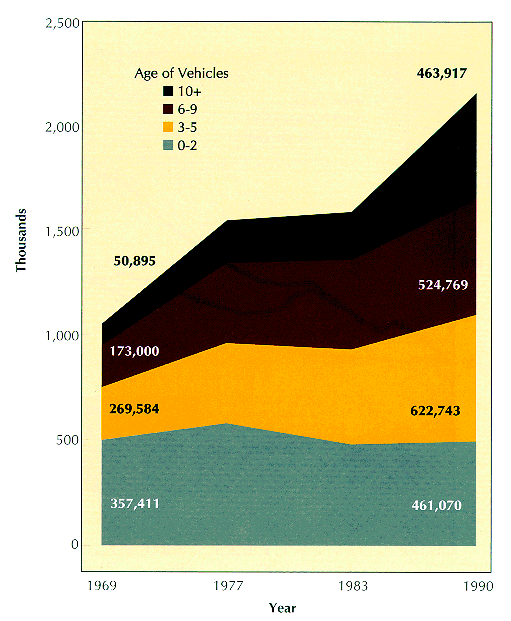
Not only are the Americans keeping their cars longer, they are using older cars for a much larger portion of travel than in the past. In 1969, travel by cars 10 years old and older only accounted for 6 percent of total vehicle miles. By 1990, that portion grew to 22 percent.
Source: Federal Highway Administration, Nationwide Personal Transportation Surveys, 1969, 1977, 1983, 1990.
Page 30
Time Average American Spends in Car
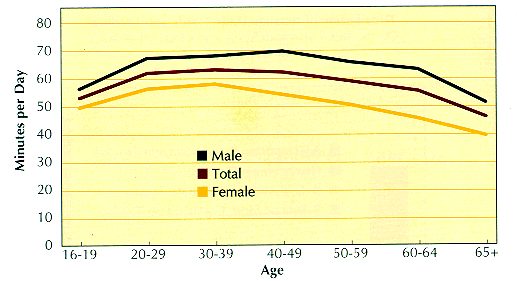
The average driver spends 1 hour in his or her car each day, including weekends. Within each age group, men spend 10-15 minutes more in their cars than women.
Source: Federal Highway Administration, 1990 Nationwide Personal Transportation Survey.
Average Annual Miles per Driver by Age Groups
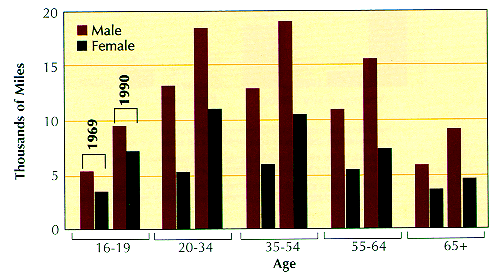 A significant increase in the average miles driven by men and women in all age groups was noted in the 1990 Nationwide Personal Transportation Survey compared to results for earlier surveys. This increase was particularly prominent in driving by women.
Source: Federal Highway Administration, Nationwide Personal Transportation Surveys, 1969, 1990.
Page 31
Rural Interstate Travel by Vehicle Type
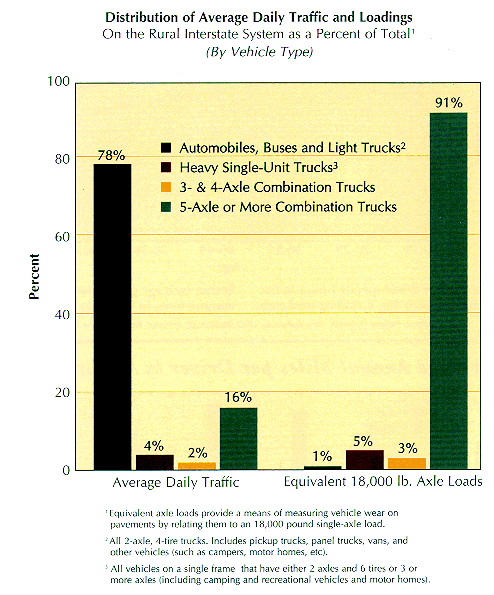 On rural Interstate routes in 1993, combination trucks with 5 or more axles accounted for 16 percent of average daily traffic volumes but 91 percent of equivalent axle loads. All other vehicles accounted for 84 percent of traffic volumes but only 9 percent of traffic loads. From 1983 to 1993, traffic axle volumes on rural Interstate routes increased by 45 percent and equivalent axle loads by 61 percent.
Source: Highway statistics 1993 (from data collected at truck weigh sites).
Page 32
Annual Vehicle Miles of Travel
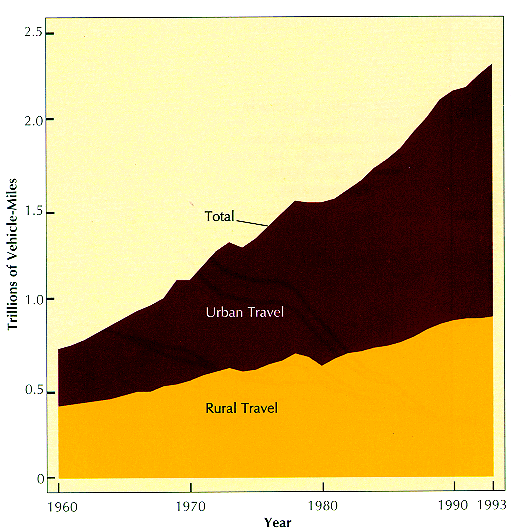
Annual travel on the Nation's highways reached an estimated 2.3 trillion vehicle-miles in 1993, or about three times the level reported in 1960. Travel grew about 54 percent during the 1960's, another 38 percent in the 1970's, and another 40 percent in the 1980's. Annual travel on roads and streets in urban areas accounted for 1.4 trillion vehicle miles in 1993 or 61 percent of total travel, compared to 44 percent in 1960. Compared to the urban travel growth of 49 percent in the 1980's rural travel grew at a level of 28 percent. Much of the urban travel growth can be attributed to expanding urban boundaries.
Page 33
Travel by Vehicle Type
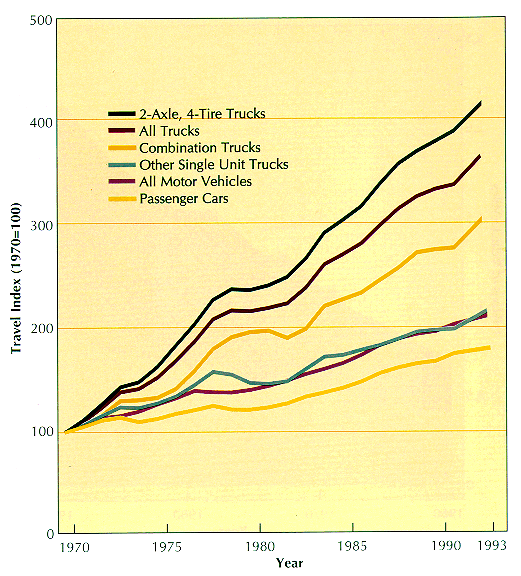 Travel by all motor vehicles has increased by 107 percent compared to 1970. All truck travel has increased over 250 percent since 1970. This includes travel by combination trucks which is up over 190 percent and now accounts for 4.5 percent of total annual vehicle-miles of travel versus 3.2 percent in 1970. Travel by 2-axle, 4 tire trucks has increased over 300 percent compared to 1970 and now represents 21.6 percent of total travel compared to 11.1 percent in 1970. Although travel by passenger cars has increased 77.2 percent compared to 1970, the percentage of annual travel by passenger cars in relation to all vehicles has decreased from 82.6 percent in 1970 to 70.7 percent in 1993.
Page 34
Journey to Work Comparisons (JTW)
National Total
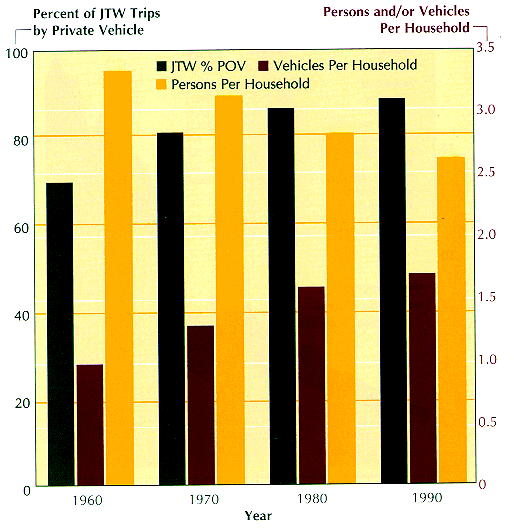
Since 1960, average household size has decreased significantly while average vehicle availability per household increased dramatically. These trends continued between 1980 and 1990, although at slower rates. By 1990, average household size was 2.6 persons, and average vehicle availability was 1.7 vehicles per household. The overall increase in vehicle availability per adult parallels the general increase in workers who use a private vehicle for the journey to work.
Source: Journey-to work Trends in the United States and its Major Metropolitan Areas, 1960-1990.
Page 35
Back to Contents


