Transportation Expenditures
at the Household Level
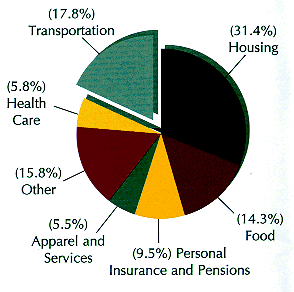
After housing (31.4 percent), transportation (17.8 percent) accounts for the largest single household expenditure, and 60.4 percent of transportation expenditures at the household level are for personal vehicles, gas, and oil.
Source: U.S. Bureau of Labor Statistics, Consumer Expenditures Survey: Results from 1993.

Person-Miles of Travel by Mode of Transportation
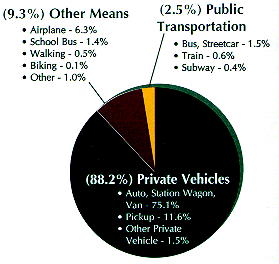
The personal motor vehicle (automobile, light truck, van, and motorcycle) is the predominant form of personal transportation. Privately owned vehicles are used for 88.2 percent of all personal travel. When school bus (1.4%) and bus/steetcar (1.5%) are added to the Private Vehicle portion, we find that over 90 percent of personal transportation is served by highways.
Source: Federal Highway Administration, Nationwide Personal Transportation Survey, 1990.

Page 2

Freight Transportation by Mode
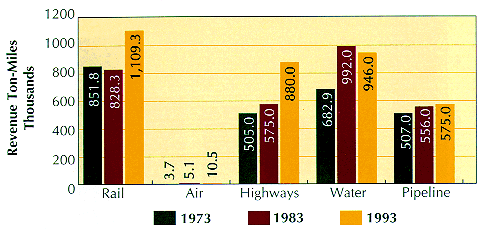
In 1993, the Nation's highway system carried 25 percent of the total revenue ton-miles of freight compared to 19.4 percent in 1983 and 19.8 percent in 1973
Source: U.S. Department of Transportation Statistics: annual Report 1995.

Gross Domestic Product and Travel Relationship
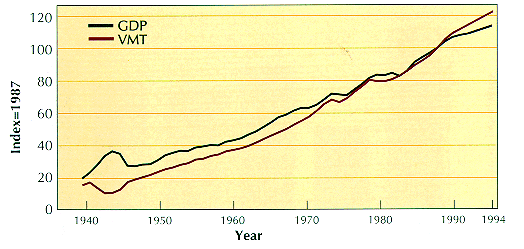
There is a strong relationship between the Nation's economy and travel on the Nation's highway system. Since the 1930's , growth in the Gross Domestic Product (GDP) and vehicle-miles of travel (VMT) reflect strikingly similar patterns (with the exception of the World War II period), including the period of energy disruptions during the 1970's.)

Page 3

Annual Vehicle-Miles of Travel per Capita
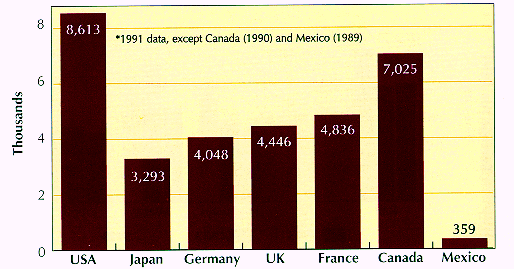
Highway travel by Americans, expressed as vehicle-miles of travel (VMT) per capita, far exceeds highway travel by citizens of other major countries. In 1991, VMT per capita in the United States reached 8,613, a 27 percent increase compared to 1981.
Source: Central Intelligence Agency, World Fact Book 1991; world Road Statistics, 1992
International Road Federation, 1992; Federal Highway Administration, Highway Statistics 1992

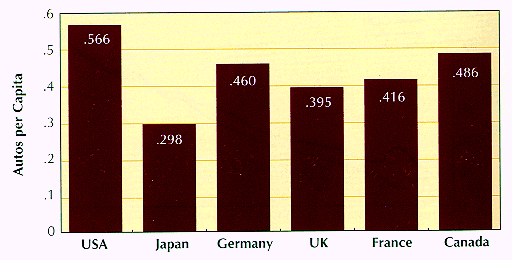
Automobiles per Capita - 1991
The United States had the highest number of automobiles per capita in 1991 - Canada follows with the newly unified Germany close behind.

Source: Department of Energy, transportation Energy Data book: Edition 14,
May 1994, and: Central Intelligence Agency, the world Fact Book 1991,
Information on Germany provided by Federal Republic of Germany.

Page 4

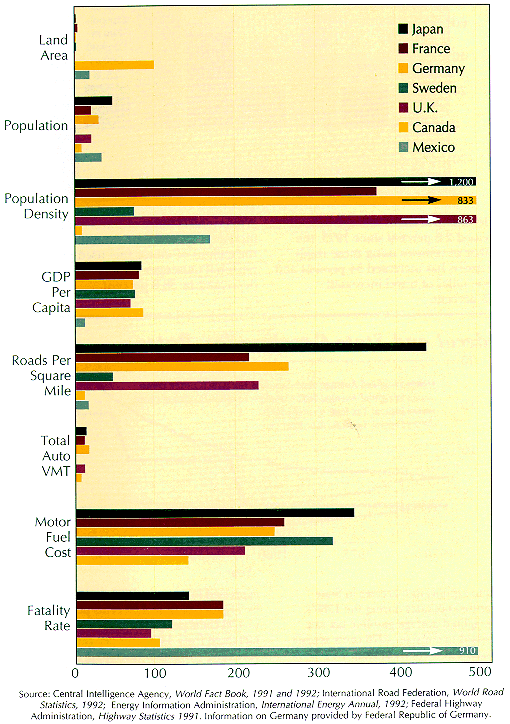
International Comparisons of Key Variable - 1991
(Indexed on Unites States = 100)

Page 5

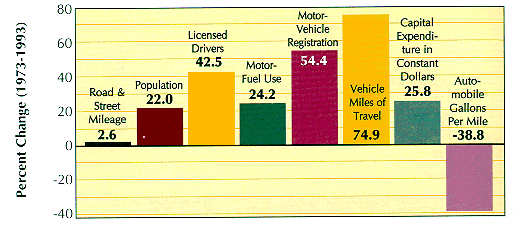
Highway Indicators
While road and street mileage have only increased 2.6 percent since 1973, the number of vehicles using those roads and streets has increased 54 percent and vehicle miles of travel increased by 75 percent. While vehicle-miles of travel (VMT) has increased by 74.6 percent since 1973, the gallons of motor fuel used per personal passenger vehicle has decreased by 38.8 percent.


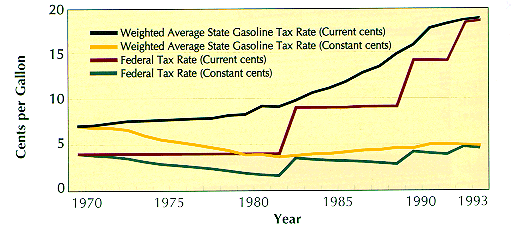
Federal and State Gasoline Tax Rates
Despite significant increases in State motor-fuel tax rates during the 1980's, the weighted average gasoline tax rate expressed in constant 1970 cents actually decreased by 30 percent from 7.02 cents per gallon in 1970 to 4.95 cents per gallon in 1993. Over the same 1970 to 1993 period, the Federal gasoline tax rate expressed in constant 1970 cents increased by 24 percent, from 4.00 cents pergallon to 4.94 cents per gallon as the rate increased from 4.00 per gallon to 18.4 cents per gallon (including 6.8 cents for deficit reduction). Preliminary 1994 data show that State tax rates increased, but did not keep pace with inflation.

Page 6


Highway Expenditures per Vehicle-Mile of Travel
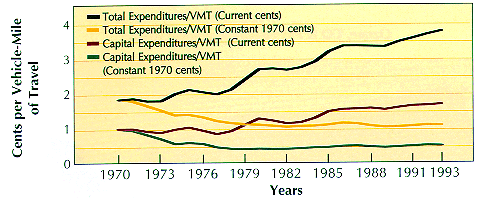
In 1993, highway capital expenditures, were 1.73 cents per vehicle-mile of travel (VMT) as compared to 1.04 cents per VMT in 1970 - a 66 percent increase. After accounting for inflation, however, 1993 capital expenditurers were only 0.56 cents per VMT, a 46.0 percent decrease from 1970's capital expenditures. In 1993, total highway expenditures were 3.82 cents per VMT as compared to 1.88 cents per VMT in 1970 - a 103 percent increase. After adjusting for inflation, total highway expenditures were only 1.12 cents per VMT, a 40.0 percent decrease from 1970's total highway expenditures. In effect, 1993's highway expenditures by all units of government, with inflation removed, were only about 60 percent of what they were 23 years ago for each vehicle-mile of travel.


Annual Household-Based Motor-Vehicle Travel for Selected Purposes
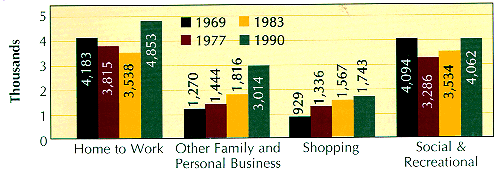
The recent growth in household-based vehicle travel has primarily been for commuting and for other family and personal business, which includes purchase of services and giving others a ride. In 1990, the average household traveled almost 5,000 miles for commuting to work and slightly over 3,000 miles for other family and personal business. These two purposes account for over one half of annual household travel. There were only slight increases in travel per household for shipping and social/recreational purposes.

Source: Federal Highway Administration, Nationwide Personal transportation Surveys (1969, 1977, 1983, 1990).

Page 7

Back to Contents