U.S. Department of Transportation
Federal Highway Administration
1200 New Jersey Avenue, SE
Washington, DC 20590
202-366-4000
Status
of the Nation’s Highways, Bridges, and Transit: |
| Chapter 11: Federal Bridge Program Status of the Nation’s Bridges | |||||||||||||||||||||||||||||||||||||||||||||||||||||||||||||||||||||||||||||||||||||||||||||||||||||||||||||||||||||||||||||||||||||||||||||||||||||||||||||||||||||||||||||||||||||||||||||||||||||||||||||||||||||||||||||||||||||||||||||||||||||||||||||||||||||||||||||||||||||||||||||||||||||||||||||||||||||||||||||||||||||||||||||||||||||||||||||||||||||||||||||||||||||||||||||||||||||||||||||||||||||||||||||||||||||||||||||||||||||||||||||||||||||||||||||||||||||||||||||||||||||||||||||||||||||||||||||||||||||||||||||||||||||||||||||||||||||||||||||||||||||||||||||||||||||||||||||||||||||||||||||||||||||||||||||||||||||||||||||||||||||||||||||||||||||||||||||||||||||||||||||||||||||||||||||||||||||||||||||||||||||||||||||||||||||||||||||||||||||||||||||||||||||||||||||||||||||||||||||||||||||||||||||||||||||||||||||||||||||||||||||||||||||||||||||||||||||||||||||||||||||||||||||||||||||||||||||||||||||||||||||||||||||||||||||||||||||||||||||||||||||||||||||||||||||||||||||||||||||||
|
Index Introduction Highlights Executive Summary Part I: Description of Current System
Part II: Investment Performance Analyses
Part III: Bridges
Part IV: Special Topics Part V: Supplemental Analyses of System Components
Appendices |
For the last 30 years, bridges located on public roads, which are in excess of 6 meters in total length have received periodic, biennial inspections to ensure safety to the traveling public. Inspections are guided by federally defined minimum data collection requirements. Every year bridge information is submitted from the States to the Federal Highway Administration (FHWA). Information collected and maintained by FHWA forms the basis for determining the condition of the Nation's bridges and for the apportionment of bridge replacement and rehabilitation funds to the States. Since initiation of the legislation guiding the development of the National Bridge Inspection Standards (NBIS) and associated funding programs, over $55 billion in Highway Bridge Replacement and Rehabilitation Program (HBRRP) funding has been allocated and used to improve the condition of the Nation's bridges. Other sources of funding from Federal and State programs are also used for bridge activities. Bridges are critical elements within the highway transportation network. Deterioration of structures must be periodically mitigated through proactive interventions to ensure the safety of the traveling public, ensure connectivity of the network, and retain the significant intrinsic asset value of the bridge stock. These preservative actions cost significantly more than highway pavement activity on a unit cost basis. In addition, bridges may become functionally obsolete due to changing traffic demands. Actions must be taken to avoid adverse economic impacts to the traveling public, which may result due to this functional obsolescence of the structure. Programs have been developed and legislated to ensure bridge safety and provide funding for rehabilitation, improvement, and replacement of the structure. These programs are summarized in this section. The information collected through the bridge inspection process, which represents the most comprehensive source of bridge condition and composition data at the national level, is summarized to give a background for the indepth examination presented in the remaining portions of the chapter. Initiation and Evolution of the Bridge Programs: On December 15, 1967, the Silver Bridge carrying US 35 between Point Pleasant, West Virginia and Gallipolis (Kanauga), Ohio collapsed during rush-hour traffic. Thirty-one vehicles fell into the Ohio River or onto the Ohio shore killing 46 people and injuring 9. The collapse, which was the first major failure of a structure since the wind-induced failure of the Tacoma Narrows Bridge in 1940, prompted national concern about bridge conditions and safety. Congressional hearings on the failure resulted in mandates requiring the U.S. Secretary of Transportation to develop and implement the National Bridge Inspection Standards (NBIS). The NBIS, developed by FHWA in cooperation with the American Association of State Highway and Transportation Officials (AASHTO), was enacted as part of the Federal-Aid Highway Act of 1971. This landmark legislation was enacted on April 27, 1971 and established, for the first time in U.S. history, uniform, national standards for bridge inspection and safety evaluation. The Act also designated funding for the replacement of deficient bridges on the Federal-aid highway system. Through the legislation:
Since its enactment, the NBIS has been fine-tuned, additional inspection requirements have been added, and funding programs have been updated. It quickly became evident that safety assurance was required for all structures located on public roadways. The requirement to inventory and inspect bridges on Federal-aid highways was extended to all bridges in excess of 6.1 meters (20 feet) located on public roads. Data collection requirements were enhanced, and training programs continued to be developed and expanded as more knowledge became available through research and experience. Funding programs were expanded to permit the use of Federal funds for replacement of both Federal-aid and non-Federal-aid bridges. Despite efforts to continually enhance the process of bridge inspection, unforeseen events periodically necessitated expansion. On Interstate 95, the primary highway on the Atlantic seaboard that provides connectivity between Florida and Maine, approximately 30 miles east of New York City, near Greenwich, Connecticut. On June 28, 1983, a section of the Mianus River Bridge catastrophically failed due to instantaneous fracture of a pin and hanger detail. This failure resulted in several fatalities and disrupted commerce in the Northeastern U.S. for several months. Following this event, significant research into fatigue of steel connections was performed and tremendous insight into the behavior of steel connections was obtained. The program was enhanced to incorporate more rigorous inspection procedures for fracture critical structures. Training programs were developed putting the research results and accumulated experience and understanding of fatigue and fracture into practice. On April 5th, 1987, disaster struck again with the collapse of a bridge carrying the New York State Thruway (Interstate 90) across the Schoharie River. With rising water levels due to localized flooding, the soil around the pier was simply washed away. This was followed by the subsequent loss of bearing capacity for the foundation of the center pier, which lead to the catastrophe. Several fatalities resulted from this failure. Other notable scour-induced failures have occurred throughout the country, including the collapse of the Hatchie River Bridge in Tennessee on April 1, 1989. These bridges indicated the potential problem, given that a more than 80 percent of the bridges on public roads cross over waterways. With approximately 475,000 structures crossing waterways, program enhancement was required. FHWA acted quickly by providing guidance for scour assessment and requiring periodic underwater inspection of all structures at risk and susceptible to scour damage. The combination of research, experience, and technology transfer of knowledge acquired has been used to train professionals performing inspections of fatigue and scour susceptible structures. Catastrophic failures, such as the Mianus River and the Schoharie Creek bridges, due to scour and fatigue have been avoided. Additional knowledge is required on these and other extreme events, such as earthquakes and collisions, to avoid such calamities in the future. Research efforts performed by FHWA and the transfer of results to experienced engineers practicing in the field continue to proactively mitigate potential failures. Catastrophic events highlighted the need to replace bridges before they collapse. The Special Bridge Replacement Program (SBRP), created by the Federal-Aid Highway Act of 1971, which provided funds to help States replace bridges, required expansion to permit rehabilitative activities. Again, action was taken and, in 1978, the Surface Transportation Assistance Act of 1978 replaced the SBRP with the Highway Bridge Replacement and Rehabilitation Program (HBRRP). The program initiated through the Federal Aid Highway Act of 1971 has been incrementally enhanced so that today all structures in excess of 6.1 meters (20 feet) on public roads receive, in general, biennial safety inspections. Notable changes in legislation can be seen in Exhibit 11-1. "Best-practices" for routine, fracture critical, and underwater inspections have been defined and published. Qualifications of inspection personnel have been established, and training programs implemented to ensure completeness of engineering reviews and consistency of inspection condition assessments.
Summary of Major Bridge Inspection and Bridge Program Funding Legislation and Noteworthy Changes
Information Collected Through the Bridge Inspection ProgramAs part of the National Bridge Inspection Standards (NBIS), qualifications of key personnel have been identified, training programs developed and offered to bridge owning agencies, assistance with bridge program development provided, and minimum data collection requirements defined. The information that is obtained through the process defined by the NBIS is discussed below. This information forms the basis for the subsequent examinations of the conditions and performance information presented later in the chapter. For most structures, the NBIS requires visual inspection once every two years. For structures with safety concerns, inspections may be performed more frequently. Likewise, for structures with special favorable characteristics, the period of observation may be increased. The bridge owners (States, cities, municipalities, etc.) are responsible for these inspections with oversight by the State Department of Transportation (DOT). Information is collected on the bridge composition and conditions and reported to FHWA where the data is maintained in the National Bridge Inventory (NBI) database. This information forms the basis of the bridge safety assurance efforts and provides the mechanism for the determination of fund requirements and fund apportionments. The FHWA provides oversight of the States compliance with the requirements of the NBIS.
The NBI database contains the following types of information: Inventory information characterizing the structure, Condition Ratings, Appraisal Ratings, and Calculated Fields. Inventory information includes location and description fields, geometric data (lengths, clearances, lane widths), functional descriptions (classification, NHS Designation, service carried and crossed, etc.), and design characteristics (superstructure designs and materials, deck types, design load, etc.). This information permits classification of structures according to serviceability and essentiality for public use. The composition of structures in the network can be ascertained through examination of the inventory data. The NBI database represents the most comprehensive source of information available on the National-level. Through periodic safety inspections, data is collected on the condition of primary components of the structure. Condition ratings are collected for the following components on the bridge:
The culvert condition rating describes all structural elements of culvert designs, which do not have a distinct deck, superstructure, and substructure. The channel/channel protective system rating describes the physical conditions of slopes and the channel for water flow through the bridge. Bridge inspectors utilize a ten (10) point system, where code 9 indicates excellent, as-new condition and code 0 indicates a failed condition. Codes 7–9 indicate satisfactory to excellent conditions. Codes 5 and 6 indicate either fair or satisfactory conditions of the components. Codes 4 and less indicate poor, serious, critical conditions, conditions representing imminent failure of the component or failed conditions. The description of the condition rating codes has been illustrated in Exhibit 3-21. Inspectors assess the ratings in a visual fashion based on engineering expertise and experience. Extensive training for inspectors is provided and references are available to guide assignment of the ratings. These ratings form the basis for assessing the structural condition of the bridge. Functional adequacy is also a concern in the bridge population. Following collection of the inventory information and condition ratings, appraisal ratings are calculated to assess the adequacy of the structure to provide the required service. Appraisal ratings are quantified for:
A bridge may be structurally deficient and/or functionally obsolete. These determinations are assessed based on the condition and appraisal ratings. Structural deficiencies result from poor condition ratings or from low load ratings. Functional obsolescence results from low appraisal ratings or from low design-load capacities. Inadequate waterway adequacy can be a contributing factor for either structural deficiencies or functional obsolescence. Composition and Status of Bridge SystemComposition:In describing the characteristics of the current highway system, the following information was summarized in Chapter 2:
This section of the chapter expands on the information presented in Chapter 2. More information is presented for specific ownership, functional classifications, superstructure materials, and designs in the last portion of the chapter. Information is presented to highlight the details of the bridge inventory composition and to highlight conditions in greater detail. Traditionally, information is often presented by numbers of bridges and every bridge in the inventory is counted equally. Thus, large suspension bridges, such as the Golden Gate or the George Washington Bridge, are considered equivalent to small, two-lane bridges carrying low volumes of traffic. In some cases, insight into the condition or the composition may be obtained by considering the size of the structure and/or the traffic carried. Considerations of size of the structure will be incorporated through presentation of information using the deck area of the bridge. Considerations of the volume of traffic served by the structure will be incorporated through presentation of information using the Average Daily Traffic (ADT). The NBIS contains nearly 700,000 records, which describe either the features carried by the bridge, termed as “on” records, or the features crossed by the structure, termed as “under” records. Separating the on-records from the under records reveals that there are 586,930 bridges over 6.1 meters (20 feet) in total length located on public roads in the United States. These bridges, on average, carry 3.8 billion vehicles per day and comprise a total deck area in excess of 315 million square meters.
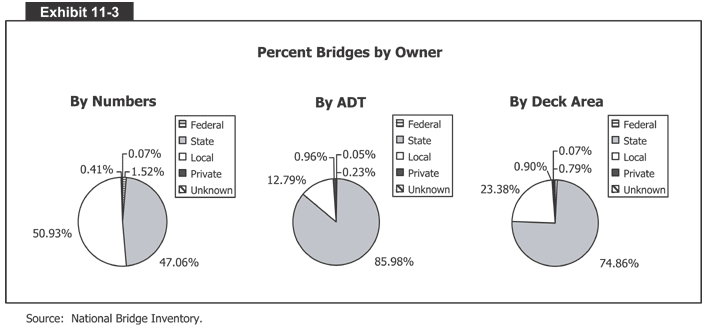
The majority of structures are owned by State and Local agencies (47 percent and 51 percent of the bridges respectively). Comparing bridge ownership to roadway ownership (20 percent and 77 percent State and local ownership respectively) shows that there is a much higher percentage of State ownership in the bridge network. State and local agencies, when taken together, own 97 percent of the roadways and 98 percent of the bridges by numbers. Considering functional classification, as presented in Exhibits 2-10 and 2-11, the number of rural bridges has remained relatively static, while the number of urban bridges has increased slightly from 1996 to 2000. This information is elaborated upon in Exhibit 11-2, which presents a cross-tabulation between the functional class and the ownership. It also shows percentages of bridges weighted equally (by numbers), by Average Daily Traffic (ADT) carried, and by deck area.
Bridges
by Ownership and Functional Classification
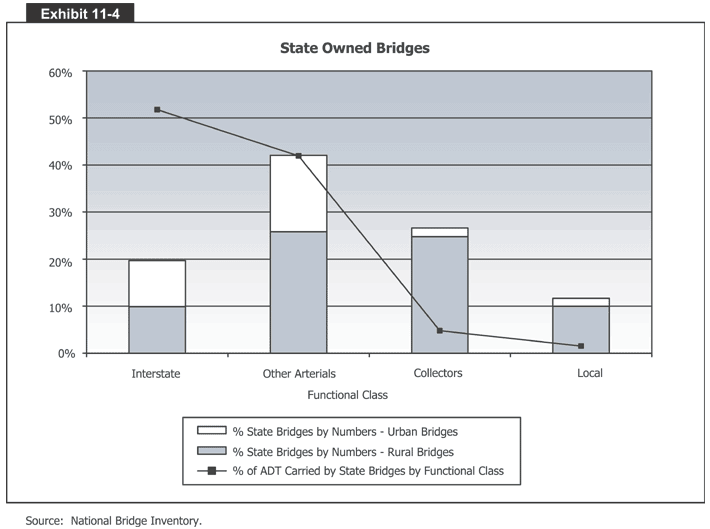
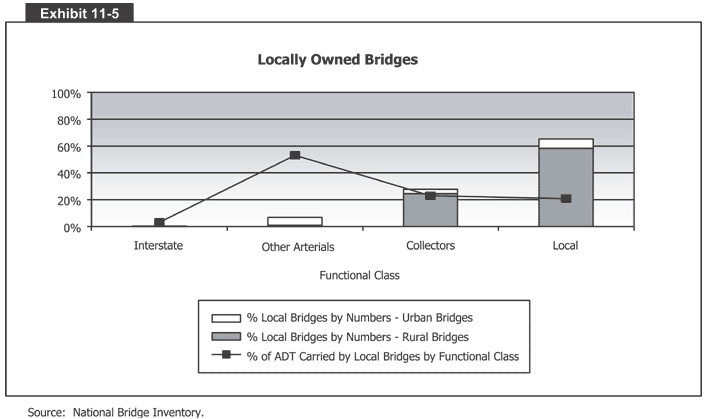
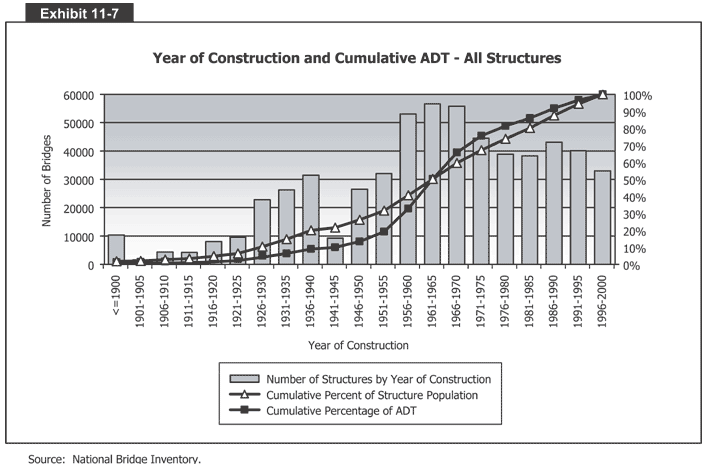
* Note that the table does not include structures with unknown functional classifications (528 structures). Exhibit 11-2 shows rural bridges make up 77.6 percent of all structures. Urban bridges comprise 22.3 percent of the inventory, carry over 73 percent of the daily traffic, and constitute 51.8 percent of all the deck area. Urban bridges tend to be larger in deck area and carry more traffic. This indicates the magnitude of the disparity between urban and rural structures in terms of traffic and size. A similar trend is found between functional classifications where Interstates and other arterials, which comprise approximately 1/3 of the inventory by numbers, but carry close to 90 percent of all the daily traffic, and have approximately 70 percent of the total deck area. Exhibit 11-3 shows percentages by owner where the percentages are evaluated in terms of numbers, traffic carried, and deck area. By each measure, State and locally owned bridges dominate the population in terms of percentages. State bridges tend to be larger and carry higher volumes of traffic. State owned bridges are located on higher functional class roadways (Interstates and principal arterials), whereas locally owned structures tend to be located on lower functional class roadways (collectors and local roadways). The number of bridges and traffic carried are shown by functional classification for State-owned bridges in Exhibit 11-4 and for locally owned bridges in Exhibit 11-5. Bridges in the inventory are, on average, approximately 40 years old, with an average year of construction of 1963 for rural and urban structures. (See Exhibit 11-6.) The year of construction distribution and the cumulative number of structures and ADT are shown in Exhibit 11-7.
Average Year of Construction by Functional Classification and Ownership - All Structures
Urban structures are slightly younger than rural structures. The average age of structures does not significantly vary by ownership with the exception of private owners. The private bridge population, which includes those owned by railroads and other private owners, are on average more than 50 years old. Exhibit 11-7 shows the year of construction distribution and the cumulative percentage of bridges and ADT carried. Decreased bridge construction occurred during World War II. Following this period, there was a large increase in the number of bridges constructed. This is generally attributed to the Interstate construction "boom". The chart indicates a large increase in daily traffic on new structures. A large percentage of this traffic nevertheless utilizes older structures on a daily basis, with 50 percent of all the daily traffic in the United States using bridges that are more than 40 years old. Additional information on the composition of the bridge inventory is presented in the last portion of this chapter. Deficiencies:In Chapter 3, an overview of the condition and performance of bridges was presented. The following information was included in that chapter:
Deficiencies in the bridge population occur as the result of structural or functional causes, as previously described. These types of deficiencies are not mutually exclusive and a bridge may be both structurally deficient and functionally obsolete. In general, when deficiency percentages are presented, however, the structures are indicated as structurally deficient, functionally obsolete, or non-deficient. As structural deficiencies may imply safety problems they are considered more critical and thus a bridge that is both structurally deficient and functionally obsolete is only identified as structurally deficient. A portion of the structurally deficient population will also have functional issues that must be addressed. Bridges that are indicated as functionally obsolete do not have structural deficiencies. Overall, there are 167,566 deficient structures within the highway bridge network representing 28.6 percent of the total inventory of highway bridges. There are 90 million square meters of deck area on deficient bridges carrying over 1 billion vehicles daily. The number of deficient bridges by owner and functional classification are shown in Exhibit 11-8 by rural and urban designations. Percentages shown in this exhibit are the percentages of all structures for the owner/functional class combination, (i.e. - 16 percent of rural Interstate bridges owned by State agencies are deficient). In general, urban bridges have higher deficiency percentages than rural bridges. This is particularly evident when examining the Interstate and arterial structures. There are a significant number of deficient local bridges. Exhibit 11-8 shows the deficiency percentages, in general, are usually lower for the higher functional classification (Interstates and principal arterials). There are higher percentages of deficiencies for bridges on local roads, regardless of the owner.
Number and Percent of Deficient Bridges by Ownership and Functional Class
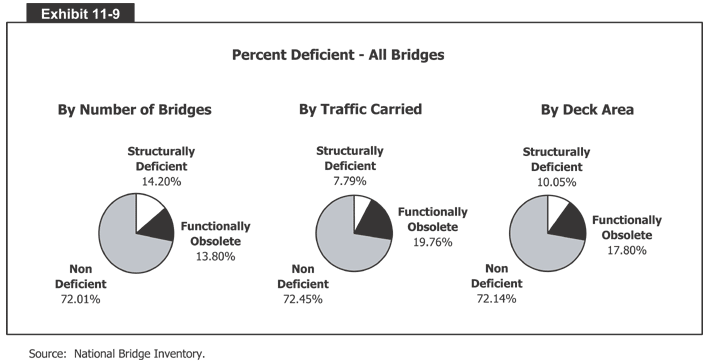
The percentages of bridges with structural deficiencies, functionally obsolete conditions, and non-deficient designations are indicated in Exhibit 11-9. In general, the total percentage of deficiencies is approximately the same when the percentages are determined by numbers, traffic carried, and deck area; however, when traffic carried and deck area are considered, the impact of functional obsolescence becomes more pronounced. Percent deficiencies for each functional classification are shown in Exhibit 11-10, including deficiencies with bridges weighted equally (by numbers), bridges weighted by the traffic carried (by ADT) and bridges weighted by the deck area. The data in this exhibit shows that there are no major differences between the deficiency percentages whether these are based on the total number of bridges, ADT, or area. In general, there are few functionally obsolete bridges, in terms of percentages, in the rural bridge population.
Percent
Deficient Bridges by Numbers, ADT and Deck Area by Rural and Urban Designation
and Functional Class
Deficiencies are higher for urban bridges, which in general have a larger percentage of functionally obsolete bridges. Actions Taken to Remove Deficiencies:Over $55 billion in HBRRP funding alone has been allocated and utilized to ensure safety and continuing functionality of the bridge network. Actions are taken on deficient bridges to mitigate the cause of the deficiency. The types of work performed were examined using summary information produced by the Federal Highway Administration. The 1998 summary of bridge construction and bridge rehabilitation activity with Federal fund participation through shows:
In 1990, 17 percent of activity with federal fund participation involved new bridge construction. This percentage has decreased from 1990 to 1998. Currently, approximately 90 percent of all projects receiving Federal fund participation involve reconstruction or rehabilitation. Exhibit 11-11 tabulates the number of deficient bridges reconstructed, as indicated in the NBI database. The information is presented by owner, functional classification, and rural/urban designation. The average number of years after construction before reconstruction was undertaken is also indicated. On average, Interstate bridges are reconstructed approximately 20 years after they are placed in service. The time to reconstruction is longer for other functional classifications. In general, urban bridges are reconstructed earlier, in terms of their age, than rural bridges. Progress has been made in reducing the deficiencies. Approximately 85,000 structures (15 percent of the inventory) have been reconstructed or rehabilitated. Reconstruction and rehabilitation efforts have contributed to the reduction in deficiencies shown and discussed in Chapter 3.
Number
of Bridges Reconstructed or Rehabilitated and Average Number of Years Before
the Action was Undertaken
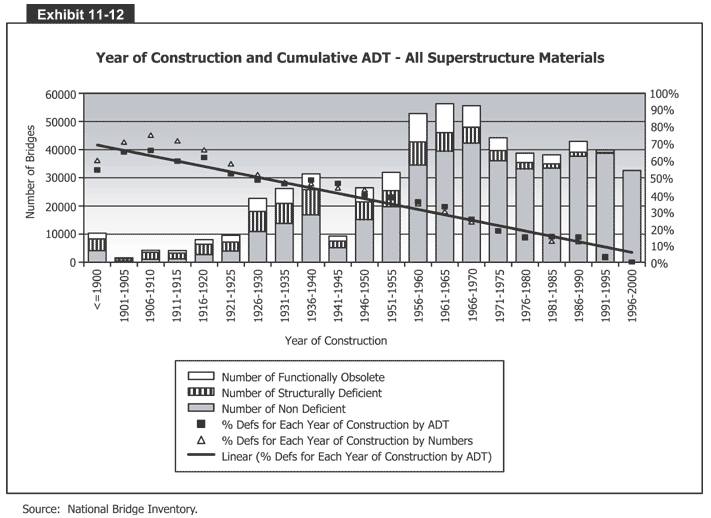
When a structure is placed in service, the deterioration process begins on the components of the bridge. The rate of deterioration was examined by the percentage of deficiencies by year of construction. (See Exhibit 11-12.) As bridges age, increasing numbers of structures become deficient and increasing funds are required to remove the deficiency. This is a concern with the increasing age of the large Interstate population and the relatively short period of time for the average reconstruction effort on Interstate bridges. With this ever-aging, continually deteriorating population of highway structures, increasing traffic demands, and limited budgets, a closer look at transportation system preservation strategies including preventative maintenance and improved bridge inspection and management techniques is warranted. |
||||||||||||||||||||||||||||||||||||||||||||||||||||||||||||||||||||||||||||||||||||||||||||||||||||||||||||||||||||||||||||||||||||||||||||||||||||||||||||||||||||||||||||||||||||||||||||||||||||||||||||||||||||||||||||||||||||||||||||||||||||||||||||||||||||||||||||||||||||||||||||||||||||||||||||||||||||||||||||||||||||||||||||||||||||||||||||||||||||||||||||||||||||||||||||||||||||||||||||||||||||||||||||||||||||||||||||||||||||||||||||||||||||||||||||||||||||||||||||||||||||||||||||||||||||||||||||||||||||||||||||||||||||||||||||||||||||||||||||||||||||||||||||||||||||||||||||||||||||||||||||||||||||||||||||||||||||||||||||||||||||||||||||||||||||||||||||||||||||||||||||||||||||||||||||||||||||||||||||||||||||||||||||||||||||||||||||||||||||||||||||||||||||||||||||||||||||||||||||||||||||||||||||||||||||||||||||||||||||||||||||||||||||||||||||||||||||||||||||||||||||||||||||||||||||||||||||||||||||||||||||||||||||||||||||||||||||||||||||||||||||||||||||||||||||||||||||||||||||||
| Back |