U.S. Department of Transportation
Federal Highway Administration
1200 New Jersey Avenue, SE
Washington, DC 20590
202-366-4000
|
Status
of the Nation's Highways, Bridges, and Transit:
2002 Conditions and Performance Report |
| Chapter 13: Highway Transportation in Society | |||||||||||||||||||||||||||||||||||||||||||||||||||||||||||||||||||||||||||||||||||||||||||||||||||||||||||||||||||||||||||||||||||||||||||||||||||||||||||||||||||||||||||||||||||||||||||||||||||||||||||||||||||||||||||||||||||||||||||||||||||||||||||||||||||||||||||||||||||||||||||||||||||||||||||||||||||||||||||
|
Index Introduction Highlights Executive Summary Part I: Description of Current System
Part II: Investment Performance Analyses
Part III: Bridges
Part IV: Special Topics Part V: Supplemental Analyses of System Components
Appendices |
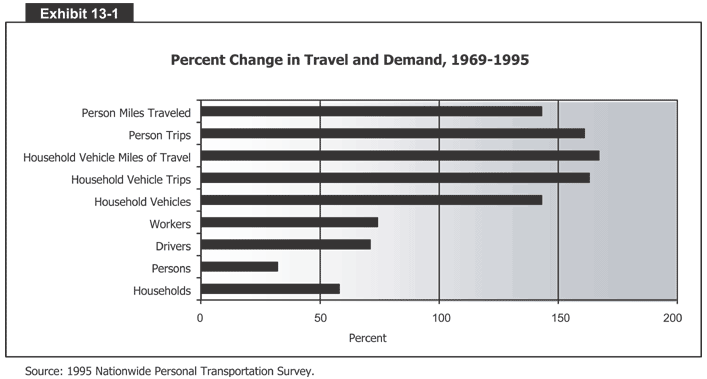
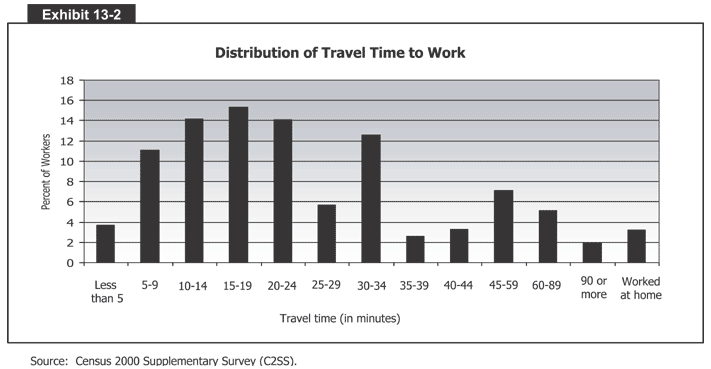
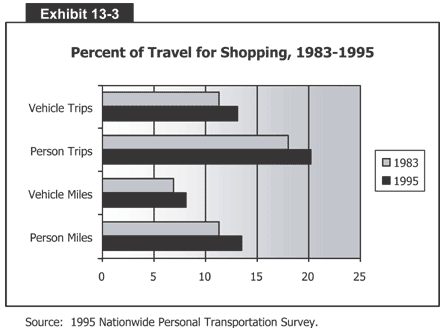
IntroductionThe extensive U.S. transportation system connects markets and people across the continent. Its quality and pervasiveness are almost transparent to us as we move between jobs, markets, education, healthcare, and leisure activities. An efficient transportation system has always been central to economic, social, and cultural development. The affluence and mobility of our society has resulted in a demand for travel and access that often outstrips the supply. As income rises, travel increases and the range of goods and services accessible to the public increases. Increased travel has the potential of creating greater congestion on the transportation system thereby threatening its efficiency. The forecasting of the changes required to provide an efficient transportation system able to meet the Nation's future demands requires an understanding of the current system, its strengths and weaknesses, and the key factors shaping future demands and needs. Changes in Travel DemandChapter 2 describes the extent of the Nation's highway and transit systems and the continuing growth of travel occurring on them. In both passenger and freight activity, the demand for highways has grown faster than the systems designed to serve that demand. The general effects of this disparity between transportation supply and transportation effects are highlighted in Chapter 4, while related issues pertaining to freight transportation are discussed in Chapter 22. Each man, woman, and child in this country, spends, on average, an hour a day traveling in cars and buses or walking. 100 million U.S. households generate more than a billion person trips and over nine billion person miles of travel in a typical day. It is not surprising that a small delay in travel, when multiplied by the tremendous number of people affected, can result in vast amounts of wasted time, energy, and fuel. The United States has grown by about 25 million people per decade since 1950, but the decade between 1990 and 2000 added 32.7 million. During these years, the increase in the rate of travel has been even more dramatic. Since 1969, the number of people in the United States grew by 32 percent, while person miles of travel increased by 143 percent. U.S. households grew by 58 percent over the same period, while the rate of household vehicle travel grew nearly twice as fast—163 percent. (See Exhibit 13-1.) Many factors have contributed to the explosive growth in personal travel, including the population surge of the baby boomers, high levels of immigration, increases in the number of households as household size declines, greater rates of participation of women in the labor force, increased rates of vehicle use by older drivers, improved incomes, and continued diffusion of residential, work, service, and recreational locations into the suburbs and beyond. Whether these and other factors will continue to fuel growth in travel at high levels into the 21st Century remains to be seen. Freight transportation has also experienced major growth. Between 1993 and 1997, the weight of commodities shipped by truck from U.S. establishments increased 20.6 percent, equating to an average annual rate of 4.9 percent per year (National Transportation Statistics 2000, Table 1-48, p. 72). Total miles traveled by larger trucks increased even faster at an average annual rate of 6.2 percent per year. The average miles traveled by trucks grew at an average annual rate of 4.0 percent per year during this period (USDOC Census 1997). Recent economic prosperity has generated more goods to ship. Economic integration on a global scale increased the quantity of goods moved and greatly extended shipping distances. The value of goods being transported has increased, while the weight of goods shipped has declined. These trends are explored in Chapter 22. Together, increasing demand for transportation, growing affluence of travelers, and increasing value of goods being shipped have placed a premium on fast, reliable transportation. The vast majority of households and businesses depend on highways to meet their needs and are willing to pay for premium service. This is demonstrated by the dramatic growth of nationwide overnight delivery services that charge far more than traditional carriers who took days or weeks to reach their final destination. CommutingOne of the primary functions of the transportation system in the economy is to provide access to producers, retailers, and consumers. But just as important is a worker's ability to efficiently get to work. For example, welfare reform effectiveness is limited by the extent to which people moving off public assistance who require public transportation are provided such transportation. Working-age immigrants living in suburban communities with transportation limitations often experience difficulties in finding employment. The transportation system provides a direct bridge into the economy and society by providing the stability and connection of access to a daily job for workers. For many Americans, the trip to work is the dominant focus of travel each day. According to the U.S. Census Bureau's American Community Survey, approximately 123 million people in the United States commuted to work outside the home in 2000. Of these commuters, 76 percent drove alone, 11 percent carpooled, 5 percent took public transit, and the remainder worked at home or walked. The distribution of their travel times is shown in Exhibit 13-2 and discussed in Chapter 4. Between 1960 and 1990 the numbers of workers in the U.S. increased 78 percent, twice as fast as the population as a whole. This was partly due to more women entering the workforce. Nearly 15 percent of commuters travel more than 45 minutes. The number commuting more than 60 minutes has reached 9 million workers or about 7 percent of commuters. On the other hand, 30 percent of workers commute less than 15 minutes one-way. (See Exhibit 13-2.) More workers in the service sector with its non-traditional hours, and greater flexibility in traditional workplaces lead to new patterns and schedules of work. Nearly 15 percent of all the trips made on the weekend are work trips (8.4 on Saturday and 6.4 percent on Sunday) compared to just over 20 percent of trips on an average weekday. Shopping-related TravelConsumer purchases are a central part of the U.S. market economy. Thus, it is no surprise that shopping trips account for a large portion of daily travel. Shopping trips are considered part of household maintenance, regardless of the type of store. Moreover, as income rises, so do discretionary trips for specialty purchases. Shopping comprises one out of every five person-trips and one out of every seven person miles traveled. Virtually every household—whether or not it includes workers—makes shopping and household serving trips, such as buying groceries or meals, buying household goods and supplies, and conducting other family errands. (See Exhibit 13-3.) Our very mobile populace has access to far-flung specialty stores and niche markets, as well as large supermarkets and discount stores. The average American makes 4 shopping trips a week. Overall, more than 3 1/2 hours per week are spent in traveling to shops and shopping. The number of separate person trips to shop grew by 12 percent in the last 20 years, and the number of miles traveled to shop increased by nearly 20 percent. Women make more total trips per day than men, on average, because they make more stops for day care and school drop-offs, shopping, and other family errands. This means that women are more likely to chain these errands to their commute trips. Almost two-thirds of working women make at least one stop on the way home on an average weekday. The data show that the vast majority of shopping trips, 77 percent, take place on weekdays, although nearly 30 percent of all the trips taken on a Saturday are to shop. Trip chaining will continue to be a significant and growing feature of the way Americans travel. In addition, Internet shopping is rapidly becoming a vibrant marketplace for buyers and sellers of a fastgrowing pool of consumer goods and services. However, early data indicate that shopping via the internet does not diminish daily travel—people who report more internet shopping make more trips overall within the same income and age groups. Education-related TravelEvery day, about 450,000 school buses carry 23 million children to school nationwide. Today, a little more than one-third of all schoolchildren take a bus to school. But the proportion of children who travel to school by bus and walking has declined in the last 20 years. More than half of America's school children ages 5 to 15 arrive at school in a car, and just one out of ten students walks to school. Trips to and from school account for about a quarter of the trips made by children ages 5 to 15 years old. (See Exhibit 13-4.)
Exhibit 13-5 shows that the amount and type of school trips vary greatly by age. In the United States, children under 16 years old are mandated to go to school. In recent decades, higher education has become common among adults as a life-long pursuit. Many adults go to school as part of their continuing education in their current professions, to train for career changes, to learn languages and hobbies, and for other reasons. About the same percent of school trips are made by middleaged people (35 to 64 years of age) as are made by those aged 25 to 34 years.
The transportation system provides access to colleges and universities for a larger proportion of Americans simply because highway facilities are better. A two-hour commute to the university two or three times a week is not impossible for students who want to continue to live at home. Many senior citizens also are continuing their education as part of their retirement plans. There are about 300 “learning in retirement” programs in the country, most of which are affiliated with colleges. Rural areas are consolidating grammar schools because of the access afforded by better transportation facilities—in the past children had to be able to walk to school. The consolidated schools offer a broader education, and often better education, than the old “one-room” schoolhouses. Leisure and Recreation TravelAn increasing amount of travel, both long and short trips, is made for recreation. Congestion around attractions and leisure spots can be worse than congestion in a city center at rush hour. More person hours are spent in a car (by passengers and drivers) on the weekends than any weekday—two and a half hours on average for Saturday and Sunday versus two hours on average on weekdays. Many weekend trips are made for local shopping and errands, but many miles are also traveled for recreation and social purposes. Travel for leisure and recreation can encompass trips to a weekend cabin or trips across country. About 28 percent of all longer-distance travel by U.S. residents is for recreation and leisure (trips of 100 miles or more). That is a higher percentage than any other single purpose trip except for visiting friends and relatives. Trips for leisure are generally longer than other trips—42 percent of recreation and leisure trips are to places 500 miles away or more and the average trip length is 415 miles. More than 84 percent of recreational travelers use a personal vehicle for the trip, and if they travel on a weekend trip, more than 90 percent are in cars. (See Exhibit 13-6.)
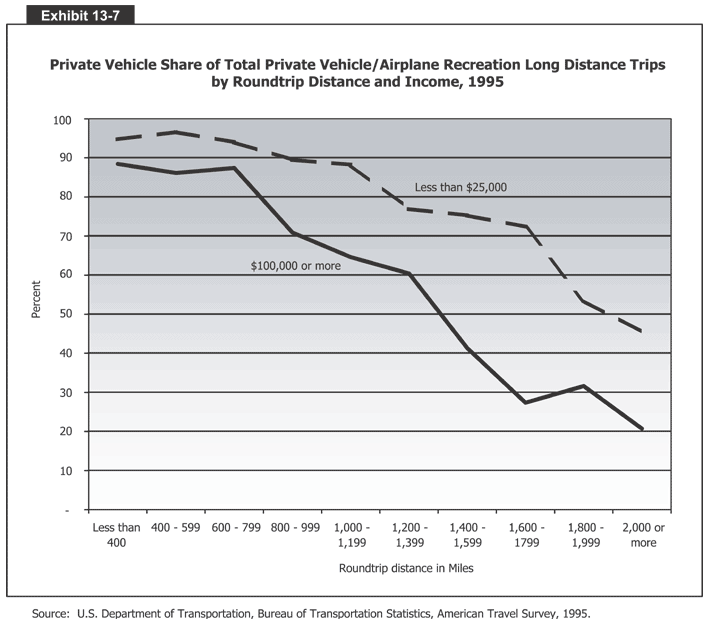
Average travel party size is greater for recreation and leisure trips. For trips over 100 miles, 35 percent were made by two people, and 37 percent were made by three or more people. People in low-income households (less than $25,000/year) are more dependent on private vehicles to make longer-distance recreational trips than those in higher-income households ($75,000 or more). The gap widens as trip length increases. For families who travel together, the auto is convenient and additional passengers (kids, neighbors, pets) add no extra transportation cost. (See Exhibit 13-7.) Exhibit 13-8 shows that leisure travel is also very seasonal, with the majority of recreational trips made in the spring and summer. In the winter season, New Year's is a more popular time for leisure travel than either Thanksgiving or Christmas. During the five days surrounding New Year's Day, Americans make an average of 6.3 million trips per day.
During the coming years, a large segment of U.S. residents will retire from daily work, increasing the demand for more access to leisure activities. If today's mobile and affluent baby boomers insist on maintaining their mobility, high rates of leisure travel could occur. Future recreational travel may have a negative effect on the system. Therefore, our current strategies for coping with congestion may not be adequate since travel for recreation can occur at any hour of the day and in places that may not be prepared for large amounts of auto traffic. Household Transportation ExpendituresHighway transportation meets many household needs and represents a major household expense. Households spend more money, on average, on transportation than any other expenditure category except housing. Exhibit 13-9 shows that in 1999, households, on average, spent about $7,000 on transportation, or 18.9 percent of their total spending. This share was slightly lower than that in 1984 (the first year for which data are available).
Roughly 94 percent of household transportation expenditures went to purchase, maintain, and operate cars and other private vehicles. Purchased transportation services, including airline, intercity train and bus, and mass transit, accounted for less than 6 percent of household transportation expenditures in 1999. (See Exhibit 13-10.)
Measured in constant 1982 dollars, household transportation expenditures decreased 2 percent between 1984 and 1998. During the same period, vehicle-miles traveled per household increased about 27 percent, indicating that transportation had become cheaper to consumers.The age of the head of the household also influences transportation spending. Household transportation expenditures rise as the age of the head of the household increases, peaking between 45 years and 54 years of age and then decreasing. In 1999, for example, households in which the head of the household was between 45 years and 54 years of age spent, on average, $9,028 on transportation. Households in the under 25 years of age category spent a little more than half of that amount. Spending on transportation was lowest in households headed by people 75 years of age or older. However, transportation as a share of total household expenditures was highest in young households, averaging 23.2 percent. The percentage decreased gradually as age increased, reaching its lowest point at 14 percent for households in the 75 years and over age category. Half of the transportation expenditures in young households went to purchase vehicles, compared with 37 percent for households in the oldest age group. Moreover, younger households spent a smaller share of transportation expenditures on purchased transportation services, such as air travel, mass transit, and taxi fares. Truck TravelThe logistical needs of business establishments are met by about 21 million trucks traveling more than 412 billion miles annually. The number and mileage of trucks by industry is shown in Exhibit 13-11.
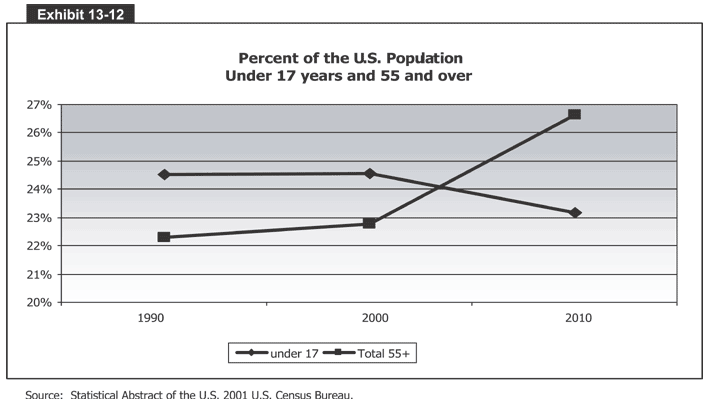
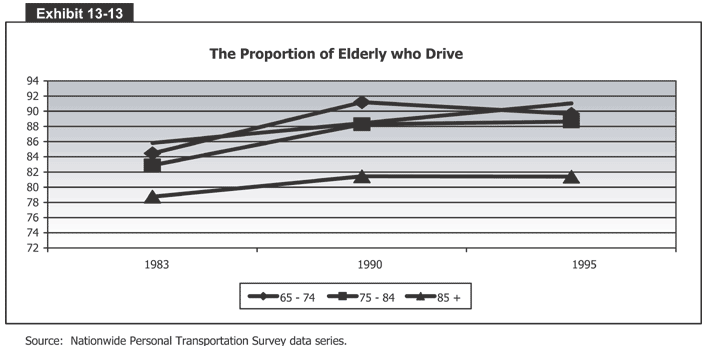
In addition to truck travel, business make extensive and unmeasured use of automobiles and station wagons for sales and a host of other activities. Rental cars and taxis are the dominant mode of local travel in distant locations for business travelers once they leave the airport, and private vehicles are used heavily on business trips to reach destinations between 50 miles and 500 miles from home. Future of MobilitySociety benefits from having a range of transportation choices. System diversity can help solve many specific transportation problems and create a more efficient, equitable, and robust transportation network. As our society addresses mobility, congestion, air quality and climate change issues, it is vital that research and innovation continues and that investments are made in new and existing infrastructure and operations. The opportunities offered by transportation research include understanding the complex role travel plays in the American economy and society, the public's travel needs and behavior, and the effects of technology on travel and related behavior. Two sets of factors are worth highlighting: social and demographic changes, and environmental impacts. Societal and Demographic FactorsAn Aging PopulationIn 2000 there were 55 million children under the age of 17 in the United States. Although children represent a smaller percentage of the population than they did during the peak of the baby boom, they account for a substantial portion of the population. In contrast, there are 51.5 million people aged 55 and over—almost one out of four people in the United States. The median age of the American population rose form 28 in 1970 to 37 years old in 2000. The proportion of the population over 55 years old is projected to be nearly 30 percent by 2020. (See Exhibit 13-12.) The Nationwide Personal Transportation Survey (NPTS) describes the remarkable mobility that is part of the fabric of U.S. society. Much more needs to be done to ensure that all U.S. citizens have access to this mobility. Some groups continue to be disenfranchised from certain social and economic benefits. The survey data and related data sources show that less mobile groups—low-income, elderly, recent immigrants, physically handicapped, and, to some degree, people of color—do not have the same access to the range of goods and services that are available to groups with greater travel choices. The NPTS shows that more elderly are driving well into their eighties and nineties. The aging of our population has profound implications for safety and travel. (See Exhibit 13-13.) Furthermore, most people retire in their own neighborhoods. Therefore, the majority of elderly people now live in the suburbs and are more dependent on cars than previous generations. As driving skills decline with age, the vulnerability to injury in a collision increases. The mobility needs of older people will require alternatives to the automobile. Environmental FactorsChanging personal travel and vehicle ownership patterns have profound implications for air quality, global climate changes, and energy policies. The effects of transportation on the natural environment have been a topic of much public discussion and debate in recent years. At the heart of the debate are air quality issues associated with the use of private vehicles. The use of private vehicles has expanded over the last quarter century, particularly for single-occupant trips. In addition, two trends may have an impact on safety, air pollution, and energy consumption. They are the aging of the fleet and the substitution of vehicles classified as light duty trucks—pick-up trucks, vans, and sport/utility vehicles (SUVs)—for automobiles in household travel. The average household car is more than eight years old. The continued tendency to maintain older vehicles increases the time for market penetration by newer and cleaner cars. Exhibit 13-14 shows the average age of the vehicle fleet by vehicle type from 1977 to 1995. Average ages for individual light truck classes (vans, SUVs, and pick-ups) are not available.
Increased vehicle age can be attributed to the longer life span and greater durability of vehicles produced in the last decade and the significant price difference between new and used vehicles. As a result, the progressively tighter safety, fuel economy, and emissions standards that passenger vehicles are required to meet have been incorporated into the Nation's fleet more slowly than originally anticipated. These standards have typically been more stringent for automobiles than for light trucks, therefore the greater use of vans and SUVs also may affect these policies. Air quality issues are discussed in more depth in Chapter 19. Research OpportunitiesThis chapter highlights the importance of highway transportation as a share of household expenditures and as a component in the output of American businesses. These contributions are built on an effective transportation system that gets people and goods to desired destinations quickly and efficiently. As described elsewhere in this report, this quickness and efficiency is being challenged by delays from congestion, temporary losses of capacity, and the new focus on security measures. Additional research on the travel patterns of specific subsets of the traveling public can help transportation agencies to better anticipate and react to changing trends and meet public demands for efficient, equitable, and safe transportation mobility and access.
|
||||||||||||||||||||||||||||||||||||||||||||||||||||||||||||||||||||||||||||||||||||||||||||||||||||||||||||||||||||||||||||||||||||||||||||||||||||||||||||||||||||||||||||||||||||||||||||||||||||||||||||||||||||||||||||||||||||||||||||||||||||||||||||||||||||||||||||||||||||||||||||||||||||||||||||||||||||||||||
| Back |