U.S. Department of Transportation
Federal Highway Administration
1200 New Jersey Avenue, SE
Washington, DC 20590
202-366-4000
|
Status
of the Nation's Highways, Bridges, and Transit:
2002 Conditions and Performance Report |
| Chapter 3: System Conditions | |||||||||||||||||||||||||||||||||||||||||||||||||||||||||||||||||||||||||||||||||||||||||||||||||||||||||||||||||||||||||||||||||||||||||||||||||||||||||||||||||||||||||||||||||||||||||||||||||||||||||||||||||||||||||||||||||||||||||||||||||||||||||||||||||||||||||||||||||||||||||||||||||||||||||||||||||||||||||||||||||||||||||||||||||||||||||||||||||||||||||||||||||
|
Index Introduction Highlights Executive Summary Part I: Description of Current System
Part II: Investment Performance Analyses
Part III: Bridges
Part IV: Special Topics Part V: Supplemental Analyses of System Components
Appendices |
Pavement Terminology & MeasurementsPavement condition affects costs associated with travel, including vehicle operation, delay, and crash expenses. Poor road surfaces cause additional wear or even damage to vehicle suspensions, wheels, and tires. Delay occurs when vehicles slow for potholes or very rough pavement; in heavy traffic, such slowing can create significant queuing and subsequent delay. Unexpected changes in surface conditions can lead to crashes, and inadequate road surfaces may reduce road friction, which affects the stopping ability and maneuverability of vehicles. The pavement condition ratings in this section are derived from one of two measures: International Roughness Index (IRI), and the Present Serviceability Rating (PSR). The IRI measures the cumulative deviation from a smooth surface in inches per mile. The PSR is a subjective rating system based on a scale of 1 to 5. Prior to 1993, all pavement conditions were evaluated using PSR values. Exhibit 3-2 contains a description of the PSR system.
States are required to report IRI data for the Interstate system, other principal arterials, rural minor arterials, and the National Highway System regardless of functional system. IRI reporting is recommended for all other functional classifications. The use of IRI data for reporting the status of rural major collectors and urban minor arterials has increased to 59 percent and 49 percent respectively of the miles for each. The total of urban collector miles reported using IRI data has risen to 34 percent. The procedure of reporting pavement condition status by IRI data for all functional classes is increasing. The FHWA adopted the IRI for the higher functional classifications because this index uses a standardized procedure, is more consistent across jurisdictions, is an objective measurement, and is generally accepted as a worldwide pavement roughness measurement. The IRI system results in more consistent data for trend analyses and cross jurisdiction comparisons.
Exhibit 3-3 contains a description of qualitative pavement condition terms and corresponding quantitative PSR and IRI values. The translation between PSR and IRI is not exact; IRI values are based on objective measurements of pavement roughness, while PSR is a subjective evaluation of a broader range of pavement characteristics. For example, a given Interstate pavement section could have an IRI rating of 165, but might be rated a 2.4 on the PSR scale. Such a section would be rated as acceptable based on its IRI, but would not have been rated as acceptable had PSR been used. Thus, the mileage of any given pavement condition category may differ depending on the rating methodology. The historic pavement data in this report only go back to 1993, when IRI data began to be collected. Caution should be used when making comparisons with older data from earlier editions of this report and when attempting to make comparisons between PSR and IRI data in general.
The Federal Highway Administration 1998 National Strategic Plan introduced a new descriptive term for pavement condition: “acceptable ride quality.” That plan stated that by 2008, 93 percent of the National Highway System (NHS) mileage should meet pavement standards for “acceptable ride quality.” This goal was accomplished in 1999. The FHWA has adopted a new metric based on the percent of vehicle miles traveled (VMT) on acceptable pavement. This metric of “Ride Quality” places more emphasis on the benefits of good pavements to the users instead of the physical condition of pavements. The FHWA Fiscal Year 2003 Performance Plan established the goal to have 92.5 percent of all VMT on the NHS to be on highways rated as acceptable or better ride quality by the year 2003. Exhibit 3-4 shows that in the year 2000, 91.0 percent of the VMT on the NHS were on pavements with acceptable ride quality. This is an increase of 0.4 percent over 1999. The NHS is discussed in more detail in Chapter 24.
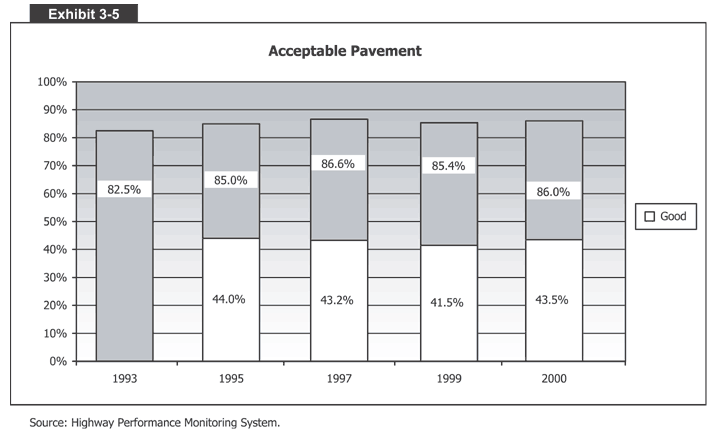
Please note that the remainder of this chapter retains the traditional approach of describing pavement condition in terms of miles, rather than in terms of VMT. To be rated acceptable, pavement performance must have an IRI value of less than or equal to 170 inches per mile. Good pavements comprise a subset of acceptable pavements. For a pavement to be rated as good, the IRI value must be less than or equal to 95 inches per mile. The Fiscal Year 2003 Performance Plan applies the same ride quality standard to all NHS routes, including those off the Interstate system. IRI is required to be reported for all NHS routes and is the preferred measure to determine acceptable ride quality. In this chapter, overall ride quality is presented based on the qualitative condition terms good, acceptable, and not acceptable. The correlation between these condition terms to the condition terms used in previous C&P reports and to the IRI or PSR system is presented in Exhibit 3-3. Overall Pavement ConditionThe highway systems covered in this chapter include all mileage except rural minor collectors and local functional classifications. Based on the new metrics for ride quality, 86.0 percent of total road mileage evaluated was rated acceptable in 2000, including 43.5 percent that met the standard for good. [See Exhibit 3-5].
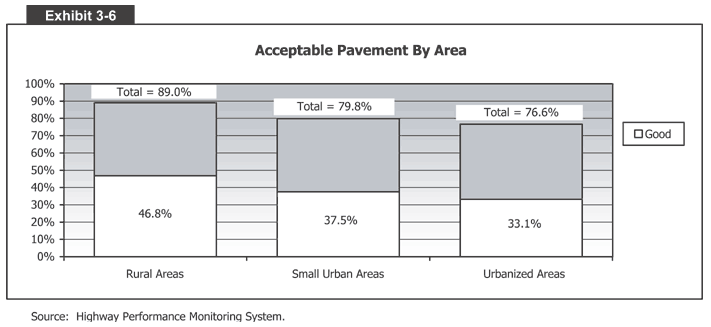
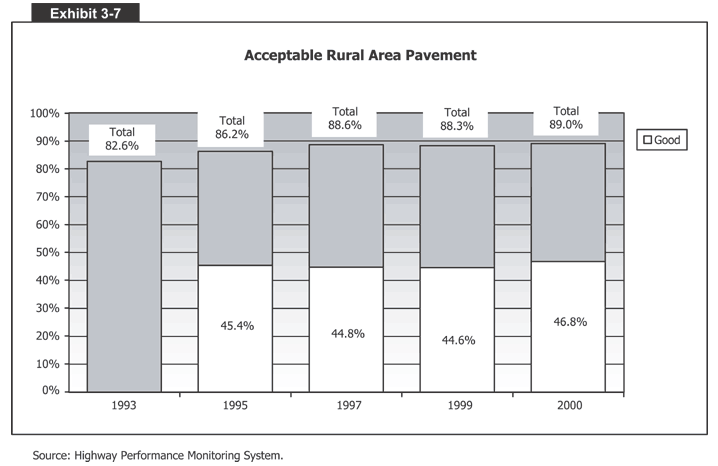
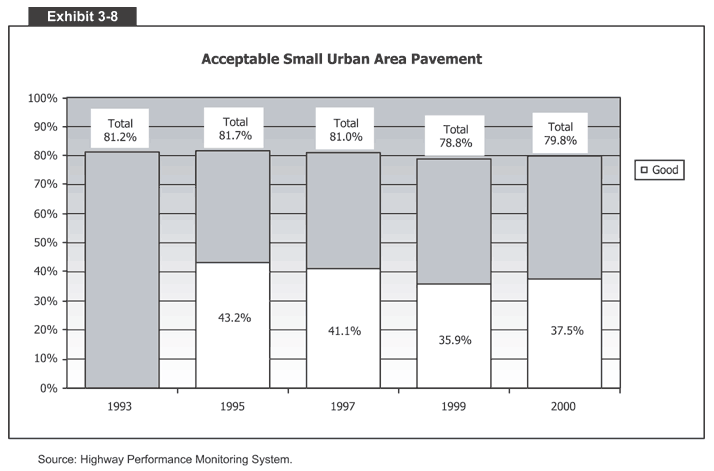
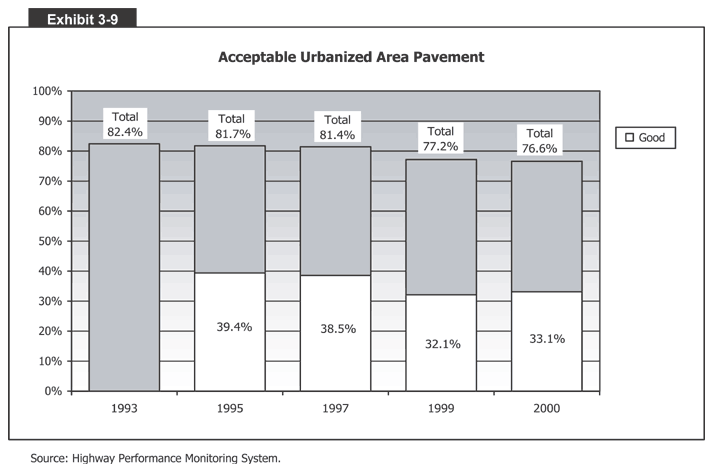
Rural and Urban Pavement ConditionsWhen discussing pavement conditions, it is important to note the different travel characteristics between rural and urban areas. As noted in Chapter 2, rural areas contain 78.2 percent of road miles, but only 39.4 percent of annual VMT. In other words, although rural areas have a larger percentage of road miles, the majority of travel is occurring in urban areas. According to 2000 data, pavement conditions in rural areas are slightly better than those in small urban and urbanized areas. 89.0 percent of total road miles in rural areas are rated acceptable while 79.8 percent of road miles in small urban areas are rated acceptable and 76.6 percent of the total road miles in urbanized areas are rated acceptable. The percentages shown as acceptable include mileage that also met the more stringent limit to be classified as good, 46.8 percent of rural miles, 37.5 percent of small urban miles, and 33.1 percent of urbanized miles. [See Exhibit 3-6]. Note that rural minor collectors and local functional system mileage are not included in these percentages. Pavement conditions in rural areas have generally been improving over time. Since 1993, the percentage of road miles in acceptable condition has increased from 82.7 percent to 89.0 percent in rural areas. However, both small urban and urbanized areas have experienced decreases in acceptable pavement miles from 81.2 percent to 79.8 percent and from 82.4 percent to 76.6 percent, respectively, since 1993. Comparable trends can be observed in the percentage of miles rated as good. [See Exhibits 3-7, 3-8, & 3-9]. Pavement Condition by Functional ClassificationAs stated in Chapter 2, the functional classification for approximately 68.8 percent of total mileage is “local.” Nevertheless, roads classified as “Interstate” have the largest percentage of VMT, followed by other principal arterials, minor arterials, and major collectors. Therefore, ride quality on Interstate routes affects more users than ride quality on lower functional classifications. Interstate mileage in rural areas is 97.8 percent acceptable. In small urban areas, Interstate mileage is 95.6 percent acceptable. In urbanized areas, Interstate mileage is 93.0 percent acceptable. For minor arterials, rural areas have a lower percentage of acceptable roads and a slightly higher percentage of miles of good roads than compared to urban areas. Urban areas also have a lower percentage of collector roads in acceptable condition and a lower percentage of collector roads miles in good condition when compared to rural areas. A historical view helps clarify where pavement improvements are occurring and at what rate. Exhibit 3-14 shows the pavement condition by category, functional classification, and location from 1993 to 2000 based on the revised ride quality standards incorporated in this report. The exhibit illustrates that pavement conditions have changed in a variety of ways. For example, since 1993, the percentage of Interstate miles in rural areas classified as acceptable has increased from 93.5 percent to 97.8 percent. The percentage of Interstate miles in urbanized areas rated as acceptable has increased from 89.8 percent to 93.0 percent. However, during the same time period, the percentage of Other Principal Arterials in urbanized areas listed as acceptable has decreased from 79.3 percent to 67.8 percent. Combining the rural, small urban, and urbanized Interstate data illustrates that, overall, Interstate pavement performance has improved since 1993. The percentage of all Interstate mileage with “acceptable ride quality” increased from 92.6 percent in 1993 to 96.6 percent in 2000. One consistent trend is the faster rate of pavement condition improvement in rural areas versus small urban and urbanized areas. Since 1993, the percent of total rural road miles classified as acceptable has increased in each of the four functional classes of rural roads. However, for the five functional classes of roads for small urban areas, two functional classifications—Interstate and Minor Arterials—have seen an increase in acceptable road miles, one functional class—Other Freeway and Expressway—has remained relatively stable, and two functional classes—Other Principal Arterials and Collectors—have experienced declines in acceptable road miles. For the five functional classes of roads for the urbanized areas, two functional classifications— Interstate and Other Freeway and Expressway— have seen an increase in acceptable road miles, and three functional classes have experienced declines in acceptable road miles—Other Principal Arterials, Minor Arterials, and Collectors. [See Exhibit 3-10].
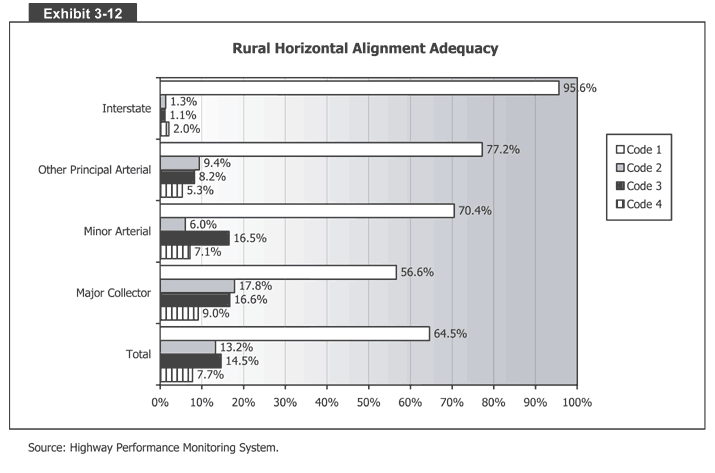
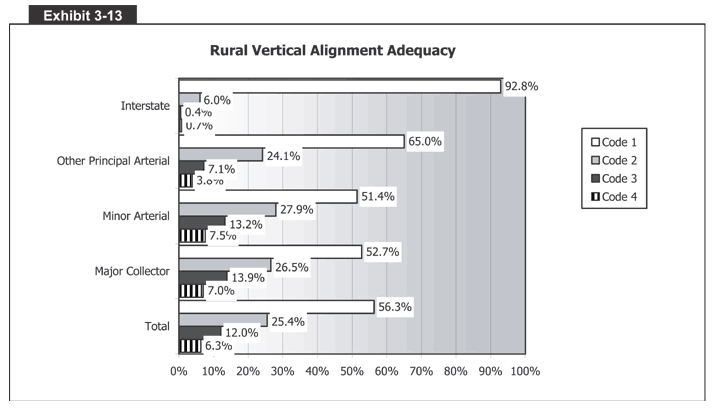
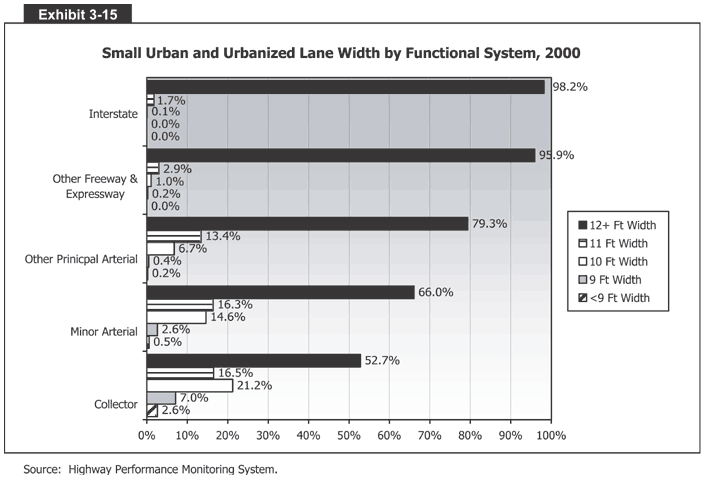
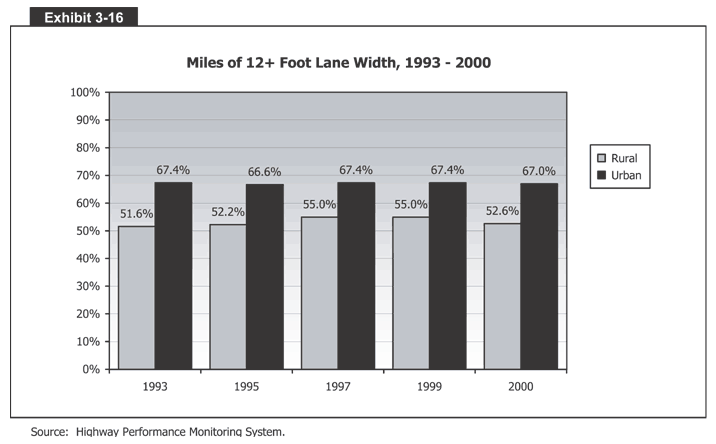
Roadway AlignmentAlignment adequacy affects the level of service and safety of the highway system. There are two types of alignment: horizontal and vertical. Inadequate alignment may result in speed reductions and impaired sight distance. In particular, trucks are affected by inadequate roadway alignment with regard to speed. Alignment adequacy is evaluated on a scale from Code 1 (best) to Code 4 (worst). Exhibit 3-11 explains the alignment rating system.
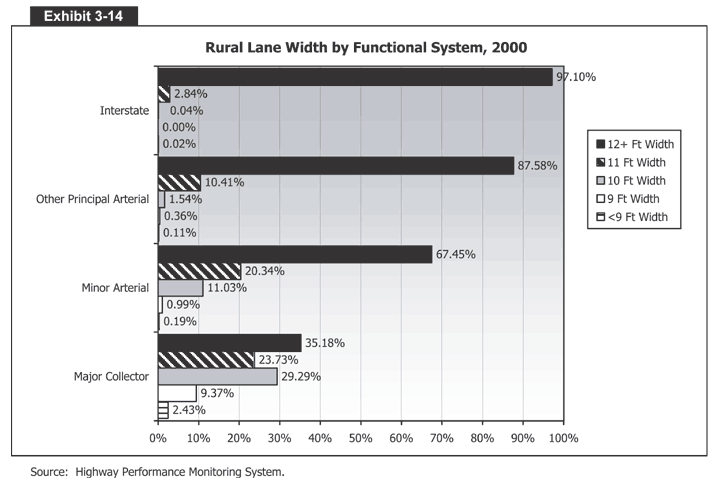
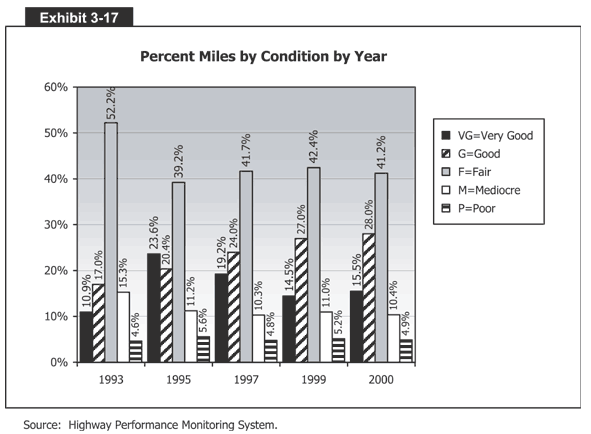
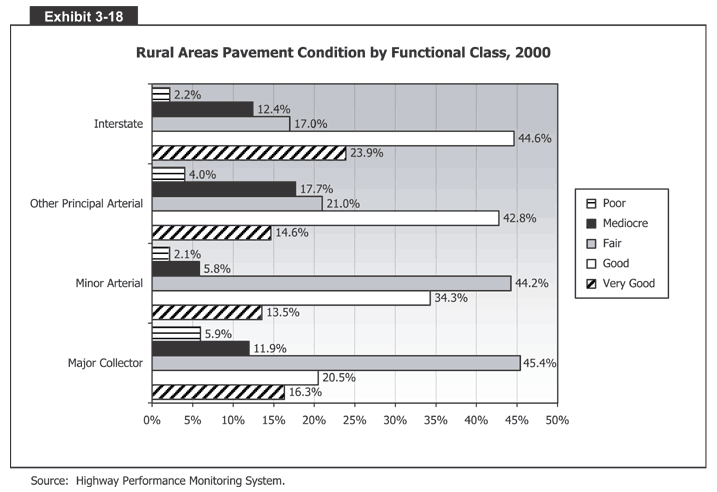
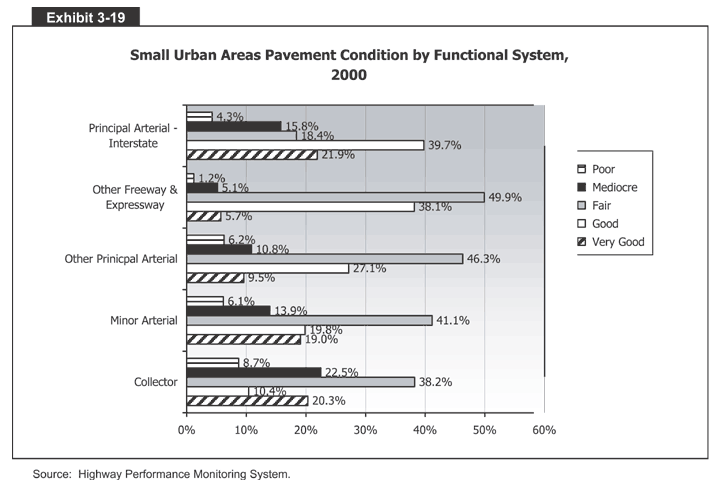
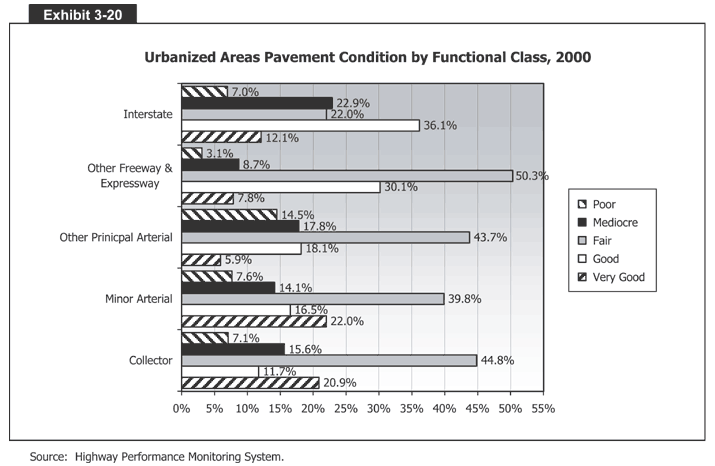
Adequate alignment is more important on roads with higher travel speeds and/or higher volumes (e.g., Interstates). Alignment is normally not an issue in urban areas, therefore this section only presents rural data. Exhibits 3-12 and 3-13 illustrate that 95.6 percent of rural Interstate miles are classified as Code 1 for horizontal alignment and 92.8 percent are classified as Code 1 for vertical alignment. The share of rural roads classified as Code 4 for horizontal alignment is 7.7 percent, and 6.3 percent are rated Code 4 for vertical alignment. Roadway alignment continues to improve gradually as sections with poor alignment are reconstructed. Lane WidthLane width affects capacity and safety; narrow lanes prevent a road from operating at capacity. As with roadway alignment, lane width is more crucial on functional classifications with the higher travel volumes. Currently, high-type facilities (e.g. Interstates) are expected to have 12-foot lanes. Exhibits 3-14 and 3-15 illustrate that over 97 percent of Interstate miles meet the 12-foot standard. The percentage of miles with 12 foot-plus-lane widths is lower on lower-type facilities that carry less traffic. Lanes that are less than 9 feet wide are mainly concentrated on the collector roads. Lanes have been widened over time through new construction, reconstruction, and widening projects. Since 1993, total rural mileage with lane width greater than or equal to 12 feet increased from 51.6 percent to 52.6 percent while the urban mileage with 12-foot-plus lanes decreased from 67.4 percent to 67.0 percent. Part of the urban decline may be attributable to the reclassification of roads from rural to urban as a result of population growth. [See Exhibit 3-16]. Pavement Condition Based on Old Classification SystemIn previous C&P reports, the condition of pavement was listed by very good, good, fair, mediocre, and poor. In order to provide reference and a bridge between the rating system in previous reports and the new system, the overall pavement condition based on 2000 HPMS data is shown in Exhibit 3-17. Following the previous rating system, 15.5% of the miles are in very good condition and 28.0% are in good condition. Since 1997, the percentage of mileage in very good condition fell 1.0 percent while the percentage of mileage in good condition increased 1.0 percent. The percentage of fair pavement decreased from 42.4 percent to 41.2 percent while the percentage of mediocre pavement decreased slightly from 11.0 percent to 10.4 percent. Finally, the percentage of poor pavement decreased slightly from 5.1 percent to 4.9 percent since 1997. Exhibits 3-18, 3-19, and 3-20 contain the portion of rural, small urban, and urbanized area pavement in the various condition categories, respectively, based on ride quality standards prior to the implementation of the revised standards. |
||||||||||||||||||||||||||||||||||||||||||||||||||||||||||||||||||||||||||||||||||||||||||||||||||||||||||||||||||||||||||||||||||||||||||||||||||||||||||||||||||||||||||||||||||||||||||||||||||||||||||||||||||||||||||||||||||||||||||||||||||||||||||||||||||||||||||||||||||||||||||||||||||||||||||||||||||||||||||||||||||||||||||||||||||||||||||||||||||||||||||||||||
| Back |