U.S. Department of Transportation
Federal Highway Administration
1200 New Jersey Avenue, SE
Washington, DC 20590
202-366-4000
|
Status
of the Nation's Highways, Bridges, and Transit:
2002 Conditions and Performance Report |
| Chapter 4: Operational Performance | ||||||||||||||||||||||||||||||||||||||||||||||||||||||||||||||||||||||||||||||||||||||||||||||||||||||||||||||||||||||||||||||||||||||||||||||||||||||||||||||||||||||||||||||||||||||||||||||||||||||||||||||||||||||||||||||||||||||||||||||||||||||||||||||||||||||||||||||||||||||||||||||||||||||||||||||||||||||||||||||||||||||||||||||||||||||||||||||||||||||||||||||||||||||||||||||||
|
Index Introduction Highlights Executive Summary Part I: Description of Current System
Part II: Investment Performance Analyses
Part III: Bridges
Part IV: Special Topics Part V: Supplemental Analyses of System Components
Appendices |
From the perspective of highway users, the ideal transportation system would move people and goods where they need to go when they need to get there, without damage to life and property, and with minimal costs to the user. Highway operational performance can be defined as how well the highway and street systems accommodate travel demand. Trends in congestion, speed, delay, and reliability are all potential metrics for measuring changes in operational performance over time. While congestion is conceptually easy to understand, it has no widely accepted definition. The public’s perception seems to be that congestion is getting worse, and by some measures it is. However, the perception of what constitutes congestion varies from place to place. What may be considered congestion in a city of 300,000 may be greatly different than perceived traffic conditions in a city of 3 million people, based on varying history and expectations. These differences of opinion make it difficult to arrive at a consensus of what congestion means, the affect it has on the public, its costs, how to measure it, and how best to correct or reduce it. Because of this uncertainty, transportation professionals examine congestion from several perspectives. Three key aspects of congestion are severity, extent, and duration. The severity of congestion refers to the magnitude of the problem at its worst. The extent of congestion is defined by the geographic area or number of people affected. The duration of congestion is the length of time that the traffic is congested, often referred to as the “peak period” of traffic flow. Daily vehicle miles of travel (DVMT) per lane mile is the most basic measure of how much travel is being accommodated on our highway systems, since it is directly based on actual counts of traffic rather than estimated from other data. An increase in this measure over time indicates that the density of traffic is increasing, but does not indicate how this affects speeds, delay, or user costs. The traditional congestion measure in this report has been volume service flow (V/SF) ratio, the ratio of the volume (V) of traffic using a road in the peak travel hour to the theoretical capacity or service flow (SF). V/SF is limited because it only addresses the peak hour and does not measure the duration of congestion. In many communities, the major operational performance issue is not that peak congestion is getting worse; it is that the peak period is spreading to occupy an increasing part of the travel day. Focusing on the V/SF measure alone can lead to erroneous conclusions about highway operational performance. The 1999 Conditions and Performance report adopted a measure of hours of delay per 1000 vehicle miles to incorporate the effects of congestion throughout the day, not only during the peak hour of travel. Since that report was issued, the FHWA has revised its methodology for calculating delay, and has adopted new indicators for measuring congestion. This report will focus mainly on these new metrics, Percent of Additional Travel Time, Annual Hours of Delay, and Percent of Travel Under Congested Conditions. The Concern with Operational PerformanceOperational performance is a growing concern because greater demands are being placed on the Nation’s highways and streets. Demand for highway travel by American residents is continually increasing:
New Operational Performance MeasuresAs indicated earlier, the primary operational performance measures used in this chapter will be Percent of Additional Travel Time, Annual Hours of Traveler Delay, and Percent of Travel Under Congested conditions. These measures are also included in the FHWA Fiscal Year 2003 Performance Plan.
Percent of Additional Travel TimeThe Percent of Additional Travel Time is an indicator of the additional time required to make a trip during the congested peak travel period rather than at other times of the day. This measure accounts for the additional time required due to increased traffic volumes on the highway and the additional delay caused by crashes, poor weather, special events, or other non-recurring incidents. It is expressed as the percent of additional time required to make a trip during the congested period of travel. Exhibit 4-2 shows the how the Percent of Additional Travel Time has grown over time. In 2000 an average peak period trip required 51 percent longer than the same trip under non-peak, non-congested, conditions. In 1987, an average 20-minute trip during non-congested periods required 25.8 minutes under congested conditions. The same trip in 2000 required 30.2 minutes or an additional 4.4 minutes. Note that while the values for different years are generally comparable, they are based on data for different numbers of areas in different years as shown in Exhibit 4-2. The same number of communities was used in the determination of the remaining two performance measures.
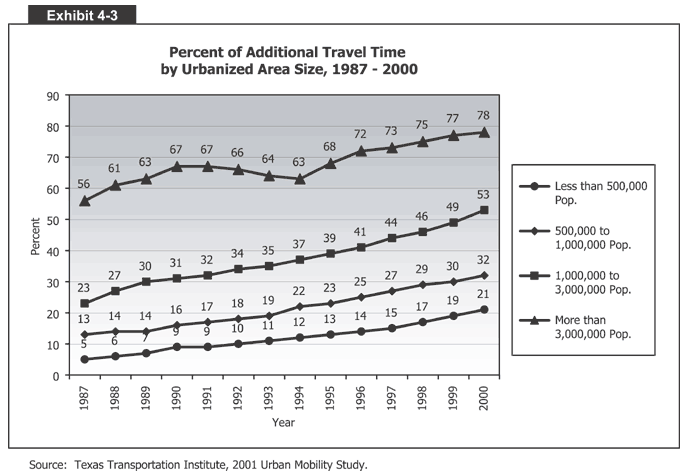
Exhibit 4-3 demonstrates that the additional travel time required due to congestion tends to be higher in larger urbanized areas than smaller ones. However, the largest increase from 1987 to 2000 occurred in urbanized areas with populations between 1,000,000 and 3,000,000, as the Percent of Additional Travel Time increased from 23 to 53 percent. This equates to a 6.0-minute increase (from 24.6 to 30.6 minutes) for an average trip that would require 20 minutes during non-congested periods.
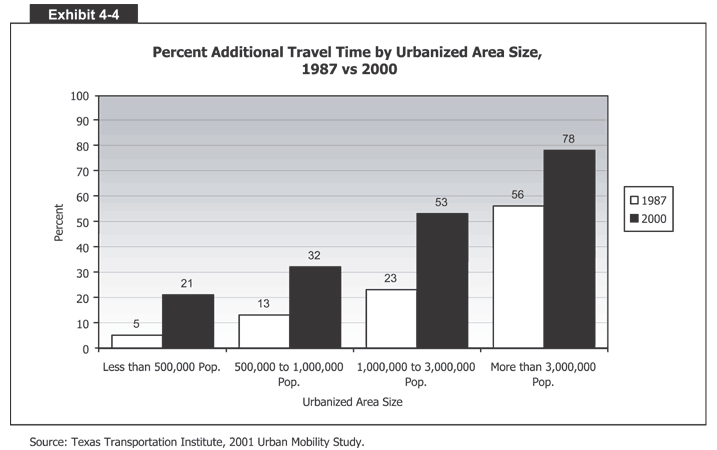
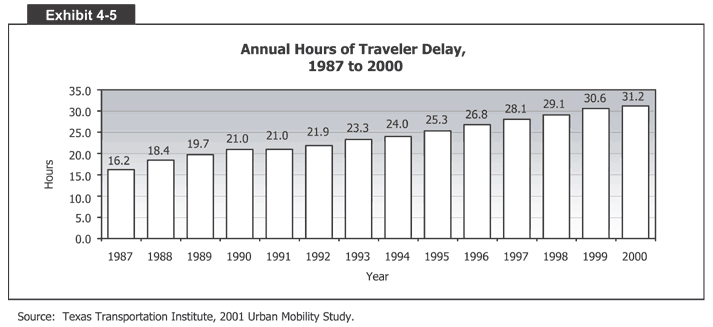
Exhibit 4-4 directly compares the years 1987 and 2000 to emphasize the impact of increased congestion. The exhibit shows that, in 2000, smaller urbanized areas with a population of less than 500,000 population are experiencing close to the same level of additional travel time due to congestion as urbanized areas with populations of 1,000,000 to 3,000,000 experienced in 1987. This indicates a growing and expanding problem for the Nation’s urban highway system. Annual Hours of DelayThe annual hours of delay represents the average number of hours that drivers are delayed in traffic per year due to recurring congestion and incidents, such as breakdowns and crashes. Exhibit 4-5 shows that, in 2000, the average driver experienced a loss of 31.2 hours due to congestion. This is an increase of 3.1 hours over the amount of annual delay in 1997 or an increase of more than 11 percent over a three-year period. Exhibit 4-6 shows that cities over 3 million in population have experienced an increase of 2 hours in the Annual Hours of Delay per traveler since 1997. The average delay per traveler for these cities was 41.3 hours per driver per year in 2000. Cities with populations between 1,000,000 and 3,000,000 experienced the greatest increase in number of hours of annual delay per person, from 31.1 hours in 1997 to 36.4 hours in 2000. This is an increase of 5.3 hours of delay per person per year. Cities with populations of less than 500,000 experienced the greatest percentage growth in Traveler Delay since 1997—from 12.7 hours to 15.2 hours, an increase of almost 20 percent.
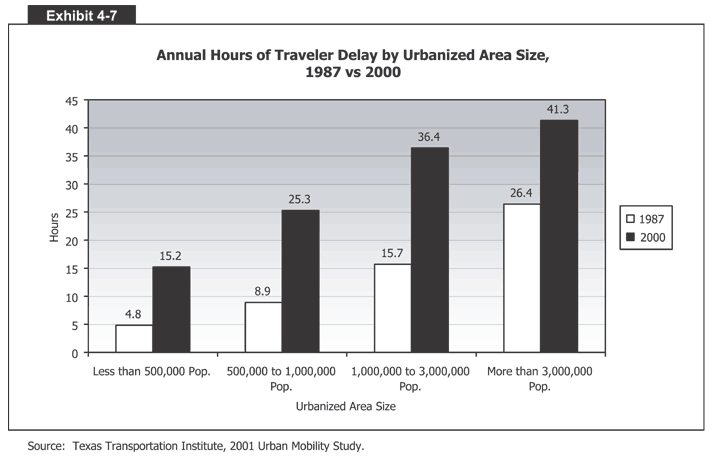
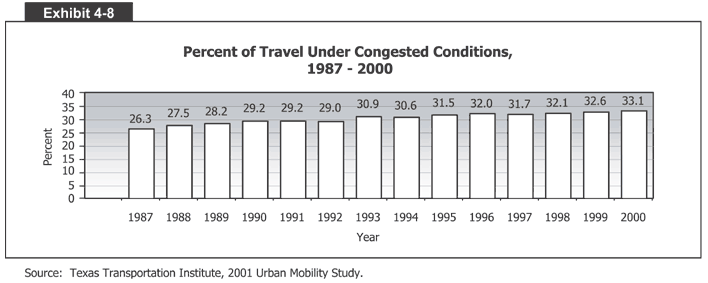
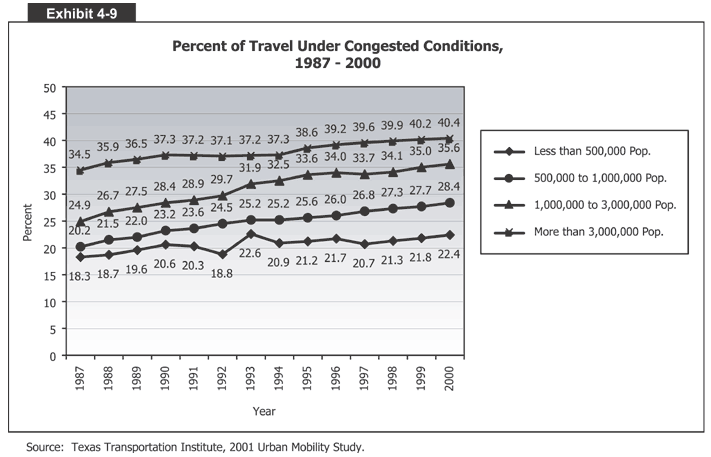
The significance of the impact in increased Annual Hours of Delay is shown in Exhibit 4-7. A comparison between the years 1987 and 2000 shows that drivers in cities with populations under 500,000 are experiencing close to the same delays in 2000 as drivers experienced in communities with populations between 1,000,000 and 3,000,000 in 1987. In a span of 13 years, the level of congestion has affected smaller cities to a point equivalent to cities 4 to 6 times their size in 1987, but without the accompanying population growth. Percent of Travel Under Congested ConditionsThe Percent of Travel Under Congested Conditions is defined as the percentage of daily traffic on freeways and principal arterial streets in urbanized areas moving at less than free-flow speeds. Exhibit 4-8 shows that this percentage has increased from 31.7 percent in 1997 to 33.1 percent in 2000. The average congested travel period has increased from approximately 5 hours in 1997 to approximately 5.3 hours in 2000—an increase in length of 18 minutes. Exhibit 4-9 shows that in urban areas with populations greater than 3,000,000, 40.4 percent of daily travel in 2000 was under congested conditions. For urban areas with populations of less than 500,000, the Percent of Congested Travel was 22.4 percent in 2000.
According to work by TTI, periods of recurring congestion are getting longer. What was formerly called “rush hour” can range from approximately 4 hours per day in small metropolitan areas to nearly 8 hours per day in very large metropolitan areas. This indicates that, in some places, recurring congestion is now no longer restricted to the traditional peak commuting periods, but may continue from morning to evening on weekdays. Recurring congestion also occurs on heavily traveled routes on Saturdays and Sundays. Not only are congestion periods lengthening but more roads and lanes are affected at any one time. In the past, recurring congestion tended to occur only in one direction—toward downtown in the morning and away from it in the evening. Today, two-directional congestion is common, particularly in the most congested metropolitan areas. Cost of CongestionCongestion has an adverse impact on the American economy, which values speed, reliability, and efficiency. Transportation is a critical link in the production process for many businesses as they are forced to spend money on wasted fuel and drivers’ salaries that might otherwise be invested in research and development, firm expansion, and other activities. The problem is of particular concern to firms involved in logistics and distribution. As just-in-time delivery increases, firms need an integrated transportation network that allows for the reliable, predictable shipment of goods. Congestion, then, is a major hurdle for businesses in the developing economy. The Texas Transportation Institute’s 2001 Urban Mobility Report estimates that in the 68 urban areas studied in 1999, drivers experienced 4.48 billion hours of delay and wasted 6.8 billion gallons of fuel. Total congestion cost for these areas, including wasted fuel and time, was estimated to be about $77.8 billion. Almost 58 percent of that cost, or approximately $45.1 billion, was experienced in the 10 metropolitan areas with the most congestion. Exhibit 4-10 shows the 20 urban areas with the highest congestion costs, according to the Texas Transportation Institute.
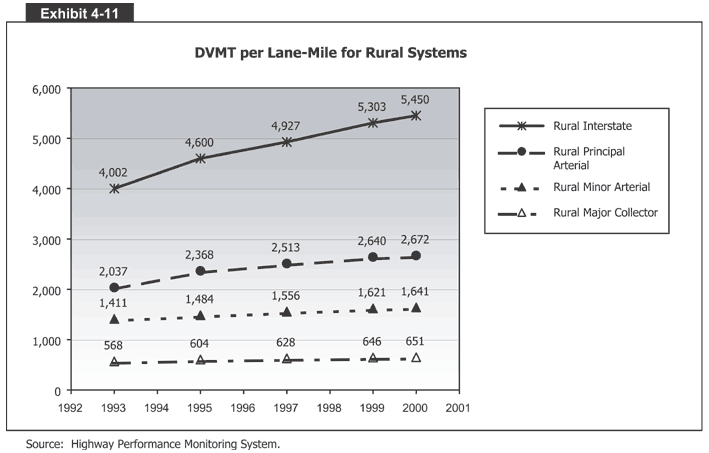
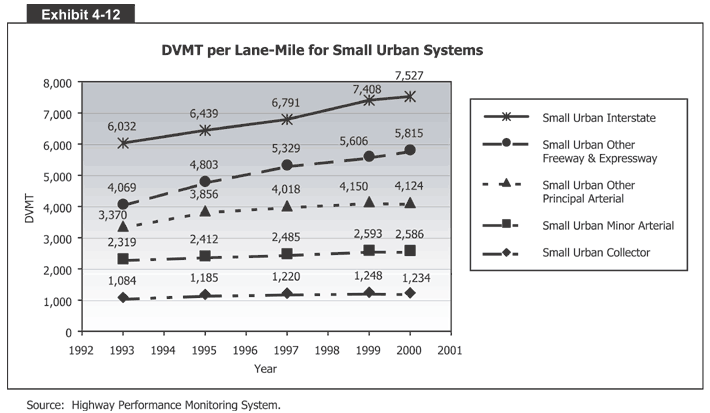
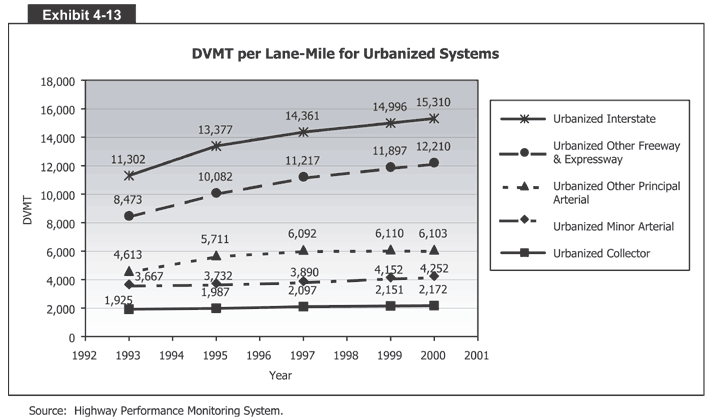
Safety Effects of CongestionRecent newspaper stories about “road rage” highlight the escalating problem of congestion in the United States. Increased congestion levels or the length of time driving in peak congested periods has an impact on the behavior and stress levels of drivers. A recent report completed by the Texas Transportation Institute entitled Understanding Road Rage: Evaluation of Promising Mitigation Measures indicates the possibility of increased aggressive driving in congested conditions. The report cited three studies designed to measure the stress levels of drivers under various driving conditions. These indicated a trend towards higher stress levels in drivers when driving in congested conditions as opposed to non-congested conditions. Drivers under greater stress may tend to drive in a more aggressive manner, creating the potential for additional crashes or incidents. Additional study would be needed to verify this hypothesis. Other Operational Performance Measures:Length of Time of Trip and Average Trip SpeedWhereas the new FHWA operational performance measures suggest that congestion is getting worse on average, the individual traveler’s experience of congestion may be very different. The Nationwide Personal Transportation Survey (NPTS) reports from a sample of U.S. households that the average commute took slightly longer in 1995 than in 1983 (21 minutes versus 18 minutes one-way) but was over a greater distance (11.6 miles in 1995 versus 8.5 in 1983). The average commuting speed, including trips by all modes, went from 28 mph in 1983 to 34 mph in 1995. While this trend seems to fly in the face of the increasing congestion, it reflects the fact that the NPTS measures the individual’s experience with the system rather than a system-wide indicator. The individual, who may be doing a greater portion of the commute in the outer suburban fringe, could have a higher average speed even though congestion on the roads in the more densely populated areas had increased. DVMT per Lane-MileAs discussed earlier in this chapter, DVMT per Lane-Mile is a basic measure of travel density that does not fully capture the effects of congestion. However, this measure does provide an indication that the demand for travel is growing faster than the supply of highways. Exhibits 4-11, 4-12 and 4-13 show that the volume of travel per lane mile has increased from 1993 to 2000 on every functional highway system for which data are collected. V/SF RatioAs discussed earlier in this chapter, the V/SF ratio compares the number of vehicles (V) traveling in a single lane in one hour with the theoretical saturation flow (SF), or the theoretical maximum number of vehicles that could utilize the lane in an hour. The major shortcoming of the V/SF ratio is that it is a single-time indicator of congestion; in other words, it provides a snapshot of what is occurring on a highway section at a particular time, but does not provide a measure of the length of time of a congested period. Also, it does not provide an indication of the effect on congestion caused by emergency situations, adverse weather conditions, construction activities, or other congestion-creating events other than those caused by additional traffic on a facility. Exhibit 4-14 shows the percentage of peak-hour travel meeting or exceeding a V/SF of 0.80 and 0.95. A level of 0.80 is frequently used as a threshold for classifying highways as “congested” while a level of 0.95 is frequently described as “severely congested.” For urbanized Interstates, 33.4 percent had peak-hour travel with a V/SF ratio of 0.80 or higher. Not surprisingly, the values for small urban and rural Interstates were lower.
This measure of congestion severity shows mixed results, as the values for some functional classes have increased since 1997 while others have declined. This indicates that the increases in congestion indicated by broader measures such as the Annual Hours of Traveler Delay, cited earlier, may be a function of increases in the duration and extent of congestion, which are aspects of the problem that the V/SF ratio does not capture.
Future ResearchMeasurement of congestion is still a difficult problem. Substantial research has supported the use of delay as the definitive measure of congestion, and delay is certainly important. It exacts a substantial cost from the traveler and consequently from the consumer. However, it does not tell the complete story. Moreover, we currently have no direct measure of delay that is inexpensive and reliable to collect. Reliability is another important characteristic of any transportation system, one that industry in particular requires for efficient production. If a given trip requires one hour on day one and one and a half hours on day two, an industry that is increasingly relying on “just in time” delivery suffers. It cannot plan effectively for variable trip times. Additional research is needed to determine what measures should be used to describe congestion and what data will be required to supply these measures. System ReliabilityThe FHWA Fiscal Year 2003 Performance Plan adopted a new measure of reliability—the Buffer Index. This index measures the percentage of extra time travelers allow for congestion in order to arrive at a location on-time 95 percent of the time. Data are currently available for 10 cities, but efforts are underway to expand the sample. This measure and other measures currently under development will be refined and applied to additional cities as detectors are deployed and data are accumulated. BottlenecksA November 1999 report prepared by Cambridge Systematics for the American Highway Users Alliance entitled Unclogging America’s Arteries: Prescriptions for Healthier Highways listed 167 locations in urban areas that it classified as bottlenecks. These were areas where traffic congestion occurs due to sudden reduction in number of lanes or a major increase in traffic volume for a specific freeway section beyond its capacity. The report estimated the benefits resulting from eliminating the 18 worst bottleneck locations. Improvements to these locations were estimated to prevent 287,000 crashes including 1,150 fatalities and 141,000 injuries. Major reductions in pollutants were also cited as a benefit. User delay was estimated to be reduced by 71 percent, which translates to approximately 40 minutes each day per commuter. Further research into bottlenecks and the benefits of addressing them could be of significant value in determining the best ways to address growing congestion in the Nation’s urbanized areas. Deployment of ITS Systems The deployment of intelligent transportation systems (ITS) technologies
provides opportunities for improved measurement of performance. For example,
speeds and travel time could be measured directly and unobtrusively by
sensors in or beside roadways, rather than through rough approximations
based on vehicle counts or surveys. To obtain valid performance measures
from ITS technology, methods are needed to compile sensor data into databases,
and to aggregate and analyze the data into useful statistics. |
|||||||||||||||||||||||||||||||||||||||||||||||||||||||||||||||||||||||||||||||||||||||||||||||||||||||||||||||||||||||||||||||||||||||||||||||||||||||||||||||||||||||||||||||||||||||||||||||||||||||||||||||||||||||||||||||||||||||||||||||||||||||||||||||||||||||||||||||||||||||||||||||||||||||||||||||||||||||||||||||||||||||||||||||||||||||||||||||||||||||||||||||||||||||||||||||
| Back |