U.S. Department of Transportation
Federal Highway Administration
1200 New Jersey Avenue, SE
Washington, DC 20590
202-366-4000
Conditions and Performance
Status
of the Nation's Highways, Bridges, and Transit:
2002 Conditions and Performance Report
|
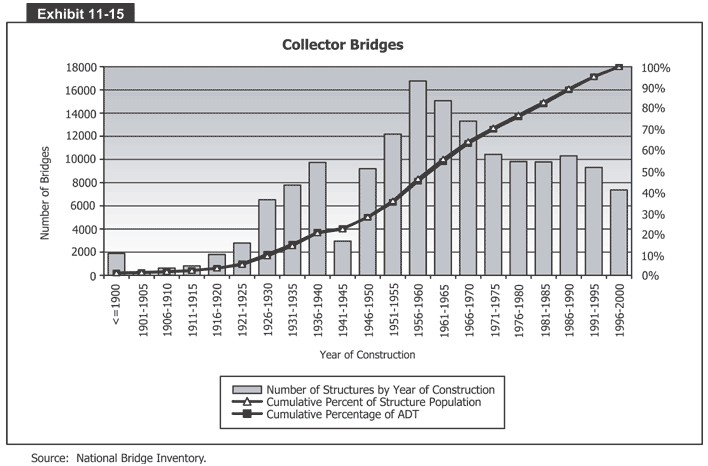
Exhibit 11-15:
Collector Bridges
 Exhibit 11-15 is a bar graph that shows the construction of collector bridges. The vertical axis measures number of bridges from 0 to 18,000 in increments of 2,000 bridges. The horizontal axis has 21 bars, one for each 5-year period between 1900 and 2000. New collector bridges were less than 2,000 for each period to 1920, then rose sharply to 6,500 by 1930 and almost 10,000 by 1940. The figure dropped during WWII, then rose steadily again to 12,000 in 1955 and a peak of 16,800 in 1960. The numbers then drop steadily to 13,200 in 1970, about 10,000 from 1971 to 1990, and 7,200 by 2000. There are also two lines and a second vertical axis (measuring percentages from 0 to 100 in increments of 10 percent) in this chart. The first, representing cumulative percent of structure population, rises slowly from 0 in 1900 to 20 percent by 1940, 30 percent by 1955, 65 by 1970, 90 by 1990, and 100 by 2000. The other line, representing cumulative percentage of ADT, runs the same course.
Source: National Bridge Inventory.
Back
to Chapter 11
Return to top
Page last modified on November 7, 2014
