U.S. Department of Transportation
Federal Highway Administration
1200 New Jersey Avenue, SE
Washington, DC 20590
202-366-4000
Conditions and Performance
Status
of the Nation's Highways, Bridges, and Transit:
2002 Conditions and Performance Report
|
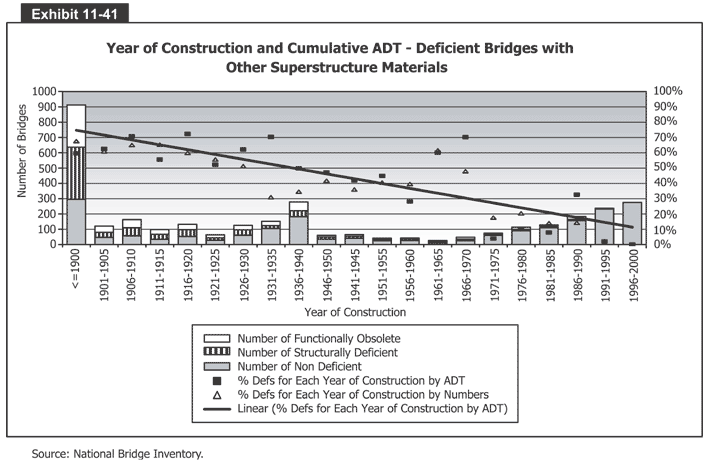
Exhibit 11-41:
Year of Construction and Cumulative ADT - Deficient Bridges with Other Superstructure
Materials
 Exhibit 11-41 is a bar graph that shows the year of construction and cumulative ADT for deficient bridges made of "other" superstructure materials. The vertical axis measures number of bridges from 0 to 1,000 in increments of 100 bridges. The horizontal axis has 21 bars, one for each 5-year period between 1900 and 2000. Each bar has three parts, measuring the distribution of functionally obsolete, structurally deficient, and non-deficient "other" bridges. Before 1900, the Nation's 900 other-material bridges were split evenly between non-deficient, deficient, and obsolete. That trend continued as fewer than 170 "other" bridges were built for each of the periods from 1900 to 1930. After 1930, the proportion of non-deficient "other" bridges grew from around two-thirds to nearly 0 by 1990. There are three other items and a second vertical axis (measuring percentages from 0 to 100 in increments of 10 percent) in this chart. A line, representing the "linear" percent of deficient "other" bridges for each year of construction by ADT, starts in 1900 at about 75 percent and drops in a straight line to 50 percent by 1935, 30 by 1970, 18 by 1990, and just over 10 by 2000. A series of small squares, representing the percent of deficient other bridges for each year of construction by ADT, starts at about 60 percent, climbs to a peak of 75 percent by 1920, drops to 50 in 1925, rises to 70 by 1935, drops steadily to a low of 28 percent by 1960, rises sharply to 70 by 1970, plummets to 5 by 1975, rises to 32 by 1990, and ends at 0 by 2000. And a series of small triangles, representing the percent of deficient other bridges for each year of construction by numbers, fluctuates a little less wildly. It starts at 70 percent in 1900, falls slowly to 50 by 1930, drops to 30 by 1935, hovers between 35 and 40 until 1960, rises to 60 in 1965, plummets to 20 in 1975, and stays between 10 and 20 through to 2000.
Source: National Bridge Inventory.
Back
to Chapter 11
Return to top
Page last modified on November 7, 2014
