U.S. Department of Transportation
Federal Highway Administration
1200 New Jersey Avenue, SE
Washington, DC 20590
202-366-4000
Conditions and Performance
Status
of the Nation's Highways, Bridges, and Transit:
2002 Conditions and Performance Report
|
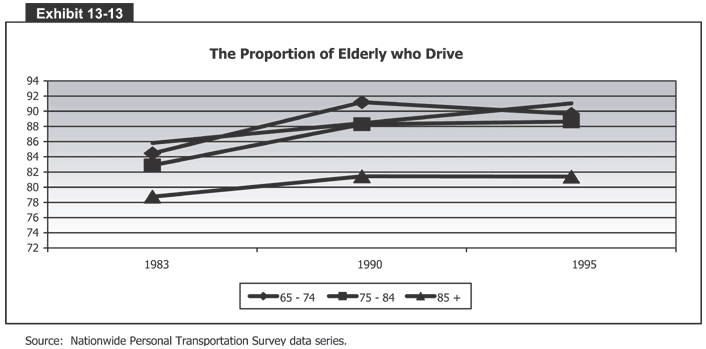
Exhibit 13-13:
The Proportion of Elderly who Drive
 Exhibit 13-13 is a bar graph that shows the proportion of elderly who drive. The vertical axis measures percentages from 72 to 94 in increments of 2 percent. The horizontal axis has 3 years: 1983, 1990, and 1995. There are three lines, one for each age group. The percent of those aged 65 to 74 who drove in 1983 was 84.5 percent, 91 percent in 1990, and 90 in 1995. The percent of those aged 75 to 84 who drove in 1983 was 82.5 percent, 88 percent in 1990, and 88.5 in 1995. And the percent of those aged 85 and over who drove in 1983 was 78.5 percent, 81 percent in 1990, and 81 in 1995.
Source: Nationwide Personal Transportation Survey data series.
Back
to Chapter 13
Return to top
Page last modified on November 7, 2014
