U.S. Department of Transportation
Federal Highway Administration
1200 New Jersey Avenue, SE
Washington, DC 20590
202-366-4000
Conditions and Performance
Status
of the Nation's Highways, Bridges, and Transit:
2002 Conditions and Performance Report
|
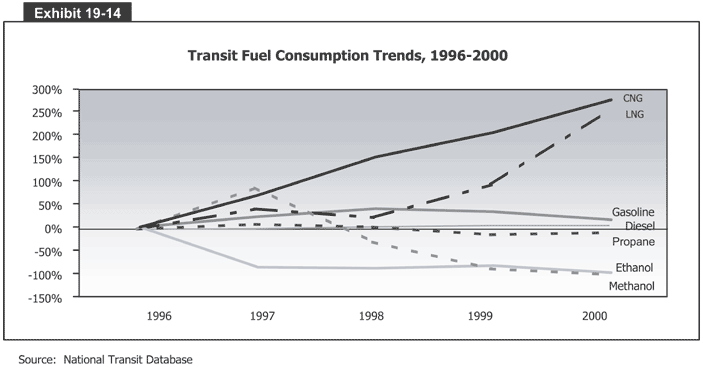
Exhibit 19-14:
Transit Fuel Consumption Trends, 1996-2000
 Exhibit 19-14 is a chart that shows transit fuel consumption trends from 1996 to 2000. The vertical axis measures percent change from -150 to 300 in increments of 50 percent. The horizontal axis shows the five years from 1996 to 2000. There are seven lines, one for each fuel type. CNG consumption has increased 280 percent over the five-year period. LNG consumption increased 50 percent in 1997, dropped slightly in 1998, then rose rapidly to 250 by 2000. Gasoline consumption increased 50 percent by 1998 but then dropped back down to about 10 percent by 2000. Diesel fuel consumption has a marginal increase over the time period. Propane use had a slight increase over 0 in 1997 and 1998 but dipped just below 0 for 1999 and 2000. Ethanol use peaked at 75 percent greater in 1997 but dropped steadily to -25 in 1998 and -100 in 1999 and 2000. And methanol use dropped -100 percent in 1997, where the line stayed through to 2000.
Source: National Transit Database.
Back
to Chapter 19
Return to top
Page last modified on November 7, 2014
