U.S. Department of Transportation
Federal Highway Administration
1200 New Jersey Avenue, SE
Washington, DC 20590
202-366-4000
Conditions and Performance
Status
of the Nation's Highways, Bridges, and Transit:
2002 Conditions and Performance Report
|
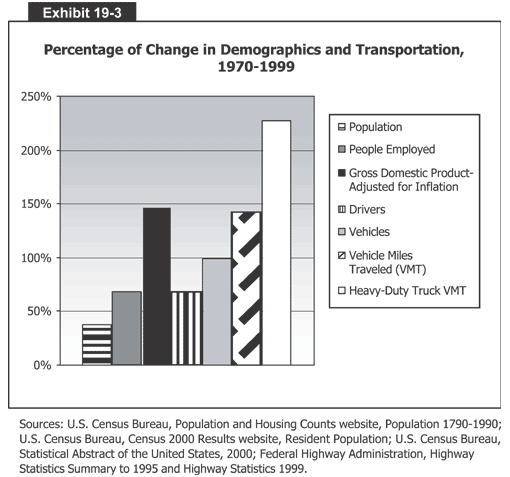
Exhibit 19-3:
Percentage of Change in Demographics and Transportation, 1970-1999
 Exhibit 19-3 is a bar graph that shows the percentage of change in demographics and transportation from 1970 to 1999. The vertical axis measures percent change from 0 to 250 in increments of 50 percent. The horizontal axis has seven bars, one for each demographic. Population is 40 percent greater in 1999 than 1970, people employed is 65 percent greater, gross domestic product (adjusted for inflation) is 145 percent greater, drivers is 100 percent greater, vehicle miles traveled is 142 percent greater, and heavy duty truck VMT is 225 percent greater.
Source: U.S. Census Bureau, Population and Housing Counts website, Population
1790-1990; U.S. Census Bureau, Census 2000 Results website, Resident Population;
U.S. Census Bureau, Statistical Abstract of the United States, 2000; Federal Highway
Administration, Highway Statistics Summary to 1995 and Highway Statistics 1999.
Back
to Chapter 19
Return to top
Page last modified on November 7, 2014
