U.S. Department of Transportation
Federal Highway Administration
1200 New Jersey Avenue, SE
Washington, DC 20590
202-366-4000
|
Status
of the Nation's Highways, Bridges, and Transit:
2002 Conditions and Performance Report |
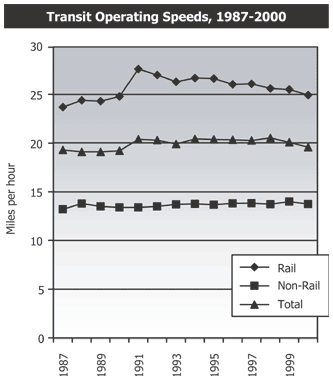
Exhibit ES07A is a chart that shows transit operating speeds between 1987 and 2000. The vertical axis measures miles per hour from 0 to 30 in increments of 5 mph. The horizontal axis measures every year between 1987 and 2000. Rail operating speeds rose between 1987 and 1991, from 23 mph in 1987 to 24 in 1988 and 1989, to 25 in 1990 and 28 mph in 1991. Then rail operating speeds declined gradually from 27 mph in 1992 to 25 mph in 2000. Non-rail transit operating speeds were slower but steadier during the time period, hovering around 13 to 14 mph between 1987 and 2000. Total transit operating speeds split the difference between rail and non-rail, staying at about 19 mph between 1987 and 1990. It increased slightly and stayed around 20 mph between 1991 and 1999, falling to 19 mph again in 2000.
Back
to Executive Summary

