U.S. Department of Transportation
Federal Highway Administration
1200 New Jersey Avenue, SE
Washington, DC 20590
202-366-4000
|
Status
of the Nation's Highways, Bridges, and Transit:
2002 Conditions and Performance Report |
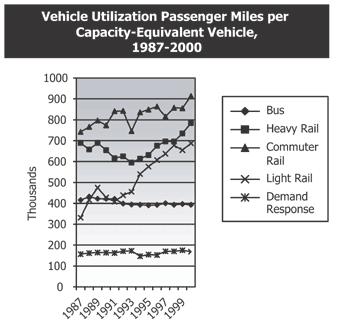
Exhibit ES07B is a chart that shows vehicle utilization passenger miles (VUPM) per capacity-equivalent vehicle from 1987 to 2000. The vertical axis measures VUPM in thousands from 0 to 1000 in increments of 100. The horizontal axis measures every year between 1987 and 2000. Demand response vehicles had a consistently low VUPM, rising slightly from about 150,000 to 180,000 between 1987 and 1993, dipping to about 140,000 in 1994, and rising gradually again to about 180,000 in 2000. Buses had a consistent VUPM, hovering around 420,000 between 1987 and 1991, then dipping slightly and staying at 400,000 between 1992 and 2000. Light rail started low in 1987 and increased greatly by 2000; its VUPM was around 320,000 in 1987, 410,000 in 1988, 480,000 in 1989, back down to 420,000 in 1990, 400,000 in 1991, 430,000 in 1992, 450,000 in 1993, spiking to 530,000 in 1994, 580,000 in 1995, 600,000 in 1996, 630,000 in 1997, 670,000 in 1998, 650,000 in 1999, and peaking at 690,000 in 2000. Heavy rail had the second-highest VUPM, making a u-shaped trajectory between 1987 and 2000; it started at about 700,000 VUPM in 1987, dipped to 660,000 in 1988, rose back to 700,000 in 1989, dipped to 660,000 in 1990, was 610,000 in 1991, 620,000 in 1992, 600,000 in 1993, 610,000 in 1994, 620,000 in 1995, rose to 690,000 in 1996, 700,000 in 1997 and 1998, 730,000 in 1999, and peaked at 790,000 in 2000. Commuter rail had the highest VUPM during the time period, starting at about 730,000 VUPM in 1987, rising to 760,000 in 1988, 800,000 in 1989, 770,000 in 1990, 830,000 in 1991 and 1992, falling to 730,000 in 1993, rising again to 830,000 in 1994, 840,000 in 1995, 850,000 in 1996, 810,000 in 1997, 850,000 in 1998 and 1999, and peaking at 900,000 in 2000.
Back
to Executive Summary

