U.S. Department of Transportation
Federal Highway Administration
1200 New Jersey Avenue, SE
Washington, DC 20590
202-366-4000
|
Status
of the Nation's Highways, Bridges, and Transit:
2002 Conditions and Performance Report |

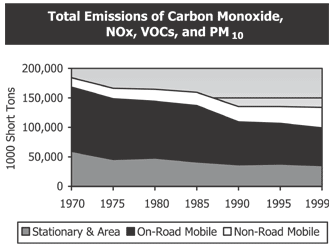
Exhibit ES47B is a chart that shows the decline in the total emission of carbon monoxide, NOx, VOCs, and PM10. The vertical axis measures short tons in thousands from 0 to 200,000 in increments of 50,000. The horizontal axis measures the years 1970, 1975, 1980, 1985, 1990, 1995, and 1999. The first of three emission types, non-road mobile, declined from about 180,000 in 1970 to 140,000 in 1999, with two drops coming between 1970-75 and 1985-90. The trajectory of the second emission type, on-road mobile, parallels the path of the first, starting at about 170,000 in 1970 and ending at about 100,000 in 1999, with drops coming during the same two periods. The third emission type, stationary and area, has stayed relatively steady, starting at about 55,000 in 1970 and ending at about 45,000 in 1999, with the only significant drop coming between 1970-75.
Back
to Executive Summary